


FEDS Notes
August 11, 2026
Private Credit and Leveraged Loan Markets: Similarities, Differences, and Substitution
Ayelen Banegas, Sophia Castelo, Ahmet Degerli, Christine Dobridge, and Will Kennedy 1
On August 13, 2026, the notes for figures 4 through 12 were revised to cite the methodology of Hinzen et al. (2026).
Private credit (PC) and leveraged loan (LL) markets are two key sources of financing for below-investment-grade middle-market firms, typically those with revenues between $10 million and $1 billion.2 Although these two markets have different structures and rely on different lenders, they have become increasingly interconnected in recent years, with some firms seeking financing in both markets.
Recent deterioration of investor sentiment in the PC market has raised concerns that a contraction in credit availability in this market may curtail the ability of some middle-market firms to obtain financing. This note examines lender composition and borrower characteristics of PC and LL markets, substitution patterns across these two markets, and the broader financing implications of a PC pullback for risky, middle-market firms.
The analysis shows that, while both markets serve broadly similar industries and credit profiles, they differ substantially in market structures, liquidity, and funding mechanisms. As a result, financing conditions in PC and LL markets may diverge significantly. When conditions diverge, we document that larger middle-market firms are better able to substitute between these two markets, shifting to PC when LL conditions tighten and moving back when LL conditions become more accommodative.3 Smaller firms have less capacity to substitute and therefore may be more exposed to a deterioration in PC financing conditions.
These findings suggest that if the recent deterioration in investor confidence remains confined to the PC market, larger middle-market firms with access to the LL market may be less affected than smaller firms by further tightening in PC financing conditions. Because larger and smaller firms each account for about half of PC loan volume, substitution to the LL market could mitigate, but not eliminate, the broader effects of a PC pullback.
Market Size, Lender Composition, and Market Structure
PC and LL markets are roughly equal in size—approximately $1.4 trillion as of the end of 2025—and together account for around 45 percent of total lending to private nonfinancial corporations (Figure 1).4 Both PC and LL markets have grown considerably since the Global Financial Crisis (GFC), with PC experiencing particularly rapid expansion in recent years, reflecting demand for bespoke financing terms by borrowers, the increased role of private equity, and post-GFC regulatory and supervisory changes (Aramonte and Avalos, 2021; Degerli and Monin, 2024; Chernenko et al., 2025). This expansion has made PC an increasingly important part of the broader corporate credit landscape for risky middle-market firms, alongside the LL market.
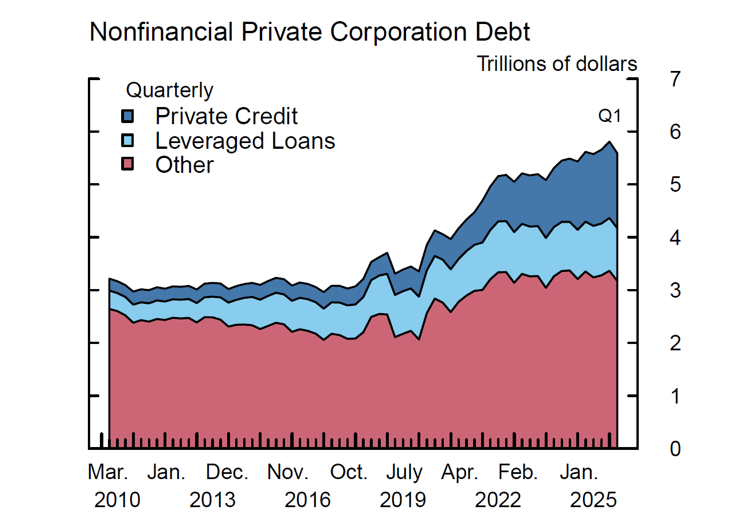
Note: Other debt includes categories such as bank loans, mortgages, finance company loans, and foreign loans. It does not include operating leases. Private credit includes private debt fund data through 2025 Q3, interval fund data through 2025 Q4, and BDC and middle-market CLO data through 2026 Q1. The figure excludes leveraged loans to public firms. The key identifies bars in order from top to bottom.
Source: Financial Accounts of the United States; Compustat North America; PitchBook Data, Inc.; S&P; BDC Collateral; Moody’s Analytics, Inc.; Preqin, Ltd.; N-PORT; staff estimates.
PC and LL markets differ in the composition of lenders and in how credit is funded, originated, and distributed. In the PC market, financing is provided by private debt funds and BDCs, which together account for about 90 percent of the entire market, as well as interval funds and middle-market CLOs (Figure 2). The ultimate capital providers to private debt funds and middle-market CLOs are institutional investors, while BDCs and interval funds are also accessible to retail, high-net-worth, and accredited investors. PC lenders typically originate and hold loans directly, often lending bilaterally or as part of a small group of lenders to borrowers and private equity sponsors. Because loans are privately negotiated and held by a relatively small group of lenders, PC lenders can offer customized terms, faster origination, and greater flexibility in renegotiation.
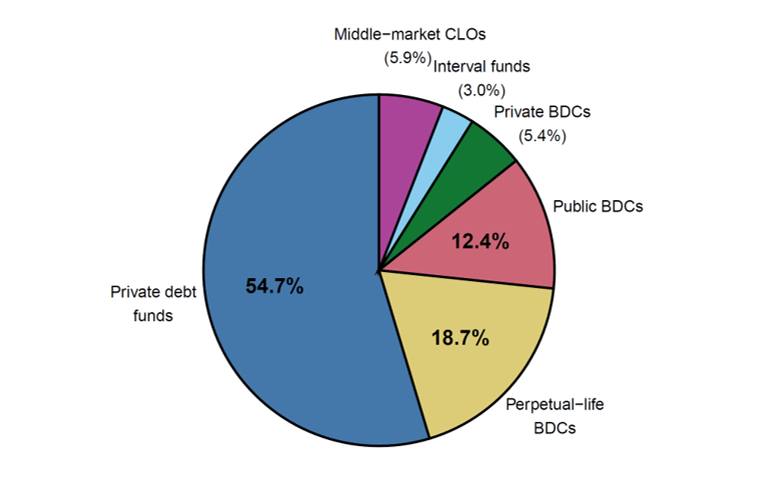
Note: Data as of Q3 2025. Percentages reflect unrealized value for private debt funds, loan assets for interval funds and assets under management for other lenders.
Source: Preqin, Ltd.; Moody’s Analytics, Inc.; BDC Collateral; N-PORT.
In the LL market, loans are typically originated by large commercial and investment banks and distributed to a broad set of institutional investors, including broadly syndicated loan CLOs, loan mutual funds, exchange-traded funds, insurance companies, and other asset managers (Figure 3). Ultimate investors in these vehicles are largely institutional, especially through CLOs, while limited retail investor participation exists through loan mutual funds and ETFs. The LL market is more standardized and more liquid than private credit, with loan terms often shaped by investor demand in syndicated markets. Borrowers in the LL market typically benefit from lower borrowing costs than in the PC market, especially when institutional demand is strong.
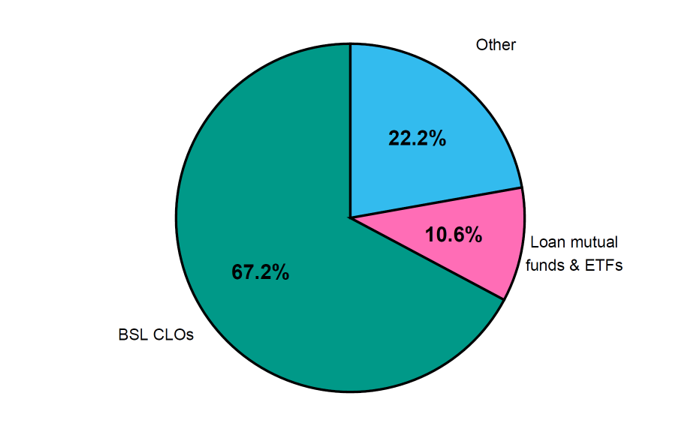
Note: Data as of Q1 2026. “Other” investors include, but are not limited to, finance/insurance companies, banks, hedge funds, and pensions.
Source: LSEG Data & Analytics; Bank of America Merrill Lynch Global Fund Manager Survey.
Banks have distinct roles in the two markets. In the PC market, banks do not originate loans directly, but instead provide financing to private credit vehicles. In the LL market, banks arrange, underwrite, and syndicate loans; they distribute large portions of term loans to institutional investors while retaining some portions of term loans on their balance sheets and providing revolving loans to firms.
The differences in lender composition and market structure can lead to diverging financing conditions across the PC and LL markets. In the LL market, conditions can tighten when arranging banks reduce underwriting activity or when institutional investor demand weakens. In the PC market, financing conditions depend on committed capital being available for lending, net capital flows into private debt funds, BDC equity issuance, and the availability of leverage from banks. The growing role of retail-oriented vehicles in PC may also make funding conditions in PC more sensitive to changes in investor sentiment and redemption pressure.
Borrower characteristics and growing overlap across PC and LL markets
PC and LL markets both serve highly leveraged, risky middle-market nonfinancial firms (Table 1). However, relative to LL borrowers, PC borrowers are smaller (with revenue typically below $250 million) and more leveraged (with a median debt-to-EBITDA ratio of 5x). PC borrowers mostly lack public credit ratings; however, as shown in Table 1, estimated credit ratings indicate that PC borrowers are more concentrated in lower rating buckets relative to LL borrowers.5 That said, the two markets have broadly similar industry composition, with technology and business services representing a somewhat larger share of issuance in the PC market than in the LL market. Both PC and LL markets provide medium-term floating-rate loans for similar purposes. LBO and M&A transactions account for a sizable portion of issuance in both markets (38 percent in LL and 32 percent in PC).6
Table 1: Borrower and Loan Attributes
| Metric | Leveraged Loans | Private Credit |
|---|---|---|
| Typical Market Structure | ||
| Originators | Banks | Nonbanks |
| Distribution Channel | Syndication | Bilateral or a few lenders |
| Funding Vehicles | BSL CLOs, Loan mutual funds, Insurance/Finance companies | Private debt funds, BDCs, Interval funds, MM CLOs |
| Ultimate Investors | Largely institutional, some retail through loan mutual funds & ETFs | Largely institutional, with increasing retail through BDCs and interval funds |
| Secondary Market | Yes | No |
| Valuation | Based on market pricing (daily) | Based on internal or third-party models (quarterly) |
| Borrower Attributes | ||
| Revenue ($M) | 902 | 223 |
|
Interquartile: |
[264 - 2,747] | [35 - 700] |
| Leverage (debt/EBITDA) | 3.2x | 5.0x |
| ICR (EBITDA/cash interest)* | 3.7x | 2.2x |
| Credit Rating/Estimate Shares (%) | ||
|
BB or Above |
28 | 0 |
|
Single B |
63 | 85 |
|
CCC or Below |
9 | 15 |
| Industry Shares (%) | ||
|
Technology |
14 | 16 |
|
Business Services |
13 | 17 |
|
Consumer Discretionary |
14 | 13 |
|
Healthcare |
12 | 13 |
|
Industrials |
12 | 12 |
| Loan Attributes | ||
| Loan Amount ($M) | 275 | 20 |
| Spread (bps) | 400 | 500 |
| Maturity (years) | 5 | 5 |
| Purpose Shares (%) | ||
|
LBO/M&A |
38 | 32 |
|
General Purpose/Refinance |
52 | 63 |
|
Dividend/Recap |
9 | 5 |
Note: All non-percent values are medians unless otherwise noted (* indicates average). Data reflects 2025 loan issuances unless otherwise noted. LL credit ratings shown as percent of par outstanding as of April 2026; most PC borrowers lack credit ratings, so displayed are PC credit estimates as percent of borrowers with estimates < 1 year old as of March 2026. Software borrowers may be grouped in industries of specialty rather than Technology. Spreads over SOFR.
Source: PitchBook Data, Inc.; KBRA Direct Lending Deals; S&P Global Market Intelligence; staff estimates.
As the PC market has grown over time, it has become increasingly able to accommodate larger borrowers that generally borrow in the LL market. As shown in Figure 4, although small firms represent the borrower base in the PC market, larger firms have tapped the PC market at an increasing rate in the years post-GFC, with the share of large firms borrowing in this market reaching a peak of 50 percent in 2022, before declining recently. This post-GFC trend suggests that PC's growth has been propelled by larger firms seeking bespoke, fast financing in the PC market as an alternative to traditional leveraged loans, rather than by small firms migrating from the LL to the PC market.
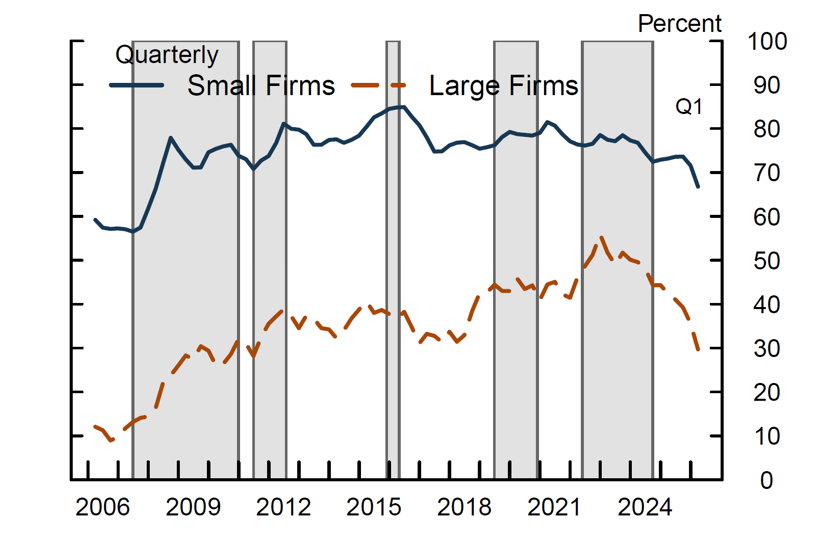
Note: We follow the approach of Hinzen et al. (2026) in measuring private credit market share but extend their analysis by separately examining large and small firms. Lines show the four-quarter rolling share of firms with new borrowing in PC among firms with new borrowing in either the PC or LL market, separately for large and small firms. Shaded areas indicate periods when financing conditions are tight in the LL market, as suggested by an excess loan premium—a measure of the risk premium demanded by leveraged loan investors—that is above its historical median: June 2007-December 2010, June 2011-July 2012, November 2015-April 2016, June 2019-November 2020, May 2022-September 2024.
Source: Pitchbook Data, Inc.
This migration has created significant overlap between the LL and PC borrower bases. The share of loans issued by borrowers with access to both markets has increased over time, intensifying the competition between LL and PC markets. Overall, among middle-market firms that have issued debt since 2020, roughly one-third have accessed only the LL market and roughly one-third have accessed both LL and PC markets (Figure 5). The remaining share of middle-market firms have accessed only the PC market.
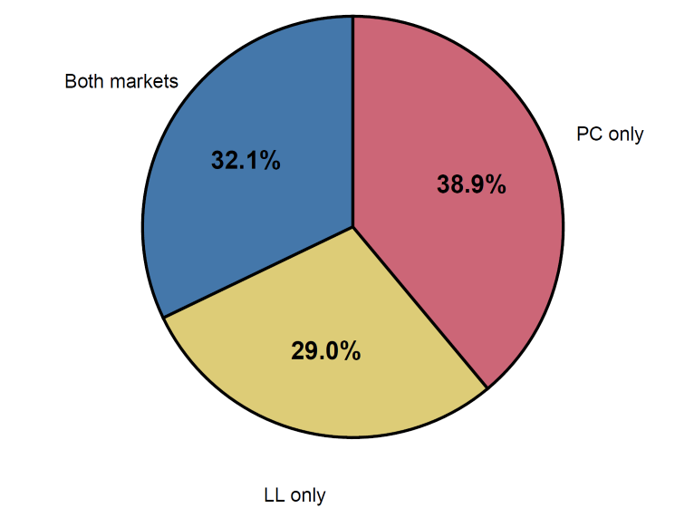
Note: Following Hinzen et al. (2026), we classify borrowers based on their borrowing history. A firm is classified as “PC only” or “LL only” at a date if the firm has exclusively borrowed from the private credit or the leveraged loan market up to that date, respectively. Once the firm switches from one market to the other, it is classified as “Both markets.” We simplify the five-category classification of Hinzen et al. (2026) by combining their "PC to LL," "LL to PC," and "Both Switch" categories into a single "Both markets" category. Only includes borrowers who have issued debt from the beginning of 2020 to the end of 2025.
Source: PitchBook Data, Inc.
Firms' access to PC and LL markets differs by firm size. Larger firms are able to access both markets, while smaller firms typically have access only to PC. As shown in Figure 6, about 41 percent of larger firms have accessed both markets, 43 percent are only present in the LL market, and 16 percent are only present in the PC market. Among small firms, only about 25 percent have accessed both markets, while 57 percent are exclusively PC borrowers (Figure 7).
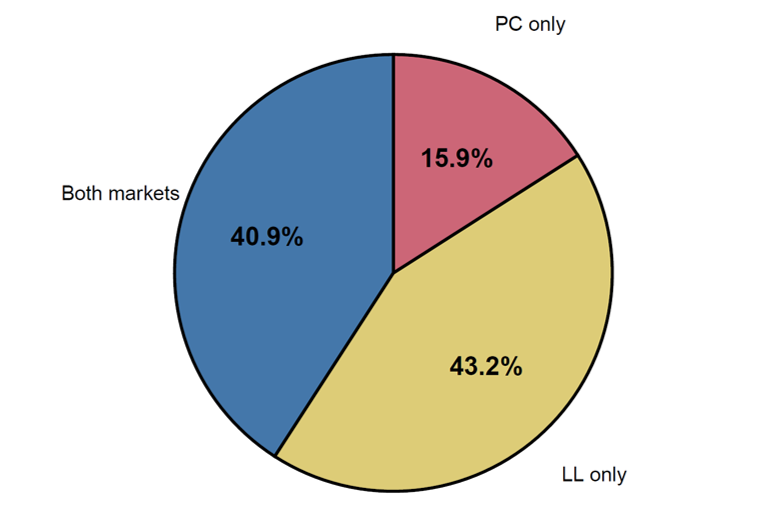
Note: Following Hinzen et al. (2026), we classify borrowers based on their borrowing history. A firm is classified as “PC only” or “LL only” at a date if the firm has exclusively borrowed from the private credit or the leveraged loan market up to that date, respectively. Once the firm switches from one market to the other, it is classified as “Both markets”. We simplify the five-category classification of Hinzen et al. (2026) by combining their "PC to LL," "LL to PC," and "Both Switch" categories into a single "Both markets" category. Only includes borrowers who have issued debt from the beginning of 2020 to the end of 2025.
Source: PitchBook Data, Inc.
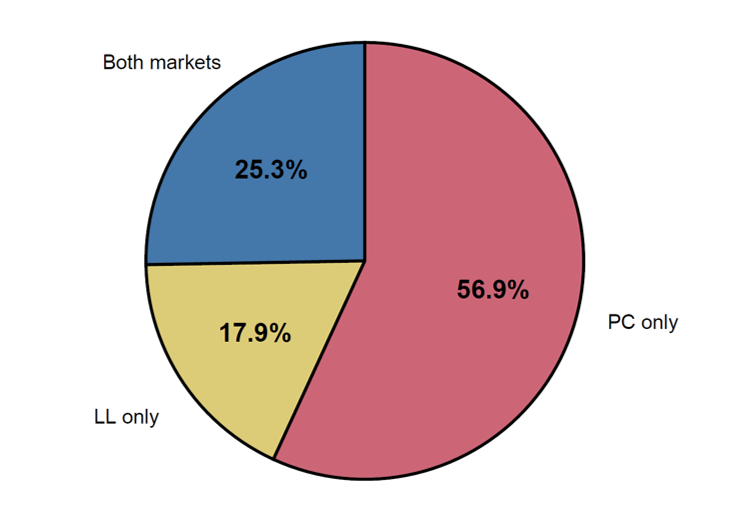
Note: Following Hinzen et al. (2026), we classify borrowers based on their borrowing history. A firm is classified as “PC only” or “LL only” at a date if the firm has exclusively borrowed from the private credit or the leveraged loan market up to that date, respectively. Once the firm switches from one market to the other, it is classified as “Both markets”. We simplify the five-category classification of Hinzen et al. (2026) by combining their "PC to LL," "LL to PC," and "Both Switch" categories into a single "Both markets" category. Only includes borrowers who have issued debt from the beginning of 2020 to the end of 2025.
Source: PitchBook Data, Inc.
Borrower substitution patterns
Motivated by recent discussion on substitution between PC and LL markets, we next examine the switching patterns in our sample of middle-market borrowers. Hinzen et al. (2026) show that firms are more likely to move from the LL to the PC market when syndicated loan market conditions tighten, suggesting that PC can act as a backstop during LL market stress. We build on their analysis to examine whether switching capacity differs by firm size and industry, which has implications for how a potential PC-specific pullback may affect different types of middle-market firms.
Firms with access to both PC and LL markets tend to substitute between them when borrowing conditions diverge. In particular, as shown in Figure 8, the share of firms switching from LL to PC (the blue line) increases during periods of restrictive financial conditions in the LL market. For example, the share of borrowers that moved from LL to PC, where credit is less dependent on banks and syndicated loan investor demand, reached about 50 percent (or roughly 25 percent of total PC issuance) in early 2023, at the peak of the recent monetary policy tightening cycle. Conversely, when LL conditions become relatively more accommodative, these firms moved back to the LL market (the dashed brown line) from the PC market where borrowing costs are typically higher.
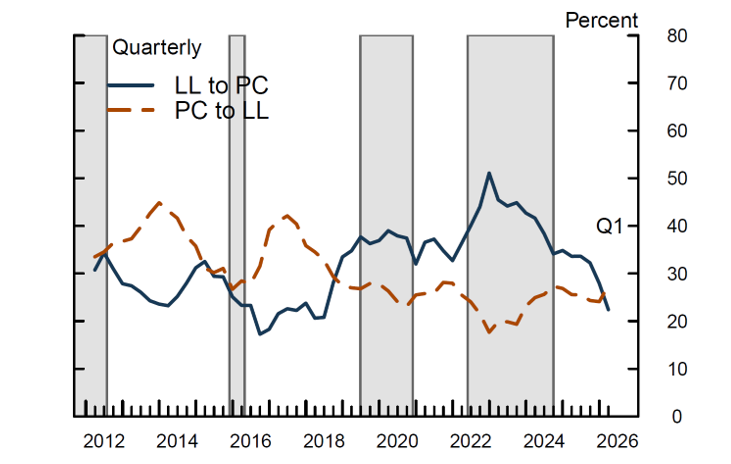
Note: Following the methodology of Hinzen et al. (2026), we measure switching by examining changes in borrowers' financing sources across consecutive loans. At each quarter, the sample includes firms with a new loan in the trailing 12 months. The blue line shows the share of firms whose prior loans were in the LL market and current loans are in the PC market; the brown line is defined analogously for PC-to-LL switchers. Our calculation differs from Hinzen et al. (2026) in the denominator: we use the number of firms with prior loans in the origin market, while they use the total number of issuers in that market. Shaded areas indicate periods when financing conditions are tight in the LL market, as suggested by an excess loan premium that is above its historical median: June 2011-July 2012, November 2015-April 2016, June 2019-November 2020, May 2022-September 2024.
Source: PitchBook Data, Inc.
As reported in Figures 9 and 10, substitution patterns differ by firm size. Larger firms switch across PC and LL markets while smaller firms are less likely to move from PC to LL. Although smaller firms can move from LL to PC, a relatively low share of smaller firms have access to the LL market in the first place. More recently, PC-to-LL switching has increased among larger firms as PC market conditions have become less accommodative, while such substitution has remained muted among smaller firms. This size-based segmentation has important implications for financing conditions; larger borrowers may be able to respond to tightening in one market by shifting to the other one, while smaller borrowers face limited alternatives during PC market tightening.
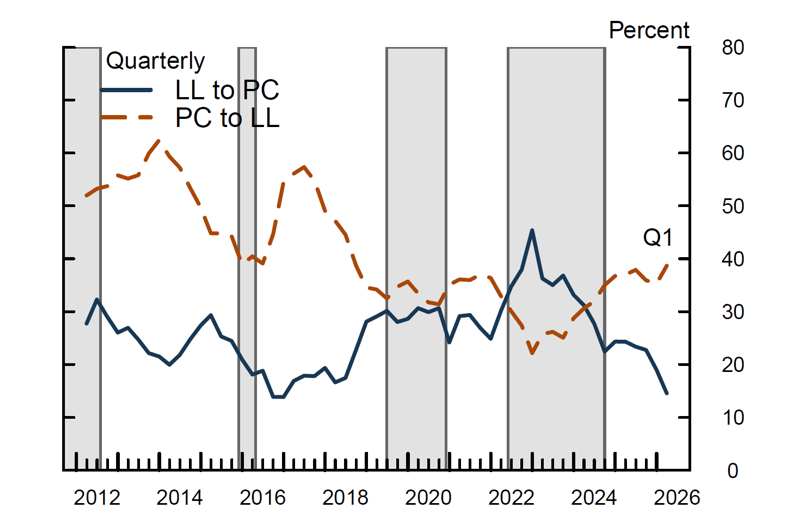
Note: Following the methodology of Hinzen et al. (2026), we measure switching by examining changes in borrowers' financing sources across consecutive loans. At each quarter, the sample includes firms with a new loan in the trailing 12 months. The blue line shows the share of firms whose prior loan was in the LL market and current loan is in the PC market; the brown line is defined analogously for PC-to-LL switchers. Our calculation differs from Hinzen et al. (2026) in the denominator: we use the number of firms with prior loans in the origin market, while they use the total number of issuers in that market. Shaded areas indicate periods when financing conditions are tight in the LL market, as suggested by an excess loan premium that is above its historical median: June 2011-July 2012, November 2015-April 2016, June 2019-November 2020, May 2022-September 2024.
Source: PitchBook Data, Inc.
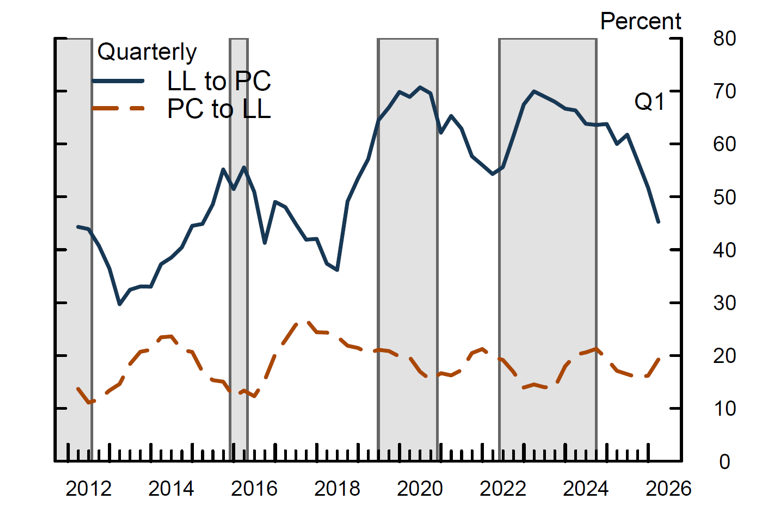
Note: Following the methodology of Hinzen et al. (2026), we measure switching by examining changes in borrowers' financing sources across consecutive loans. At each quarter, the sample includes firms with a new loan in the trailing 12 months. The blue line shows the share of firms whose prior loan was in the LL market and current loan is in the PC market; the brown line is defined analogously for PC-to-LL switchers. Our calculation differs from Hinzen et al. (2026) in the denominator: we use the number of firms with prior loans in the origin market, while they use the total number of issuers in that market. Shaded areas indicate periods when financing conditions are tight in the LL market, as suggested by an excess loan premium that is above its historical median: June 2011-July 2012, November 2015-April 2016, June 2019-November 2020, May 2022-September 2024.
Source: PitchBook Data, Inc.
Substitution patterns also differ across industries in ways that are consistent with the size-based segmentation documented above. The software industry is especially relevant as software firms account for a meaningful share of both markets—about 21 percent of PC issuance and 16 percent of LL issuance since 2020—and have been a focus of recent credit quality and valuation concerns. Although software firms in PC and LL markets are heterogeneous and include both large and small borrowers, they are smaller on average than non-software firms and therefore tend to rely more heavily on PC financing. About half of software borrowers have accessed only the PC market (Figure 11). This distribution suggests that a sizable share of software firms may have limited ability to shift away from the PC market if conditions tighten in that market. For software firms with access to both markets, LL-to-PC switching also tends to increase when LL conditions tighten (Figure 12). However, among these firms, PC-to-LL switching has remained relatively muted, especially in recent years, suggesting that the ability of software borrowers to move to the LL market may be more limited than other borrowers.
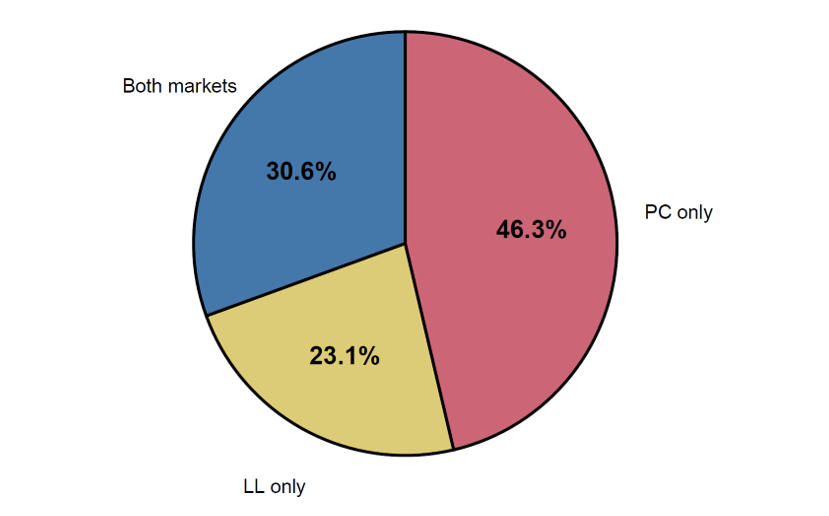
Note: Following Hinzen et al. (2026), we classify borrowers based on their borrowing history. A firm is classified as “PC only” or “LL only” at a date if the firm has exclusively borrowed from the private credit or the leveraged loan market up to that date, respectively. Once the firm switches from one market to the other, it is classified as “Both markets.” We simplify the five-category classification of Hinzen et al. (2026) by combining their "PC to LL," "LL to PC," and "Both Switch" categories into a single "Both markets" category. Only includes borrowers who have issued debt from the beginning of 2020 to the end of 2025.
Source: PitchBook Data, Inc.
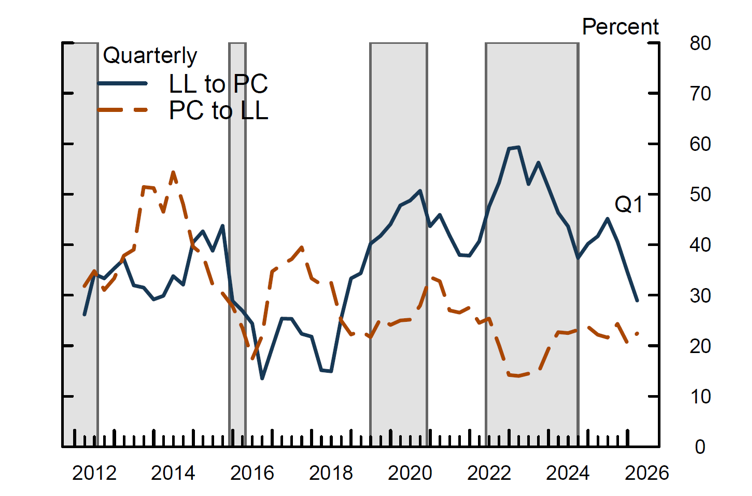
Note: Following the methodology of Hinzen et al. (2026), we measure switching by examining changes in borrowers' financing sources across consecutive loans. At each quarter, the sample includes firms with a new loan in the trailing 12 months. The blue line shows the share of firms whose prior loan was in the LL market and current loan is in the PC market; the brown line is defined analogously for PC-to-LL switchers. Our calculation differs from Hinzen et al. (2026) in the denominator: we use the number of firms with prior loans in the origin market, while they use the total number of issuers in that market. Shaded areas indicate periods when financing conditions are tight in the LL market, as suggested by an excess loan premium that is above its historical median: June 2011-July 2012, November 2015-April 2016, June 2019-November 2020, May 2022-September 2024.
Source: PitchBook Data, Inc.
Conclusion
PC and LL markets are distinct but have also become increasingly interconnected. The two markets differ with respect to their borrower and lender base, but also in terms of market structure, liquidity, and the role of banks. At the same time, both markets finance highly leveraged firms and serve an increasingly overlapping borrower base. As a result, the implications of tighter financing conditions in one market for broader financing conditions depend on firms that are able to substitute across the two markets. Smaller borrowers remain heavily dependent on PC and therefore face limited financing alternatives when conditions tighten, whereas larger borrowers, which can switch financing sources across PC and LL markets, are better able to adjust to relative changes in financing conditions across these two markets.
References
Aramonte, Sirio, and Fernando Avalos. 2021. "The Rise of Private Markets." BIS Quarterly Review, 69–82.
Chernenko, Sergey, and David S. Scharfstein. 2026. "Private Credit and Financial Stability." https://doi.org/10.2139/ssrn.5930356.
Degerli, Ahmet, and Phillip Monin. 2024. "Private Credit Growth and Monetary Policy Transmission." FEDS Notes. Board of Governors of the Federal Reserve System.
Hinzen, Franz J., Giorgio Mondini, Paul Rintamäki, and Sascha Steffen. 2026. "The Cyclicality of Direct Lending." https://doi.org/10.2139/ssrn.6490423.
1. The views expressed here are those of the authors and do not necessarily reflect to the views of the Board of Governors, the FOMC, or anyone else in the Federal Reserve System. Any errors or omissions are the responsibility of the authors. We are grateful to Burcu Duygan-Bump, Marco Cagetti, Giovanni Favara, Beth Klee, Patrick McCabe, Maria Perozek, Lubomir Petrasek, Gustavo Suarez and Min Wei for helpful comments and suggestions. We also thank Katie Brinkman, Tim Dore, Simon Glossner, Elizabeth Holmquist, Nam Nguyen, Chaehee Shin, and Irina Stefanescu for expertise and assistance with the private credit data. Return to text
2. Other sources of financing include smaller loans from banks, commercial mortgages, and corporate bond issuance for a small subset of middle-market firms with access to public debt markets. Return to text
3. In our analysis, firms with revenue above $250 million are classified as larger firms, and those below this cutoff as smaller firms. Return to text
4. The PC and LL markets together account for around 20 percent of total lending to nonfinancial corporations as of the first quarter of 2026. Return to text
5. Estimated credit ratings are rating agency assessments of unrated borrowers' credit quality based on available financial and loan-level information. They are used to approximate rating categories for borrowers without public credit ratings, but they may rely on more limited information than public ratings. Return to text
6. The remainder consists primarily of refinancing transactions, general corporate purpose loans, and dividend recapitalizations, that is debt-funded payouts to sponsors/equity holders. Return to text
Banegas, Ayelen, Sophia Castelo, Ahmet Degerli, Christine Dobridge, and Will Kennedy (2026). "Private Credit and Leveraged Loan Markets: Similarities, Differences, and Substitution," FEDS Notes. Washington: Board of Governors of the Federal Reserve System, August 11, 2026, https://doi.org/10.17016/2380-7172.4133.
Disclaimer: FEDS Notes are articles in which Board staff offer their own views and present analysis on a range of topics in economics and finance. These articles are shorter and less technically oriented than FEDS Working Papers and IFDP papers.