FEDS Notes
November 19, 2021
Quantifying Bottlenecks in Manufacturing
Charles Gilbert, Maria D. Tito, and Cynthia Doniger1
Shortages of key components and logistics problems have constrained factory output since the start of the year. Numerous anecdotes and survey measures have highlighted the emergence of supply chain bottlenecks and other supply constraints; to complement those qualitative characterizations, this note proposes a novel methodology to quantify bottlenecks in the manufacturing sector.2
Our quantification leverages the relationship of unfilled orders and inventories relative to shipments. In normal times, unfilled orders and inventories each tend to exhibit a constant long-term relationship relative to shipments. Additional orders have typically translated into shipments within 2-to-5 months, and an inventory drawdown associated with a rise in demand has boosted output in the following 1-to-2 months as manufacturers restock depleted warehouses. In the presence of production constraints, however, output may fall short of demand, causing unfilled orders to climb and inventory stocks to be drained. The deviations of unfilled orders and inventories from their long-term relationships with shipments are the basis for our quantification of bottleneck effects across industries in manufacturing.
Unfilled orders, inventories, and shipments data are available from the Census Bureau's Survey of Manufacturers' Shipments, Inventories, and Orders (M3), a monthly survey that measures economic conditions in the manufacturing sector. Our methodology analyzes each three-digit NAICS sector $$s$$ in month $$t$$ and follows two steps.3 First, we construct counterfactual projections of unfilled orders, $${UO}_{st}$$, and inventories, $$I_{st}$$: we rely on their average historic ratios to shipments through December 2020, a period prior to the emergence of supply-chain pressures, and extrapolate the levels of unfilled orders and inventories had they evolved in a way that maintained their historic proportion to shipments since January 2021.4 Second, we assume that the deviation of observed unfilled orders and inventories from their counterfactual projections would have been realized as output had there been no bottlenecks. Consequently, those deviations measure lost output, $${Lost\ Q}_{st}$$, and the difference between the rate of growth in hypothetical shipments—that is, shipments boosted by lost output, $$\widetilde{Sh}_{st}$$ —and measured shipments, $${Sh}_{st}$$, characterize the impact of supply chain bottlenecks on production. Specifically, bottleneck effects can be described as follows
$$$$ {Bottleneck\ Effect}_{st} = \frac{\widetilde{Sh}_{st} - \widetilde{Sh}_{s,t-1}}{\widetilde{Sh}_{s,t-1}} - \frac{{Sh}_{st}-{Sh}_{s,t-1}}{{Sh}_{s,t-1}} $$$$
where
- $$ \widetilde{Sh}_{st} = {Sh}_{st} + {Lost\ Q}_{st} $$ denotes hypothetical shipments,
- $$ {Lost\ Q}_{st} = ( {UO}_{st} - \widehat{UO}_{st} ) - (I_{st} - \hat{I}_{st}) $$ defines lost output, and
- $$ \hat{x}_{st} = \frac{x_{s,2020m12}}{{Sh}_{s,2020m12}} \cdot {Sh}_{st},x = \{{UO},I\} $$ characterizes the counterfactual projections for unfilled orders and shipments.
Three main reasons explain why our estimates could be interpreted as a lower bound. First, inventories cannot drop below zero. Second, firms tend to close order books if orders can no longer be filled within a reasonable time. Third, companies may raise prices when demand exceeds what they can supply and thus dampen some of the demand.
Figure 1 illustrates an application of our calibration exercise to the fabricated metal products industry (NAICS 332).5 The solid red and blue lines show unfilled orders and inventories, respectively. The dashed lines display the counterfactual projections of unfilled orders and inventories based on their average historical ratio to shipments through December 2020. The divergences between unfilled orders, inventories, and the counterfactual projections combine to form our estimate of lost output due to bottleneck effects. In the case of fabricated metal products, while inventories have remained quite close to a projection based on their historical ratio to shipments, unfilled orders have jumped well above what shipments would have suggested.
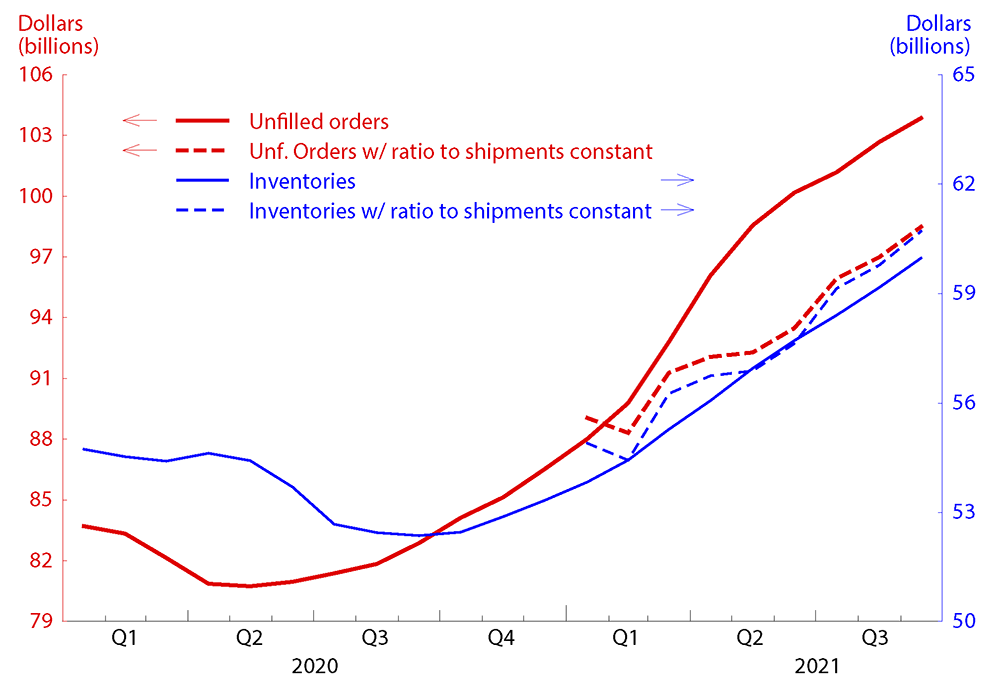
Note: Constant ratios of unfilled orders and inventories to shipments set as the December 2020 7-month Henderson moving average.
Source: Census Bureau's Survey of Manufacturers' Shipments, Inventories, and Orders (M3)
Table 1 summarizes the contribution of unfilled orders and inventories to lost output for each three-digit sector outside of transportation equipment.6 The contributions are expressed in terms of days of lost output related to an increase in unfilled orders (column 3) or a decline in inventories (column 4) above and beyond the counterfactual projections. Because of high month-to-month volatility, we look at the average number of days of lost output over the May-through-September 2021 period. Most industries have seen their inventories drawn down relative to shipments, with leather and allied products reporting the largest number of days of lost output associated with movements in inventories. For the durable goods industries with data on unfilled orders, the contribution to lost output of an increase in unfilled orders have complemented movements in inventories, with 6.6 days of lost output in the furniture industry due to the rise in orders alone. Column (5) reports total lost output from excess unfilled orders and depleted inventories.
For some industries, our measures of lost output have negative values as there may be many reasons behind the trends in unfilled orders and inventories relative to shipments other than the presence of supply constraints. However, in constructing an aggregate estimate for overall manufacturing, we assume that other factors tend to offset each other and that our measure mainly captures supply bottlenecks.7 Our aggregate estimate for manufacturing excluding transportation equipment points to a total of 2.5 days of lost output in the average month since December 2020.
Table 1. Supply Chain Bottlenecks’ Effects across Three-Digit Manufacturing Industries
| (1) | (2) | (3) | (4) | (5) | (6) | (7) |
|---|---|---|---|---|---|---|
| Industry | NAICS | Lost Output from1 | Total Lost Output3 (days) | Insufficient Orders4 | Insufficient Materials5 | |
| Excess Unfilled Orders2 (days) | Depleted Inventories (days) | |||||
| Food | 311 | n.a. | 0.6 | 0.6 | -7.3 | 11.5 |
| Beverage and tobacco products | 312 | n.a. | 3.6 | 3.6 | -13.7 | 19.1 |
| Textile mills | 313 | n.a. | 0.1 | 0.1 | -8.7 | n.a. |
| Textile product mills | 314 | n.a. | 2.2 | 2.2 | -15.7 | 29.9 |
| Apparel | 315 | n.a. | 0.0 | 0.0 | -28.2 | n.a. |
| Leather and allied products | 316 | n.a. | 8.2 | 8.2 | n.a. | n.a. |
| Wood products | 321 | n.a. | 1.8 | 1.8 | -27.2 | 32.5 |
| Paper | 322 | n.a. | 0.3 | 0.3 | -28.2 | 26.7 |
| Printing and related support activities | 323 | n.a. | -0.1 | -0.1 | -4.7 | n.a. |
| Petroleum and coal products | 324 | n.a. | 0.1 | 0.1 | 27.6 | 28.0 |
| Chemical | 325 | n.a. | 1.3 | 1.3 | -21.8 | 27.5 |
| Plastics and rubber products | 326 | n.a. | -0.7 | -0.7 | -29.5 | 28.6 |
| Nonmetallic mineral products | 327 | n.a. | -0.6 | -0.6 | 9.7 | 18.6 |
| Primary metal | 331 | -1.2 | 2.5 | 1.3 | -34.0 | 9.9 |
| Fabricated metal products | 332 | 5.1 | 0.3 | 5.4 | -18.4 | 26.0 |
| Machinery | 333 | 0.3 | 3.1 | 3.4 | -9.1 | 40.2 |
| Computer and electronic products | 334 | -0.4 | 0.7 | 0.3 | -16.4 | 14.0 |
| Electrical equipment and appliances | 335 | 1.1 | 3.1 | 4.2 | -20.5 | 24.6 |
| Furniture and related products | 337 | 6.6 | -2.5 | 4.1 | -20.5 | 42.0 |
| Miscellaneous | 339 | 0.2 | -1.4 | -1.2 | -16.0 | 40.2 |
| Manufacturing ex. MV&P | 31-33@336 | 1.5 | 0.9 | 2.5 | -14.5 | 24.5 |
1. Lost output relative to average order books and inventory stocks in May-September 2021 less December 2020-based targets in units of days’ shipments.
2. Unfilled orders are not available for nondurable goods industries and some durable goods industries.
3. Lost output from excess unfilled orders and depleted inventories, sum of columns (3) and (4).
4. Change in the share of firms reporting insufficient orders between 2021q2 and 2019q4.
5. Change in the share of firms reporting insufficient materials between 2021q2 and 2019q4.
Sources. Underlying data: U.S. Census Bureau, Bureau of Labor Statistics; Calculations: FRB.
Survey measures of demand are consistent with our interpretation of the movements in unfilled orders and inventories as capturing lost output. Column 6 reports the change between 2021q2 and 2019q4 in the share of firms citing insufficient orders, a measure of demand conditions, among factors restraining production from the Quarterly Survey of Plant Capacity Utilization (QSPC).8 As unfilled orders rose and inventories declined, the share of firms reporting insufficient orders also dropped, suggesting that demand for goods has significantly picked up.
The patterns in our sector-level measures of lost output based on unfilled orders and inventories roughly match developments in other indicators of supply chain bottlenecks at the sector level, such as reports of materials' shortages.9 Column 7 shows the change between 2019q4 and 2021q2 in the share of firms that pointed to insufficient materials among factors restraining production. The share of firms selecting shortages of materials jumped since 2019q4, increasing up to 42 percent within the furniture industry. Beyond the similarity in the trends, the measure of materials' shortages is also positively correlated with our indicator with a correlation coefficient of 0.2.
Aggregating our sector-level bottleneck effects, we estimate that supply chain bottlenecks held down production growth, on average, 0.2 percentage point per month over the first half of 2021. Looking at 3-month moving averages to smooth across month-to-month volatility (figure 2), our estimates point to a deterioration in the effect of supply constraints through May 2021 before showing some signs of improvement starting in June. Even so, growth in the manufacturing sector in September was about 0.6 percentage point below what it would have been in the absence of any constraints.
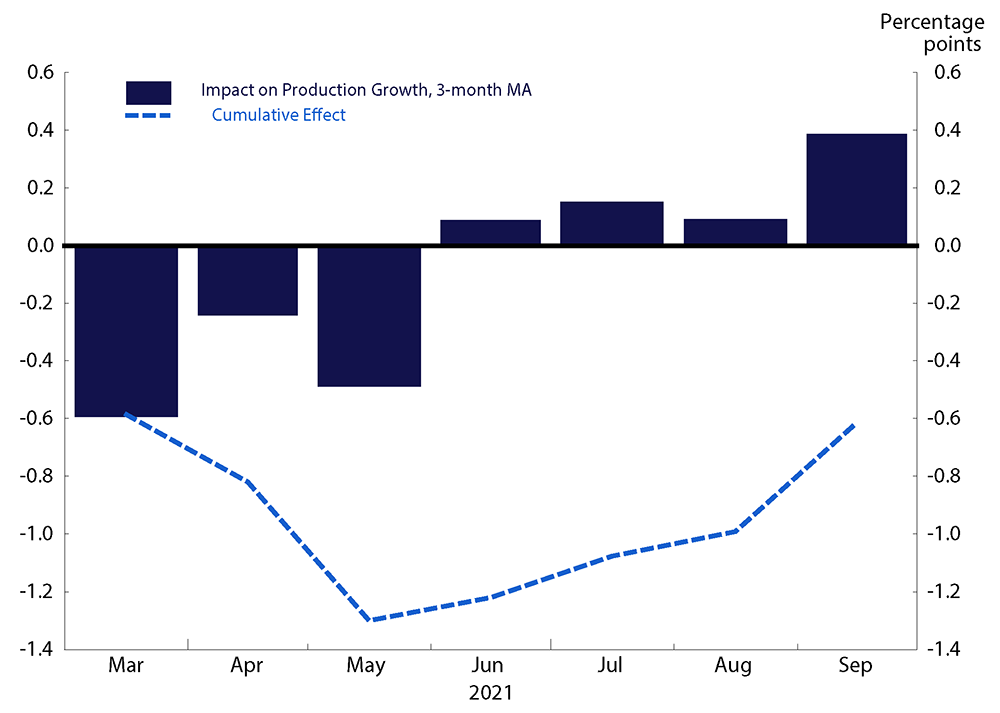
Note: Blue bars represent 3-month moving averages of our estimated bottlenecks' effects on production growth; light blue dashed line represents the cumulative effect.
Source: Census Bureau's M3 Data
References
U.S. Census Bureau (2021). Quarterly Survey of Plant Capacity Utilization, available at https://www.census.gov/programs-surveys/qpc.html
U.S. Census Bureau (2021). Survey of Manufacturers' Shipments, Inventories, and Orders, available at https://www.census.gov/manufacturing/m3/index.html
1. The views expressed in the article are those of the author and do not necessarily reflect those of the Federal Reserve System. We would like to thank Kim Bayard, Tomaz Cajner, Aaron Flaaen, Chris Kurz, and Stacey Tevlin for their insightful feedback. Return to text
2. For example, survey measures from the Institute for Supply Management (ISM) and IHS Markit point to record-long lead times, widespread shortages of critical basic materials, rising commodities prices, and difficulties in transporting products across industries. Return to text
3. We exclude transportation equipment (NAICS 336) because that industry features some firms with very large order books. Return to text
4. The average historic ratios of unfilled orders and inventories to shipments are constructed as 7-month Henderson-moving averages for the period prior to the emergence of the bottlenecks. Return to text
5. Fabricated metal products (NAICS 332) covers the production of nuts, bolts, screws, metal cans, etc. Return to text
6. As unfilled orders are available only for durable sectors, estimates of supply chain bottlenecks for nondurable industries rely on inventories and their counterfactual projections and assume that unfilled orders have continued to move in proportion with shipments. Return to text
7. Aggregates for overall manufacturing are weighted by industrial production relative importance weights. Return to text
8. For the QSPC measures, we rely on data relative to 2019q4, rather than 2020q4, because of the impact of the pandemic recession. Alternatively, our results are robust to constructing measures of lost output relative to December 2019. Return to text
9. In other analysis, we have also compared our measures with data on acceleration in producer price indexes' growth. We find that movement in prices are slightly negatively correlated to our measure of lost output. This result, however, may be driven by our small sample size. Return to text
Gilbert, Charles, Maria Tito, and Cynthia Doniger (2021). "Quantifying Bottlenecks in Manufacturing ," FEDS Notes. Washington: Board of Governors of the Federal Reserve System, November 19, 2021, https://doi.org/10.17016/2380-7172.3022.
Disclaimer: FEDS Notes are articles in which Board staff offer their own views and present analysis on a range of topics in economics and finance. These articles are shorter and less technically oriented than FEDS Working Papers and IFDP papers.