FEDS Notes
August 01, 2025
Racing Against Tariffs: Global Impacts of Frontloading
François de Soyres, Nils Goernemann, and Chris Machol1
In the first quarter of 2025, exports to the United States surged for many economies as firms frontloaded shipments ahead of expected tariff increases. This frontloading led to a sharp rise in overall net exports (NX) in several foreign countries, accounting for a large share of quarterly GDP growth—sometimes exceeding 100 percent of total growth—as domestic absorption contracted. Given that the underlying trade flows largely reflect timing shifts rather than lasting demand, the resulting boost to headline growth could, therefore, be misleading and mask underlying domestic weakness. As the temporary boost from trade fades, subdued domestic demand may become more visible. If frontloading unwinds and net exports turn negative, several economies could even see quarterly contractions later this year.
In this note, we examine the international consequences of this episode using national accounts data. First, we document the rise in goods exports to the U.S. from several countries in early 2025 and show how it affected GDP growth through the NX channel in selected economies. Second, we examine how net exports typically move in relation to other components of GDP, based on historical data. Finally, we assess whether the strength in net exports in the first quarter was offset by weakness in domestic demand, and what this pattern may suggest for the quarters ahead.
1. Surge in Exports to the U.S. and Its Contribution to GDP
In the first few months of 2025, exports to the United States from many economies rose sharply, driven by a frontloading of shipments ahead of expected tariff increases. This shift was particularly concentrated in March, when U.S. import volumes from several major trading partners spiked, likely in expectations of the pre-announced date of April 2 of new tariffs to come. The surge was especially pronounced for the euro area and Taiwan (left panel of Figure 1).2,3
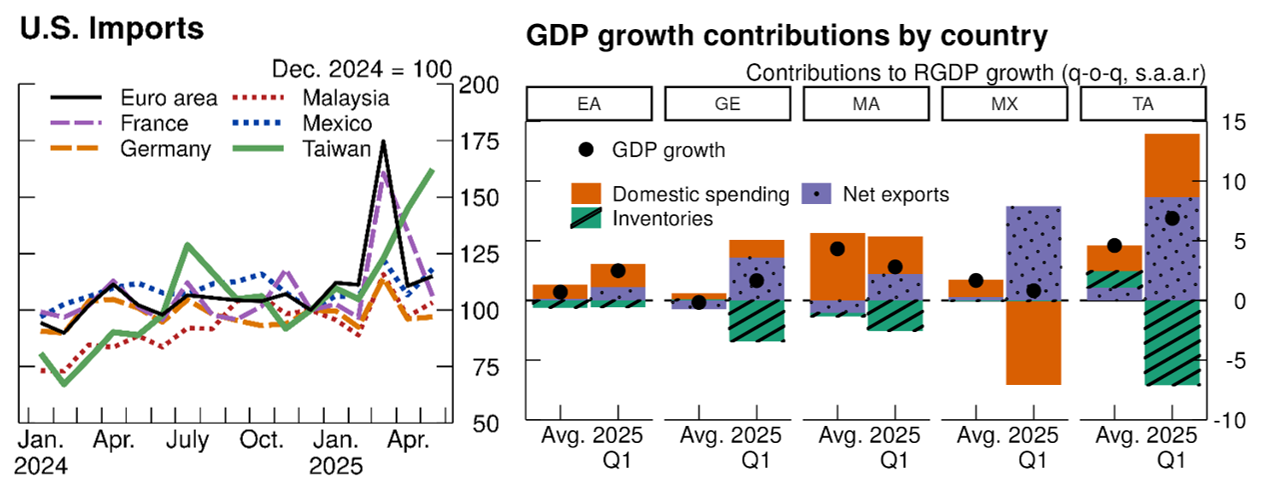
Note: Underlying U.S. imports series are raw data in thousands of USD and extend through May 2025. Underlying GDP growth contributions data are seasonally adjusted. Growth rates and contributions to growth rates are in Q/Q at an annual rate. In the right chart, economies shown are the euro area, Germany, Malaysia, Mexico, and Taiwan. The left bar for each country reflects the average of 2023 through 2024.
Source: National sources via Haver Analytics, FRB staff calculations.
These trade dynamics had notable effects on national accounts. The right panel of Figure 1 shows the accounting decomposition of real GDP growth for selected countries into contributions from net exports, inventory changes, and final domestic spending.4 Final domestic spending is defined here as the residual component of GDP excluding net exports and inventory accumulation—that is, the combined contribution of private consumption, government consumption, and investment net of inventory changes. For each country, the left bar represents the average contribution over 2023–24, while the right bar reflects outcomes in the first quarter of 2025. In all five economies, net exports made a significantly larger and more positive contribution to growth in the first quarter of 2025 than in the preceding two years. The swing was especially pronounced in Taiwan, where net exports added almost 10 percentage points to real GDP growth.
Inventory dynamics varied significantly across countries. In Germany and Taiwan, strong export gains were partly offset by steep inventory drawdowns—but not fully, leaving GDP growth notably above its historical average in both cases. Mexico, by contrast, saw a sharp decline in final domestic spending, while Malaysia recorded more balanced growth, with modest positive contributions from both net exports and final domestic demand. In the euro area as a whole, the composition was less even: the contribution from net exports exceeded 1 percentage point in 2025Q1—well above its typical contribution of around one-tenth—while final domestic spending remained broadly stable, and inventories had only a limited aggregate impact.5
Overall, looking across a broader set of countries (not just those shown in the chart) final domestic spending in early 2025 was often weaker than its historical average, reinforcing the view that the strong GDP readings in the first quarter were largely driven by trade timing effects rather than a broad-based recovery in underlying demand. The two panels together highlight how a temporary shift in trade flows can boost exports and create the appearance of robust external demand, even if the underlying conditions have not changed. In many cases, this mechanical lift from net exports accounted for a large share of overall GDP growth, effectively masking weak domestic momentum. We will return to this point in more detail in Section 3.
2. Historical response to rising exports
To better understand the macroeconomic implications of the export surge, it is useful to consider the basic accounting identity that decomposes GDP growth into three demand-side components:
GDP = Net Exports + Change in Inventories + Final Domestic Spending,
where Final Domestic Spending is the sum of private and government consumption and domestic investment excluding inventories. This identity makes clear that, holding everything else constant, a temporary increase in net exports directly raises measured GDP. However, to the extent that such movements reflect shifts in timing rather than changes in underlying demand, the growth accounting can distort the signal about domestic economic momentum—particularly if they coincide with weaker consumption or investment.
To assess the information content of an outsized net exports (NX) contribution, we examine how export surges typically co-move with other components of GDP. Specifically, we estimate a simple vector autoregression (VAR) model using the real GDP growth contributions of final domestic demand, inventory accumulation, and net exports, along with real export growth, for a subset of countries in our sample.6 The first three variables sum to total GDP growth. The estimation uses quarterly data from 2000Q1 to 2024Q4, excluding the COVID-19 period and the height of the global financial crisis—although results are robust to their inclusion. We then compute Generalized Impulse Response Functions (GIRFs) to an unexpected increase in export growth for each country.7 This dynamic approach allows us to move beyond static correlations and assess the typical macroeconomic footprint of an export surge.
Figure 2 summarizes the results. First, an increase in exports typically leads to a noticeable rise in NX, suggesting it is not fully offset by higher imports. Second, the associated inventory drawdown compensates for less than half of the rise in NX. Third, with the notable exception of Taiwan, final domestic demand generally holds steady during export surges. As a result, export increases often translate into genuine GDP gains rather than simply crowding out other components in the growth accounting.
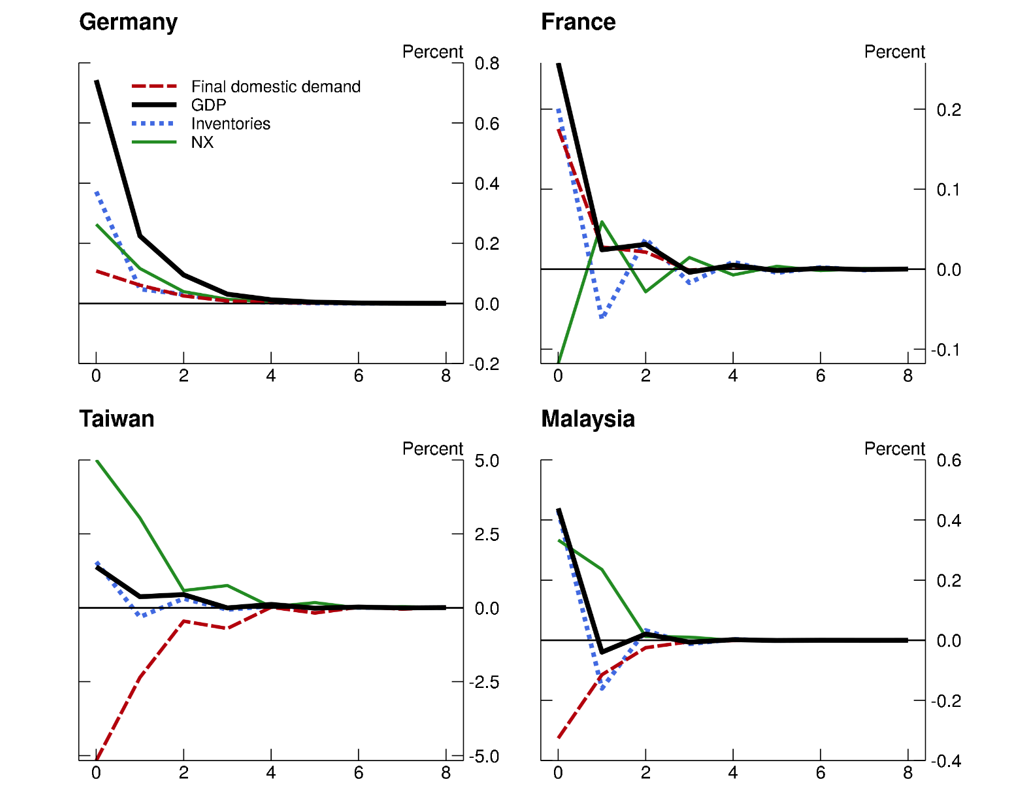
Note: Responses are for a one standard deviation increase in exports. In contributions to annualized quarterly GDP growth these increases are 2.8 percentage points for Germany, 2 percentage points for France, 8 percentage points for Taiwan, and 11.6 percentage points for Malaysia.
Source: FRB staff calculations.
That said, historical patterns also indicate that large NX contributions tend to reflect narrow export-driven gains, rather than broad-based strength across the economy. In other words, while export surges do not typically displace domestic activity, they also do not coincide with widespread acceleration in domestic demand. As such, strong net exports—like those observed in early 2025—can still mask underlying softness in domestic economic conditions. The next section explores whether this pattern held in the first quarter of 2025.
3. GDP components in the first quarter of 2025
Having concluded our VAR analysis, we now shift our focus back to 2025Q1 data to examine how the surge in net exports related to other components of GDP across countries. For each of the above component, we compute the "excess contribution" to GDP growth as the difference between the contribution in 2025Q1 and the average contribution over 2023-2024. This measure of "excess contribution" is as deviation from historical average and captures the specificity of the first quarter of 2025.
The left panel of Figure 3 plots the excess contribution of net exports to GDP growth against the excess contribution from inventories, using data from a broad set of countries. A clear negative relationship emerges: countries with stronger-than-usual NX contributions tended to see weaker-then-usual inventory accumulation. A simple regression suggests that a 1 percentage point (pp) increase in the NX contribution typically came with a 0.4 pp drop in the inventory contribution. This inverse relationship points to a form of adjustment in which frontloaded exports were at least partly met by drawing down inventories, rather than by ramping up production, qualitatively in line with some of the results from our VAR analysis.
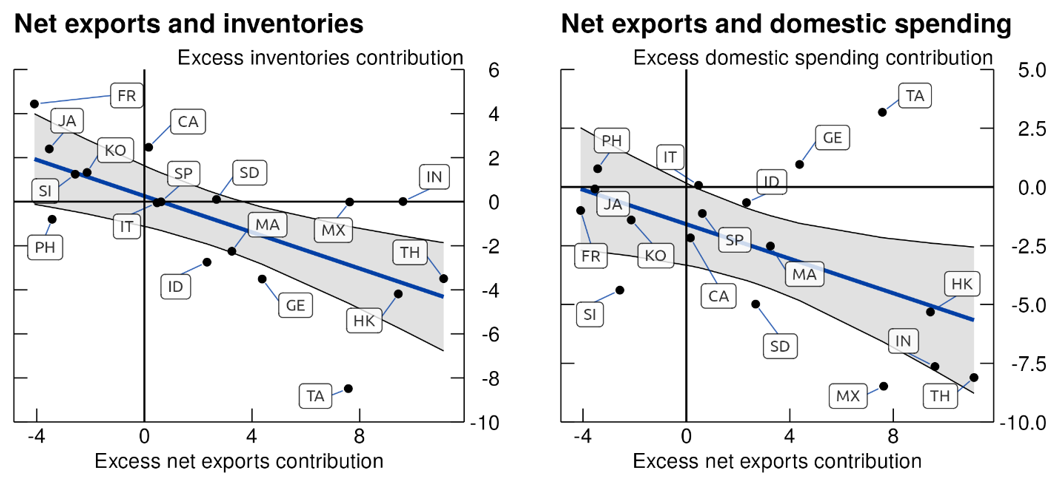
Note: All series are seasonally adjusted. Growth rates and contributions to growth rates are in Q/Q at an annual rate.
Source: National sources via Haver Analytics.
The right panel of Figure 3 replaces inventories with our measure of final domestic spending. Here too, the relationship is downward sloping, though the slope is less steep: countries with larger net export contributions in 2025Q1 generally saw somewhat weaker final domestic demand. Notably, the intercept of the relationship is also negative, suggesting that domestic spending growth was below average in most countries. While not necessarily causal, this pattern supports the view that strong GDP outcomes in early 2025 were driven largely by trade timing effects rather than broad-based economic strength—in line with our VAR based discussion above. As the temporary boost from trade fades, subdued domestic demand may become more visible. If frontloading unwinds and net exports turn negative, several economies could even see quarterly contractions later this year. As more data become available, monitoring the composition of GDP across economies will be key to distinguishing between temporary fluctuations and more persistent shifts in momentum.
Appendix
The chart below highlights U.S. imports from selected countries and sectors, revealing sharp divergences in the timing and magnitude of frontloading behavior ahead of anticipated trade measures. For example, U.S. imports of Canadian manufactured goods showed no signs of frontloading in the first quarter of 2025 and instead declined markedly starting in April. In contrast, imports of euro area chemicals and Taiwanese IT products surged well above trend in March – suggesting a deliberate acceleration of shipments. Interestingly, while imports of Euro area chemicals fell back sharply in April, largely reversing the earlier spike, Taiwanese IT imports continued to climb further.
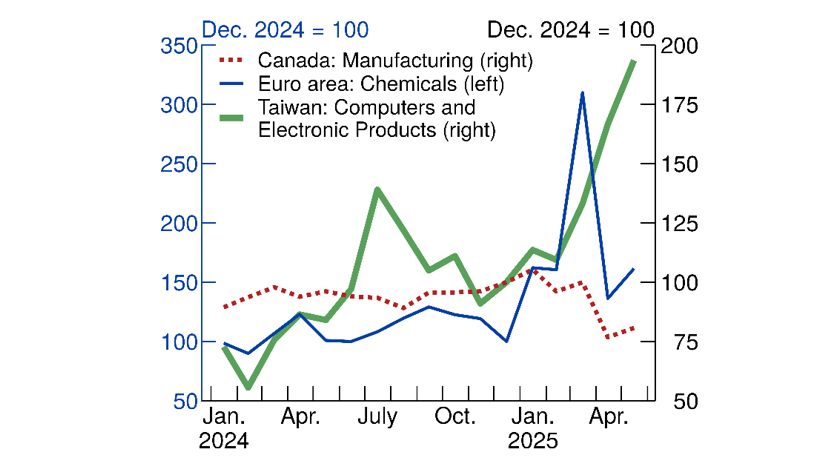
Source: Haver Analytics
Overall, the extent and timing of frontloading appears to depend on a combination of factors, including the specifics of tariff announcements, the degree of supply chain integration, and the practical ability of firms to build up inventories on U.S. soil.
1. François de Soyres ([email protected]), Nils Goernemann ([email protected]), and Chris Machol ([email protected]) are with the Board of Governors of the Federal Reserve System. The views expressed in this note are our own, and do not represent the views of the Board of Governors of the Federal Reserve, nor any other person associated with the Federal Reserve System. Return to text
2. One notable exception is China, where exports to the U.S. dropped significantly since the beginning of the year, reflecting both the direct impact of tariffs and a broader reorientation of trade flows away from the U.S. market. That said, we note that total exports from China held steady as exports have likely been re-directed towards other Asian countries. Return to text
3. In Canada, a spike in exports had occurred, but earlier in the year, with exports peaking in January and easing thereafter. Return to text
4. Seasonal adjustment is applied to each GDP component's level, not directly to their contributions. This ensures contributions, calculated from adjusted levels, sum to total GDP growth and reflect true component behavior. Adjusting contributions directly can cause distortions, as they depend on both the component's dynamics and its share of GDP relative to others. Return to text
5. This euro area-wide pattern somewhat masks large country-level fluctuations, particularly in Ireland, where GDP surged amid a spike in exports to the United States in March, largely driven by the pharmaceutical sector. Ireland's contribution to euro area GDP growth in 2025Q1 should be interpreted with caution, as the country's output data are highly volatile and heavily influenced by the operations of multinational firms. The surge in net exports was only partially offset by an inventory drawdown, leading to an unusually large GDP gain in the quarter. Return to text
6. To simplify the presentation, we focus on a subset of countries in this note. However, the key findings appear robust in a broader sample. For instance, we also estimated the VAR for Ireland and obtained qualitatively similar—albeit noisier—results, which is consistent with the well-known volatility in Irish data. Return to text
7. Roughly, the GIRFs in our setting is the change in the conditional expectation for the variables in the VAR in period 0 and the following periods, if we are told that exports are one standard deviation higher in period 0 than previously expected. The GIRFs should, therefore, be viewed as a reduced form expected path given this information, not as an identified structural shock. See H. Pesaran and Y. Shin: "Generalized impulse response analysis in linear multivariate models." Economics letters 58, no. 1 (1998): 17-29. Return to text
de Soyres, François, Nils Goernemann, and Chris Machol (2025). "Racing Against Tariffs: Global Impacts of Frontloading," FEDS Notes. Washington: Board of Governors of the Federal Reserve System, August 1, 2025, https://doi.org/10.17016/2380-7172.3851.
Disclaimer: FEDS Notes are articles in which Board staff offer their own views and present analysis on a range of topics in economics and finance. These articles are shorter and less technically oriented than FEDS Working Papers and IFDP papers.