FEDS Notes
August 12, 2020
The Cost Structure of Consumer Finance Companies and Its Implications for Interest Rates: Evidence from the Federal Reserve Board's 2015 Survey of Finance Companies
Lisa Chen and Gregory Elliehausen
Interest includes compensation not only for forbearance (forgoing current income for future income) and risk bearing but also compensation for expenses incurred to originate, service, and collect loans. The latter expenses are largely fixed, not varying much with the amount of credit. They arise because an application is received or a loan is made. With fixed costs being large relative to loan amount, smaller loans require higher interest rates than larger loans.1 This consideration looms especially important in consumer lending, where loan amounts often are quite small.
The Consumer Credit Protection Act of 1968 established the National Commission on Consumer Finance (NCCF) to study consumer credit markets and recommend improvements in consumer credit regulations. Among the commission's studies was an analysis of the cost factors involved in determining interest rates and their implications for interest rate ceilings. The commission focused especially on consumer finance companies, which primarily provide cash loans to consumers. These companies often extend small amounts of credit to riskier consumers who might have difficulty obtaining credit elsewhere. The commission found that break-even interest rates for credit from consumer finance companies were quite high at small loan amounts because of the great relative weight of fixed operating costs. Break-even rates decline steeply as loan amounts increase and eventually level off at larger loan amounts, as operating costs are spread across ever larger loan amounts. As a consequence, the commission concluded: "When rate ceilings are below the levels indicated [by the estimated break-even rates], staff studies show that [consumer] finance companies can stay in business only by greater loan sizes, limiting their risk acceptance to more affluent consumers, and maintaining large volume offices."2
Consumer credit markets have changed considerably since the NCCF report was published. Advances in information and communication technology create additional channels for account acquisition, permit automation of application and payment processing, and provide tools for evaluating applicants and customers (credit bureau reports and credit scores). Financial innovation has also altered the consumer credit market, most notably bank credit cards provide an alternative to closed-end instalment loans for small amounts of credit. Cost implications of consumer finance companies' responses to these developments are not known. This article reexamines the cost structure of the consumer finance company industry using data on income and expenses from the Federal Reserve Board's 2015 Survey of Finance Companies. In particular, this article examines the relationship of loan amount and break-even annual percentage rates and the implications of this relationship for rates and credit availability. Findings suggest that despite the many changes since 1972, the NCCFs conclusions are still valid today.
Background: Interest Rate Ceilings and Availability of Small Loans
Usury laws, which limit the rate of interest that lenders may charge, have a long history. Commonly justified as protecting necessitous borrowers from excessive interest rates, usury laws have often restricted availability of credit. Such laws inhibited but did not prevent the growth of consumer credit In the United States. While an exemption to usury laws allowed merchants' sales financing of customers' purchases, cash lenders largely could not operate profitably under usury laws. Nevertheless, an illegal small loan cash lending industry emerged in the late 19th century. Some small loan companies imposed exploitative terms and used abusive collection practices. Other small loan companies provided a useful, albeit expensive product. Collectively, these illegal small loan companies were called "loan sharks."
High rates of interest, sometimes abusive collection practices, and a perception that small-loan companies preyed on the poor gave rise to efforts to combat the "loan shark problem." Efforts included stricter enforcement, more stringent regulation, authorization of semi-philanthropic or cooperative lending institutions, and creation of products with repayment provisions that increased yield but were deemed to be in compliance with usury laws (notably Morris Plan loans). These efforts proved to be largely ineffective in curbing illegal cash lending.3
The Russell Sage Foundation played a central role in efforts to reform consumer lending early in the 20th century.4 The foundation first supported establishment of semi-philanthropic and cooperative lending institutions. It soon came to realize that demand for small loans was great, but semi-philanthropic and cooperative lending institutions could not attract sufficient capital to satisfy demand. Recognizing the relatively high cost of small loans, the foundation concluded that legal interest had to be high enough to allow investors to earn a competitive return on invested capital. This realization prompted the Russell Sage Foundation to play a leading role in the drafting of a model small loan law, which was completed in 1916. The model law allowed a higher interest rate (42 percent per annum) for small loan companies that choose to become licensed and accept state regulation of credit terms and practices. From these small loan companies, the consumer finance industry emerged.
Costs of Consumer Lending
Finance companies provide many types of financing to households and businesses, but companies typically specialize in the types of financing they provide. This note focuses on a particular type of finance companies, consumer finance companies. These companies generally concentrate heavily in a single product. That product is personal cash loans.5
The heavy single-product concentration of the consumer finance company industry makes this industry especially useful for studying the costs of consumer lending. They provide their financial service largely to one side of the market, the lending side. Funding is largely incidental to lending, at least in terms of operating costs. Arbitrary cost allocations among multiple types of products (savings and lending products) are unnecessary for analyzing costs of this specialized industry.6
Lending costs are commonly classified as operating costs and non-operating costs. Operating costs include wages and salaries, occupancy costs, advertising, administrative costs, and losses or additions to loss reserves. Non-operating costs include funding costs and income taxes.
Operating costs arise from a lengthy list of activities that a lender must undertake to grant credit, process payments, and collect delinquent payments or incur bad debt expenses. To originate loans, lenders must solicit customers, take applications, evaluate loan requests, and disperse funds. After origination, operating expenses are incurred to process a series of payments over the term of the loan and to maintain records of payments received. Some borrowers do not always make timely payments. Lenders must monitor loans for delinquent payments and contact delinquent borrowers to seek payment. Lenders may need to make frequent contacts to remind borrowers of overdue payments, negotiate a new schedule for repayment, or decide to turn over accounts for serious collection efforts (such as pursuing legal remedies). Some accounts with delinquencies may eventually pay in full. Processing such accounts can be quite costly. Other accounts are written off, resulting in loan losses.
As mentioned, advances in communication and information technology have altered the lending process. Credit reporting bureaus store vast amounts of comprehensive information on consumers' credit use and payment performance. This information may be used to identify consumers for preapproved solicitations. Statistical methods are used to analyze data in credit reports to produce predictions of future payment performance (credit scores). Credit applications can be taken over the Internet, and periodic payments may be processed electronically. Reminders of upcoming or late payments can be sent automatically.
Despite such advances, lender employees still perform many of the tasks of originating, processing, and collecting credit. Credit reporting bureaus do not provide all information pertinent to evaluating applications (notably, they do not collect information on applicants' income, and lenders may choose to verify applicants' reported income). Some consumers may have questions or prefer working with a loan officer. Lenders may want to work with customers to find a monthly payment that fits easily in customers' monthly budgets, especially when the customer is perceived as risky. Some customers may choose to make monthly payments by check, which involves processing by employees. In collecting overdue accounts, employees may need to make repeated efforts to contact to receive payment, negotiate a new schedule for repayment, or decide to turn an account over for more serious measures (such as legal actions).
Moreover, automated procedures require expenses for computers and other equipment, software, and specialized personnel for setting up and operating systems. All these items have a fixed component that is insensitive to the loan amount.
In contrast to operating expenses, non-operating expenses include significant variable components. Both the cost of borrowed funds and the cost of equity funds vary directly with the amount of credit. Larger amounts of credit entail higher funding expenses.
The existence of significant fixed costs in consumer lending suggests that holding the interest rate and other factors constant, smaller loans are less profitable than larger loans. Consequently, interest rate ceilings may discourage small loan amounts or even make small loans unprofitable. In many states, graduated interest rate ceilings, which allow higher rates on smaller loan amounts than larger amounts, have been at least in part justified by the belief that the cost per dollar of credit for small loans being greater than that for large loans.
Estimates of Costs for Personal Loans and their Implications for Break-Even APRs by Loan Amount
Data on the cost of consumer lending have been made available from different sources at various times. The National Commission on Consumer Finance (NCCF) investigated determinants of costs in consumer lending by finance companies in its report (NCCF 1972, chapter 7) using data collected by the National Bureau of Economic Research (Smith 1967). The commission's report examined data from nine large consumer finance companies in 1964. Eight of the nine companies held more than $100 million in consumer receivables. Together the nine companies accounted for 66 percent of receivables of all consumer finance companies at the end of 1964. These companies primarily provided cash loans under state small-loan laws, but most also purchased sales finance contracts. In addition, one of the commission's Technical Studies (Benston 1975) analyzed cost data for finance companies from the National Consumer Finance Association, an industry trade association.
The American Financial Services Association (AFSA), the renamed industry trade association that provided data to Benston, collected balance sheet and income statement data for member companies from 1960 to 1989. Member companies included both consumer and sales finance companies. By the 1980s, the association no longer distinguished between the two kinds of finance companies because asset diversification had increasingly blurred differences between consumer and sales finance companies. However, detailed data on the types of credit held by firms permitted identification of firms that primarily produced personal loans. AFSA provided firm-level data for 1987-89 to researchers at the Federal Reserve for a statistical cost function analysis of the industry (Durkin and Elliehausen 1998). AFSA discontinued collection of financial statement data after 1989.
The Federal Reserve produces comprehensive data on the volume and composition of credit and lease financing provided by the finance company industry, which are reported in its Consumer Credit (G.19), Finance Companies (G.20), and Financial Accounts of the United States (Z.1) statistical releases. To maintain the quality of its statistics, the Federal Reserve conducts every five years a survey of assets and liabilities of finance companies to benchmark its estimates for this industry. In its last survey in 2015, the Federal Reserve added income statement questions for the first time in its Survey of Finance Companies.7 The industry is quite diverse, but exclusion of business lenders, auto finance companies, mortgage lenders, and fringe lenders produces a sample of consumer instalment lenders that is roughly comparable to the consumer finance company samples for 1964 and 1987.8
Trends in Costs of Consumer Finance Companies
Gross revenue of consumer finance companies in 2015 was $29.09 per $100 of receivables (table 1), an amount higher than gross revenue per $100 of receivables in 1964 and 1987 ($21.40 and $24.89, respectively). Total cost in 2015 ($25.19 per $100 of receivables) was also higher in than in the earlier years. Gross revenue less total expenses (net income) is the cost of equity funds. This amount is compensation for owners' investment on the firm. The cost of equity funds in 2015, $4.80 per $100 of receivables, was more than twice the cost of equity funds in 1964 or 1978.
Table 1: Components of credit charges
Dollars per $100 of receivables
| Item | 1964 | 1987 | 2015 |
|---|---|---|---|
| Gross revenue (finance charges and other net ancillary income) | 21.4 | 24.89 | 29.09 |
| Operating expenses | 12.73 | 15.16 | 20.74 |
| Salaries and wages | 5.60 | 6.52 | 8.77 |
| Losses/additions to loss reserves | 2.27 | 2.11 | 5.87 |
| Other operating expenses | 4.87 | 6.13 | 6.10 |
| Operating income (gross revenue less operating expenses) | 8.67 | 9.73 | 8.35 |
| Non-operating expenses | 6.34 | 7.51 | 4.45 |
| Cost of borrowed funds | 4.17 | 6.05 | 2.28 |
| Income taxes | 2.17 | 1.46 | 1.27 |
| Total expenses (operating expenses plus non-operating expenses) | 19.07 | 22.67 | 25.19 |
| Cost of equity funds (gross revenue less total expenses) | 2.33 | 2.22 | 4.80 |
| Memo: | |||
| Average amount of receivables per account (dollars) | 485.00 | 3,103.00 | 2,289.00 |
Sources: (First column) Smith (1967); (second column) American Financial Services Association, Survey of Member Companies, authors' calculations; (third column) Federal Reserve Board, Survey of Finance Companies, authors' calculations.
Table 1 points to the continuing importance of operating expenses in the lending process at consumer finance companies. In 2015, operating expenses accounted for 82 percent of total (operating and non-operating expenses (number not in table). This operating expense share of total expenses is greater than the operating expense share in 1964 and 1987 (about two thirds in both years). Salary and wage expense was the largest component of operating cost in all three years, accounting for 29 percent of total expenses in 1964 and 1987 and 35 percent of total expenses in 2015. Losses and additions to loss reserves, $5.87 per $100 of outstanding credit, were more than two times greater in 2015 than in 1964 and 1987.
Greater risk may in part explain greater gross revenue and losses and additions to loss reserves in 2015. Rapid inflation in the late 1970s and 1980s pushed interest rates to rate ceilings, severely restricting the supply of credit, especially for higher risk consumers (Vandenbrink 1982 and 1985). This development reduced risky lending in the short run, prodding some states to relax rate ceilings to make credit more broadly available. As inflation subsided and interest rates fell, the higher rate ceilings facilitated expanded availability of credit to riskier consumers. The smaller average amount of receivables in 2015 is consistent with more risky loans in 2015 than 1987. Risky consumers may not have been able to qualify for larger loans in 1987, but the higher rate ceilings that prevailed in 2015 permitted lenders to profitably offer riskier consumers small loans.
Greater risk might also help explain the higher salary and wage expense in 2015. The tasks of evaluating applications, arranging loan terms that fit risky applicants' budgets, collecting late payments, and negotiating refinances of existing loans would be especially labor intensive and costly relative to small loan amounts.9
The recent low-interest rate environment following the financial crisis had a significant effect on debt funding costs. Debt funding costs accounted for just 9.4 percent of total costs in 2015, a much smaller share than the debt funding share in 1964 (19.4 percent) and 1987 (26.7 percent). The especially large debt funding share in 1987 can be attributed to the high rates of inflation that prevailed during the 1980s.
The 1972 Report of the National Commission on Consumer Finances
As mentioned, the commission's report examined data from nine consumer finance companies, which accounted for 66 percent of receivables of all consumer finance companies at the end of 1964. Average loan size for these companies was $485 (table 1). The likely term to maturity for loans of this size would be one year. Operating costs per $100 of outstanding balances were $12.73. Non-operating costs were $8.67 per $100 of outstanding balances.
The commission relied on a comprehensive statistical cost analysis, which was later published in one of the commission's Technical Studies (Benston 1975), to develop a method for estimating costs and break-even APRs using Smith's (1967) data.10 The analysis indicated that operating costs generally did not vary appreciably by the size distribution of loans.11 In contrast, the cost of funds was clearly proportional to loan amount. Losses also appeared to be proportional to loan amount.12
To estimate costs by loan amount, the commission report first subtracted the provision for losses from operating expenses ($2.27 per $100). The resulting value, $10.40 per $100, is cost of putting the average loan on the books and servicing it for one year. This cost is largely fixed, as the costs of taking and evaluating an application, originating a loan, receiving payments, and collecting delinquent accounts arise largely because a loan is made. It varies little by the amount of credit extended. As the average loan was $485, the estimated fixed cost per loan was $10.46*($485/$100), which equals $50.73.
Expenses that vary directly by the amount of the debt include losses, funding costs (both borrowed and equity funds), and income taxes. These variable expenses sum to $10.94 per $100 of outstanding balances. Receivables for these finance companies consisted primarily of instalment loans. The average outstanding balance on such loans would be about half of the initial amount financed, due to repayments over time. Thus, the finance charge needed to cover fixed and variable costs of a loan of a given amount can be estimated by the equation $50.73+0.1094*(loan amount/2).
The commission estimated costs for loan amounts ranging from $100 to $3,000 ($594 to $17,805, in 2015 dollars). Estimated costs rose from $55.06 for a $100 loan to $231.80 for a $3,000 loan (figure 1). As a percentage of loan amount, however, costs declined. Costs declined from a little more than half of the loan amount for a loan of $100 to 7.73 percent of the loan amount for a loan of $3,000 (figure 1). As a percentage of loan amount, costs decline steeply at first and then more gradually as loan amount continues to rise. These findings are consistent with economies with regard to loan amount. That is, loan costs increase less than proportionately with loan amount.
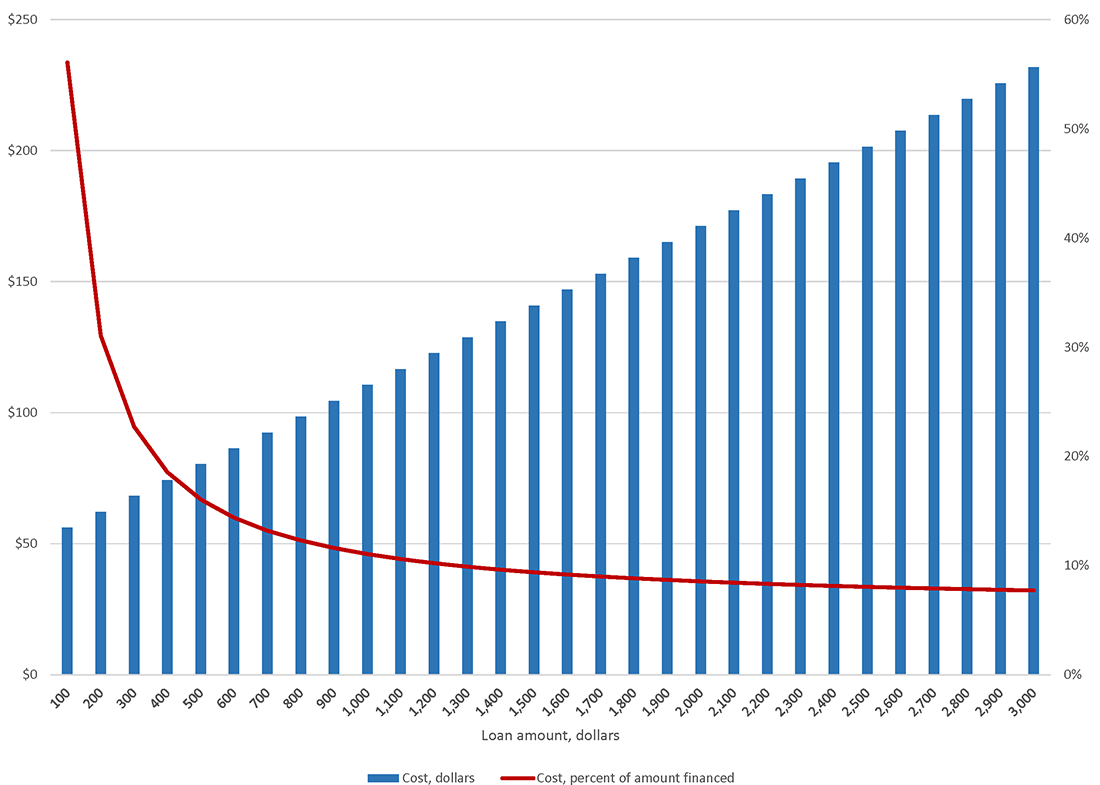
Source: NCFF (1972), exhibit 7-16.
That the finance charge must cover the cost of the loan (including return on investors' equity) for a loan to be profitable allows calculation of a break-even annual percentage rate. The monthly payment for a loan equals the sum of principal and interest divided by the 12-month term of the loan. The interest rate that equates the amount of a loan with the present value of its monthly payments is multiplied by 12 (the number of payments per year) to obtain a break-even APR.
Figure 2 shows the 1972 NCCF estimates of break-even APRs by loan amount. As costs are large relative to loan amount for small loans, break-even APRs are quite high for small loan sizes. The break-even APR is 91.36 percent for a $100 loan ($591 in 2015 dollars) and 53.14 percent for a $200 loan ($1,187 in 2015 dollars). A frequently suggested maximum for annual percentage rate is 36 percent. The loan amount needed to break-even at 36 percent is $332 ($1,960 in 2015 dollars). Break-even APRs become nearly flat for larger loan amounts. The break-even APR is 15.04 percent for a $2,200 loan and 13.98 percent for a $3,000 loan.
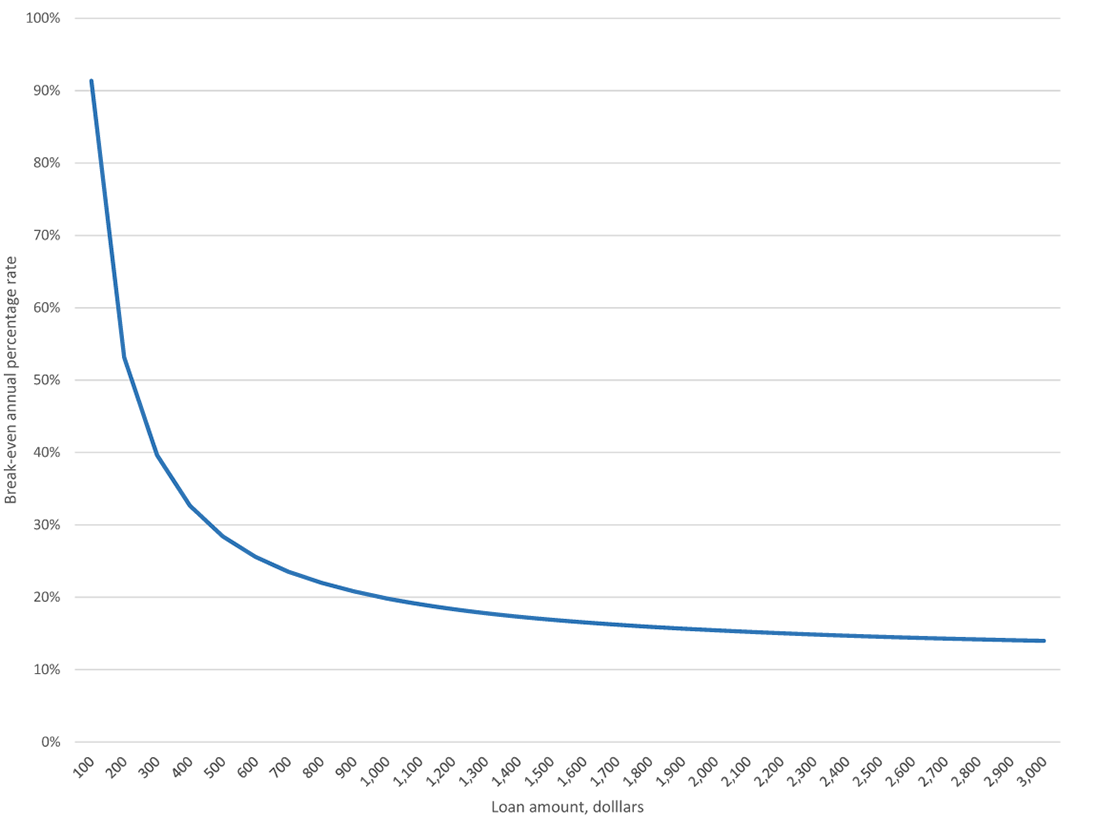
Source: NCFF (1972), exhibit 7-16.
In another technical study for the NCCF, Durkin (1975) analyzed financial statement data from required annual company reports to the Texas Consumer Credit Commissioner from 1968 through 1970. The financial reports covered finance companies in Texas making very small cash loans (loan amounts less than $100). The Texas Consumer Finance Code established special higher rate ceilings for very small loans (article 3.16 loans) than it allowed for larger loans (article 3.15 loans). For the smallest loans allowed, article 3.16 rate ceilings exceeded 100 percent.13
Durkin noted that operating expenses were significantly higher for article 3.16 loans than article 3.15 loans or Smith's (1967) nine consumer finance companies in 1964. Operating costs averaged 80.87 percent for article 3.16 firms over the three years compared to 24.06 percent for 3.15 firms and 21.40 percent for Smith's nine consumer finance companies. Part of the reason for higher operating costs for very small cash loans was greater risk: Article 3.16 lenders' losses were more than three times the losses of article 3.15 lenders. Durkin also attributed a higher salary and wage expense of article 3.16 lenders to greater risk, as small, risky loans require greater monitoring and supervision than the larger article 3.15 loans. Durkin's statistical cost analysis indicated that costs do expand as average loan amount rises, but the rise is considerably less than proportional. Again, the evidence suggests that risky small lending entails considerable fixed costs, which are large relative to loan amount.
In a later study, Durkin (1977) conducted statistical cost analyses with an additional two years' data. Using predicted average costs from his statistical model, Durkin calculated interest rates for different average loan amounts needed to cover operating expenses (less advertising but including bad debt). The annual percentage rate for an average loan amount of $50 ranged from 101.2 percent to 132.8 percent, depending on the year. Annual percentage rates for $75 and $100 loans ranged from 81.5 to 105.6 percent and 69.2 to 90.5 percent, respectively. Note that these estimated APRs do not include advertising expenses, income taxes, and funding costs, which also must be covered for small loans to be provided in the market.
1987 AFSA Survey of Member Companies
The American Financial Services Association (AFSA), the renamed trade association that provided data to Benston for the NCCF, collected financial statement data from member companies until 1989. Durkin and Elliehausen (1998) used 1987-1989 AFSA data to estimate statistical cost functions for consumer finance companies, which enabled them to investigate economies of scale and economies with respect to loan amount.14 Using a more general statistical cost model than was available to Benston, they found that economies of scale were limited at the firm level but existed at the office level. Scale economies were observed at smaller offices, but scale economies were exhausted as office size increased. Notable for this paper is their finding that operating costs increased less than proportionately with average loan amount (economies with respect to loan amount). This finding suggests that smaller loans were relatively more expensive to produce per loan dollar than larger loans.
The second column of table 1 reports expense data for consumer finance companies in for 1987.15 Using the NCCF methodology, fixed costs (that is, operating expenses less losses/additions to loss reserves) are estimated to be $319.20, and variable costs are estimated to be 11.84 percent of the average outstanding balance. Break-even APRs are estimated over the loan amount range $327 to $9,802, the 1987 equivalent to the NCCF's $100 to $3,000 loan amount range.
Observed economies with respect to loan amount produce large break-even APRs for small loan amounts. The break-even APR is 156.99 percent for a $322 loan amount (equivalent to $100 in 1972) and 89.46 for a $653 loan amount (equivalent to $200, figure 3) the horizontal axis covers the same range of loan amounts expressed in 1987 dollars. The loan amount for a 36 percent break-even APR is $2,181. Again, break-even APRs are nearly flat at larger loan amounts—18.60 percent for a loan amount of $7,188 and 16.53 for a loan amount of $9,802, for example.
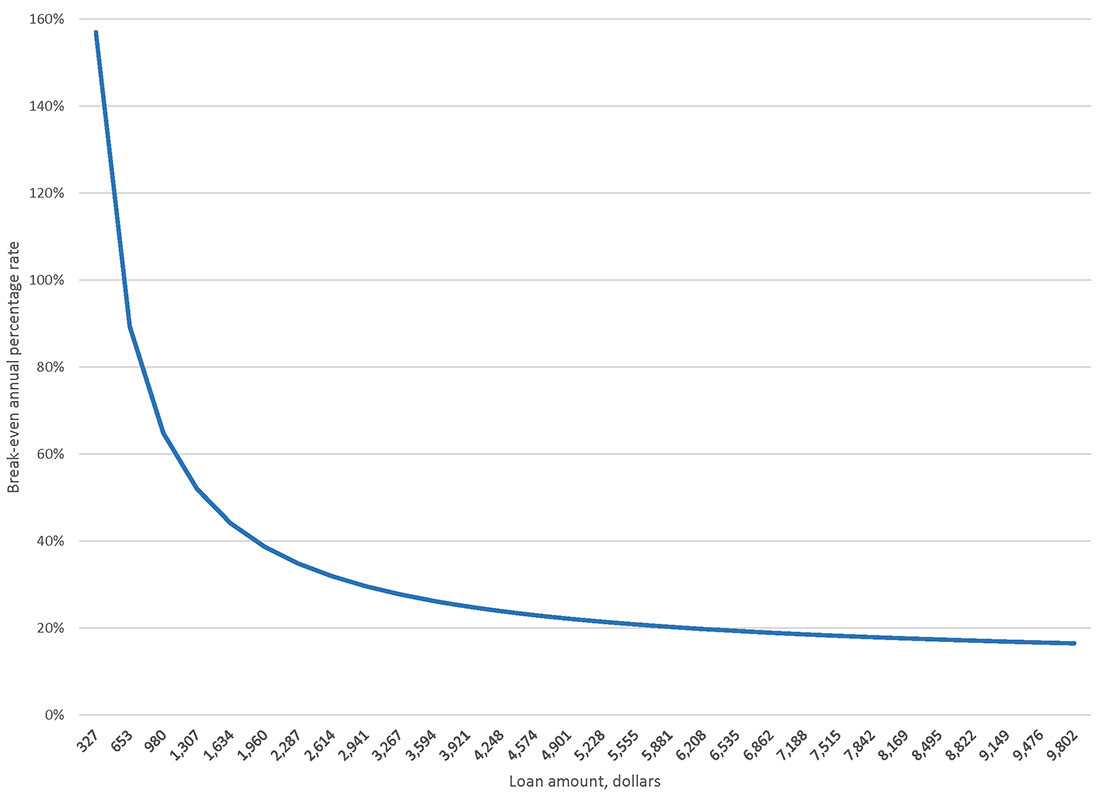
Source: American Financial Services Association, Survey of Member Companies, authors' calculations.
The Federal Reserve's 2015 Survey of Finance Companies
The Federal Reserve's Survey of Finance Companies, which it uses to produce population estimates of the volume and composition of credit and lease financing provided by the finance company industry, provides the most recent available data on finance company costs. The income statement categories in the Federal Reserve survey were the same as the categories in the earlier AFSA surveys of association members.
The third column of table 1 reports expense data for consumer finance companies for 2015. Using the NCCF methodology, fixed costs (that is, operating expenses less losses/additions to loss reserves) are estimated to be $340.37, and variable costs (losses/additions to loss reserves, funding and taxes) are estimated to be 14.22 percent of the average outstanding balance.
The scatter plot in figure 4 shows the distribution of operating cost per $100 of receivables by the average amount of receivables. Although the level of operating costs in 2015 were higher than in earlier years (as indicated in table 1), the relationship between operating costs looks much like that found in the 1972 and 1987 data. Operating costs per $100 of receivables are quite high for firms having low average account sizes. Operating cost falls rapidly as average account size increases. For larger average account sizes (about $3,000 or higher) operating costs are flat. These new data are consistent with substantial fixed costs in consumer lending. This consideration has important implications for interest rates necessary to elicit small loans in a market economy.
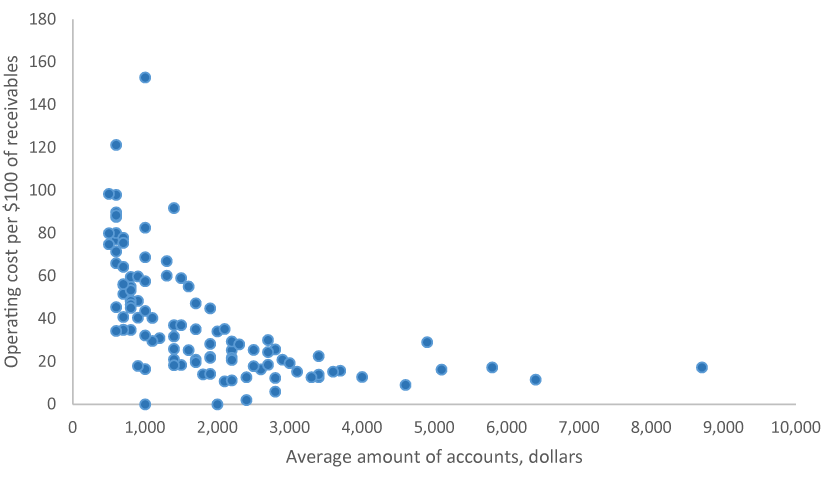
Source: Federal Reserve Board, Survey of Finance Companies, authors' calculations.
The pattern for break-even APRs in 2015 is similar to that presented in the NCCF report (figure 5). Break-even APRs were quite large for small loan amounts but declined rapidly as the loan amount increased. A $594 loan required a 103.54 percent rate, and a $1,187 loan required a still high 60.62 percent rate (figure 5). A loan amount of $2,530 is necessary to break even at 36 percent. Again, for large loan amounts the curve for break-even APRs is nearly flat. The rate is 17.48 percent for a $13,057 loan amount and 16.25 percent for a loan amount of $17,805. While larger loan amounts have much lower interest rates than smaller loan amounts, larger loans entail greater interest payments (finance charges) and a longer period of indebtedness. In addition, risky consumers may not qualify for larger loan amounts.
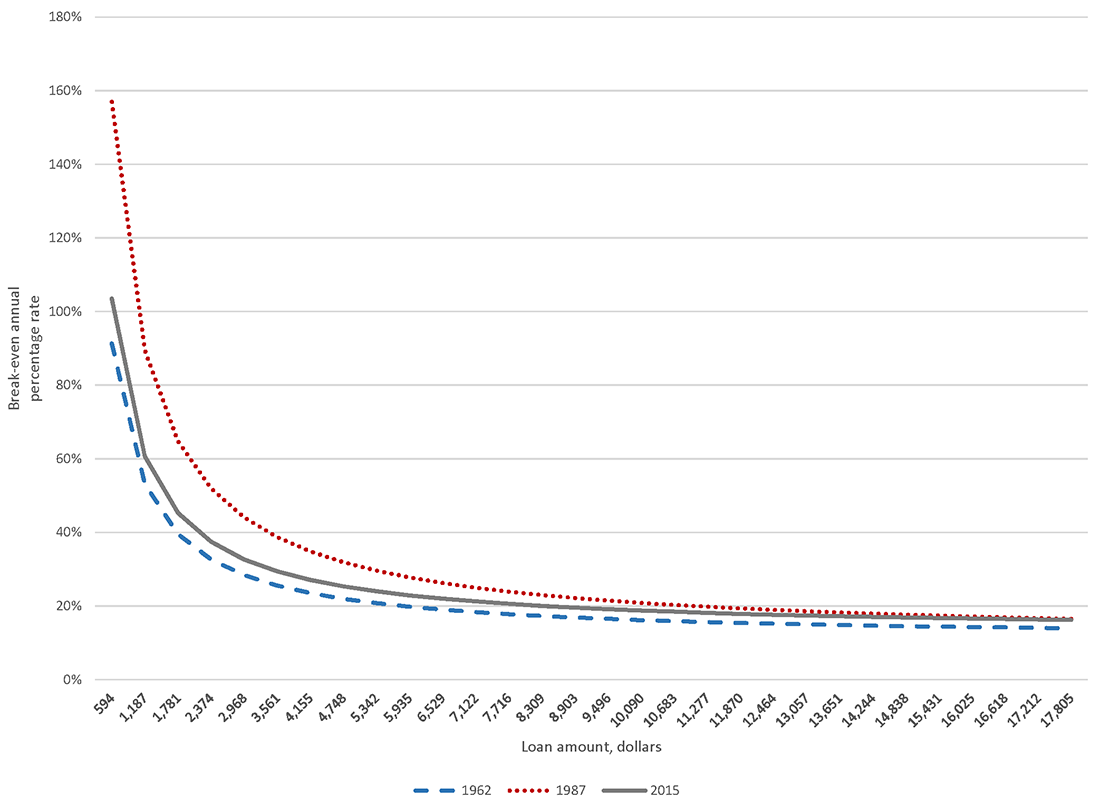
Sources: 1962, (Smith 1967); 1987, American Financial Services Association, Survey of Member Companies, authors' calculations; 2015, Federal Reserve Board, Survey of Finance Companies, authors' calculations.
Conclusions
Previous studies have found that costs of consumer lending rise less than proportionately with loan amount. They attribute this finding to considerable fixed costs. Costs arise because an application is evaluated, a loan is originated, payments are processed, and efforts are taken to collect delinquent accounts. These costs are relatively large and not very sensitive to the loan amount. Funding cost, which is sensitive to loan amount, accounts for only a small part of loan costs. The previous studies are over 30 years old, however. Many changes in technology, competition, and regulation have occurred since these studies were conducted. A reexamination of the cost structure of the consumer finance industry is warranted.
This article examines new data on costs in consumer lending. The data are from a survey of finance companies conducted by the Federal Reserve for benchmarking its 2015 estimates of the volume of the finance company industry's financing of consumers and businesses. The findings suggest that despite the many changes in consumer credit markets, a large share of costs of small personal loans at consumer finance companies remain fixed. This conclusion does not imply that technology has no impact on costs. Automation may displace some activities previously performed by employees. However, technology does not eliminate the need to have employees available to originate loans, process payments, and collect delinquent accounts. Moreover, the use of computers and communication systems and personnel to operate them introduces other indivisibilities that give rise to fixed costs in the process. With substantial fixed costs, high interest rates are necessary to provide sufficient revenue to cover the costs of providing such loans. If small loan revenue is constrained by rate ceilings, only large loans will be provided.16 Consumers who need a small loan or only qualify for a small loan would not be served.
Interest rate ceilings for consumer finance companies commonly are a percentage of the loan amount. However, they sometimes have features based on a recognition that small loans are relatively more costly than larger loans. They may be graduated, with higher rates being allowed for lower loan balances. Rate ceilings also may allow a fixed dollar fee for originating or servicing a loan. Such features mitigate the restrictive effects of rate ceilings on availability of small loan amounts. However, they do little to allay concerns about small loan products. The dilemma is that rates required to cover the cost of a small loan amount appear unconscionably high.17
References
Anderson, Elisabeth. Experts, Ideas, and Policy Changes: The Russell Sage Foundation and Small Loan Reform, 1909-1941. Theory and Society, 37 (June 2008): 271-310.
Benston, George J. The Costs to Consumer Finance Companies of Extending Consumer Credit. National Commission on Consumer Finances, Technical Studies, Volume II. Washington, DC: US Government Printing Office, 1975.
Benston, George J. Risk on Consumer Finance Company Personal Loans. Journal of Finance, 32 (May 1977a): 593-607.
Benston, George J. Graduated Interest Rate Ceilings and Operating Costs by Size of Small Consumer Cash Loans. Journal of Finance, 32 (June 1977b): 695-707.
Benston, George J. Rate Ceiling Implications of the Cost Structure of Consumer Finance Companies. Journal of Finance, 32 (September 1977c): 1169-94.
Bӧhm-Bawerk, E. Capital and Interest: A Critical History of Economic Theory. New York: Brentano's, 1922.
Canner, Glenn B, Charles A. Luckett, and Thomas A. Durkin. Home Equity Lending: Evidence from Recent Surveys. Federal Reserve Bulletin, 80 (July 1994): 571-83.
Chen, Lisa, Gregory Elliehausen, and Mark Wicks. Survey of Finance Companies, 2015. Federal Reserve Bulletin, 104 (June 2018): 1-19.
Durkin, Thomas A. A High Rate Market for Consumer Loans: The Small Small Loan Industry in Texas. National Commission on Consumer Finances, Technical Studies, Volume II. Washington, DC: US Government Printing Office, 1975.
Durkin, Thomas A. Consumer Loan Costs and the Regulatory Basis of Loan Sharking. Journal of Bank Research, 8 (Summer 1977). 108-17.
Durkin, Thomas A. and Gregory Elliehausen. The Cost Structure of the Consumer Finance Industry. Journal of Financial Services Research, 13 (February 1998): 71-86.
Durkin, Thomas A., Gregory Elliehausen, Michael E. Staten, and Todd J. Zywicki. Consumer Credit and the American Economy. New York: Oxford University Press, 2014.
Durkin, Thomas A. and E. Ray McAlister. An Economic Report on Consumer Lending in Texas, Monograph No. 4. West Lafayette, Indiana: Purdue University, Krannert Graduate School of Management, Credit Research Center, 1977).
Fisher, Irving. The Rate of Interest: Its Nature, Determination and Relation to Economic Phenomena. New York: Macmillan, 1907.
Marshall, Alfred. Principles of Economics, Eighth Edition. London: Macmillan, 1920.
Miller, Rae-Ann, Susan Burhouse, Luke Reynolds, and Aileen G. Sampson. A Template for Success: The FDIC's Small Dollar Loan Pilot Program. FDIC Quarterly, 4 (First Quarter 2010): 28-37.
National Commission on Consumer Finances. Consumer Credit in the United States. Washington, DC: US Government Printing Office, 1972.
Nugent, Rolf. Three Experiments with Small Loan Interest Rates. Harvard Business Review, 12 (October 1933): 35-46.
Robinson, Louis N. and Rolf Nugent. The Regulation of the Small Loan Business. New York: Russell Sage Foundation, 1935.
Smith, Paul A. Recent Trends in the Financial Position of Nine Major Finance Companies, in John M. Chapman and Robert P. Shay, eds. The Consumer Finance Industry: Its Costs and Regulation. New York: Columbia University Press, 1967.
Vandenbrink, Donna C. The Effects of Usury Ceilings. Federal Reserve Bank of Chicago, Economic Perspectives, 6 (Midyear 1982): 44-55.
Vandenbrink, Donna C. Usury Ceilings and DIDMCA. Federal Reserve Bank of Chicago, Economic Perspectives, 9 (September/October 1985): 25-30.
1. Economists have long recognized that lending costs involve more than just forbearance and risk. See, for example, Fisher (1907, pp. 88, 209), Bӧhm-Bawerk (1922, p. 7), and Marshall (1920, pp.488-9). Return to text
2. NCCF (1972, p. 145). In an analysis of rate regulation early twentieth century, Nugent (1933) observed similar consequences in four states that lowered rate ceilings in 1929. The number of finance companies operating in these states declined, finance companies closed offices with smaller loan volumes, finance companies stopped making smaller loans, and loan sharks reemerged. Return to text
3. Semi-philanthropic lending institutions existed already in the nineteenth century. The first US credit union was established in 1909 in Maine. In the same year, Massachusetts passed enabling legislation for credit unions. About the same time, Arthur J. Morris developed a loan product that he believed would allow banks to make small loans profitably under existing laws. The Morris plan loan charged a legal rate of interest that collected interest at origination out of the loan principal. The bank obtained additional revenue by requiring the borrower to purchase non-interest-bearing certificates. The borrower's payments were credited to purchase of the certificates, not to reducing the loan principal. When the required certificate purchases were completed, the certificate was cancelled, with the proceeds from the cancellation being used to repay the loan. At the close of 1910, semi-philanthropic, cooperative, and Morris plan banks were too few to have a significant impact in the market for small loans. For discussion, see Robinson and Nugent (1935, chapter 4) or Anderson (2008). Return to text
4. The American Association of Small Loan Brokers and the National Federation of Remedial Loan Associations also contributed to the development of the model Uniform Small Loan Law. For discussion of the development of the model, see Robinson and Nugent (1935, chapter 5) or Anderson (2008). Return to text
5. Other types of finance companies specialize in vehicle, real estate, or business lending. In addition to personal cash loans, finance company products include vehicle loans (both sales finance and direct loans), vehicle and equipment leases, business inventory and accounts receivable financing, revolving credit, non-vehicle consumer durable goods financing, and closed-end mortgage and home equity loans. See Chen, Elliehausen, and Wicks (2018). Return to text
6. In contrast, depository institutions typically offer both business and consumer credit, and their sources of funds include various types of deposits, which are products in themselves. For further discussion, see Benston (1975). Return to text
7. See Chen, Elliehausen, and Wicks (2018) for discussion of survey methods and descriptive statistics. The data in table 1 for 1987 differ from Chen, Elliehausen, and Wicks. For this paper, several finance companies that were large home equity lenders were excluded from the 1987 sample. Their exclusion makes the 1987 statistics more closely reflect the cost of personal lending. Home equity lending was much more prevalent in the late 1980s and early 1990s than in earlier years (Canner, Luckett, and Durkin 1994) and after the plunge in home prices following the financial crisis. Return to text
8. Auto and mortgage lenders are defined as finance companies with more than 50 percent of assets in auto credit and lease receivables or mortgages. Fringe lenders include pawnshops, payday lenders, and auto title companies. In addition, a small number of firms with average outstanding receivables outside the range of loan amounts considered in the NCCF report (less than $594 or greater than $17,805 in 2015 dollars) were excluded. Return to text
9. Salary and wage expenses for consumer lending at banks have been considerately lower than salary and wage expenses at consumer finance companies. Banks reluctance to lend to riskier consumers may in part explain banks' lower salary and expense. According to data on consumer lending costs at commercial banks from the Federal Reserve's Functional Cost Analysis (FCA), banks incurred lower loan losses and additions to loss reserves and lower salary and wage expense than consumer finance companies. In 1989, the last year for which both bank and consumer finance company data are available, salary and wage expense was $1.40 per $100 of receivables at banks and $5.50 per $100 of receivables at consumer finance companies Losses and additions to loss reserves was $0.50 per $100 at banks and $2.00 per $100 of receivables at consumer finance companies. The 1989 data are not atypical. The FCA was a voluntary cost accounting program for estimating the expenses for several different bank products. Participants were not representative of the population of banks. The program was discontinued in 1998. For further discussion, see Durkin et al. (2014). Return to text
10. Benston analyzed office-level data from three large finance companies and firm-level data from 124 consumer finance companies. These data were obtained through the National Consumer Finance Association, a finance company trade association. Return to text
11. For the three-company, office-level data, Benston (1975) found no stable, consistent, sensible relationship between operating costs and number of loans made of various amounts. For the 124-company, firm-level data, operating costs increased much less than proportionately with average loan amount. These findings are consistent with a considerable part of operating expenses being fixed. Regarding relationship between costs and rates, Benston concluded: "…[The] cost of servicing borrowers … is quite high. On the average, excluding advertising, it costs finance companies between $72 and $64 for operating costs alone. … [Operating] expenses make small loans under about $300 economically impossible to make. To these amounts, one should add about 3 percent per dollar for losses. Interest might be estimated as a weighted average of debt and equity. If the debt rate is taken at 7 percent, the before tax return on equity as 20 percent, and the percentage of equity to assets as 26 percent, the average interest rate is 10 percent. Thus, if all factor costs are to be 'covered' (roughly), … the ceiling rates would have to be 86 percent on the first $100, and 13 percent on amounts over $100 (pp. 153-4)." Return to text
12. Benston found that operating costs at the office level varied significantly with the number of loans made or serviced, with costs increasing less than proportionately with number of loans (economies of scale). He attributed economies of scale to the small size of some of the offices, which was the result of transaction costs limiting the size of markets and discontinuities in the use of personnel. However, Benston found little or no scale economies at the firm level, where firms may adjust the number of offices for the volume of output. See also Benston (1977a), Benston (1977b), and Benston (1977c). Return to text
13. Article 3.15 and article 3.16 rate ceilings are now chapter 342-E and chapter 342-F ceilings, respectively. For a brief discussion the Texas Finance Code ceilings, see Durkin et al. (2014, chapter 8). Durkin and McAlister (1977) examined costs for article 3.15 lenders. Return to text
14. Durkin and Elliehausen defined consumer finance companies as firms that had more than half of their assets in consumer receivables over the 1987-1989 period. These firms' consumer receivables accounted for about three-fourths of the Federal Reserve's estimate of consumer credit at finance companies. Return to text
15. Data for 1988 and 1989 were similar to 1987 data. The 1987 sample had a somewhat greater number of firms than the other years' samples. A small number of firms were deleted because their average loan amount outside the range of loan amounts considered in exhibit 7-16 in the NCCF report, less than $594 or greater than $17,805 in 2015 dollars. The final sample consisted of 79 firms. Return to text
16. Limited evidence suggests that this conclusion applies to banks as well. In 2008, the Federal Deposit Insurance Corporation (FDIC) initiated a pilot project to stimulate development of low-rate small dollar loan products at banks (Miller et al. 2010). Project guidelines included loan amounts up to $1,000, annual percentage rates less than 36 percent, low or no origination fees, prompt application processing, and streamlined underwriting. Twenty-eight banks participated in the project. All of the pilot products were closed-end loans. During the project period, the FDIC raised the maximum loan amount to $2,500 in response to requests from several banks. The banks reported that larger loans generated greater revenue at no greater operating cost than smaller loans. At the end of the project period, the banks reported that the costs of the pilot loans were similar those of other consumer loans, but the interest and fees from the pilot loans were not always sufficient to achieve robust short-term profitability. Return to text
17. Allowing a dollar origination or service fee does not eliminate the apparent unconscionable interest rate dilemma for small loans. The dollar fee would be included in the calculation of an effective annual interest rate, such as the annual percentage rate in Truth in Lending. Return to text
Chen, Lisa, and Gregory Elliehausen (2020). "The Cost Structure of Consumer Finance Companies and Its Implications for Interest Rates: Evidence from the Federal Reserve Board's 2015 Survey of Finance Companies," FEDS Notes. Washington: Board of Governors of the Federal Reserve System, August 03, 2020, https://doi.org/10.17016/2380-7172.2610.
Disclaimer: FEDS Notes are articles in which Board staff offer their own views and present analysis on a range of topics in economics and finance. These articles are shorter and less technically oriented than FEDS Working Papers and IFDP papers.