FEDS Notes
June 22, 2021
The Global Recovery: Lessons from the Past
Dario Caldara, Matthew DeHaven, Francesco Ferrante and Matteo Iacoviello1
The downturn in global economic activity caused by the COVID-19 pandemic was unique both for its causes and for its severity. Even though, on a global scale, the recent contraction is unprecedented in modern times, it is useful to look at the consequences of large recessions which affected individual countries in the past. In this note, we draw insights about the ongoing global recovery by looking at the evolution of several economic indicators in the aftermath of past recessions.
We find that, following severe contractions, output typically remains well below its pre-recession trend in the medium term. This behavior is more marked for severe recessions that are accompanied by financial crises, while severe but short contractions result in a faster recovery. The post-COVID-19 recovery appears to be much more rapid than in standard severe recessions, putting it roughly in line with severe and short recessions of the past.
We argue that outsized policy interventions in response to COVID-19 provided unprecedented support to households and firms, preventing a more prolonged downturn. Furthermore, productivity is likely to be more resilient compared to past slumps, which should help to sustain the pace of the recovery in the coming years.
Recoveries Following Severe Recessions
We consider recession episodes in 56 advanced economies (AEs) and emerging market economies (EMEs).2 We employ quarterly data between 1947 and 2019, obtaining 9,805 observations for real GDP. Studying recovery dynamics at a quarterly frequency, rather than at a yearly frequency, allows us to make a more direct comparison with the COVID-19 recession, in which an unprecedented global contraction in the first two quarters of 2020 was followed by an equally unprecedented rebound in the second half of the year.
Table 1 summarizes the nature of the recessions in our data. We identify a total of 246 recessions, 183 of them in the AEs and 63 in the EMEs.3 The average decline in GDP in these episodes was about 4.4 percent, with contractions being more severe in EMEs than AEs. About one tenth of these recessions were "severe," and featured an average GDP decline of about 15 percent, a magnitude that is comparable to what occurred in many economies during the first half of 2020.4 Table 1 also illustrates that half of the severe recessions were "severe and financial" recessions, in which the downturn was accompanied by a financial crisis, while half of them were "severe and short" recessions, in which one quarter of positive growth followed a large two-quarter decline. 5
Table 1: Nature of Past Recessions
| Recessions | Average GDP Drop (%) | |||||
|---|---|---|---|---|---|---|
| All | AEs | EMEs | All | AEs | EMEs | |
| Total | 246 | 183 | 63 | 4.4 | 3.8 | 6.2 |
| Severe | 22 | 11 | 11 | 15.3 | 14.4 | 16.2 |
| Severe and financial | 11 | 4 | 7 | 15.5 | 19.3 | 13.3 |
| Severe and short | 9 | 4 | 5 | 13.4 | 10.4 | 15.8 |
Note: Summary statistics for number and nature of past recessions in a sample of 56 countries from 1947–2019. AEs is advanced economies. EMEs is emerging market economies. Average GDP drop is measured from peak to trough.
Source: Authors' calculations.
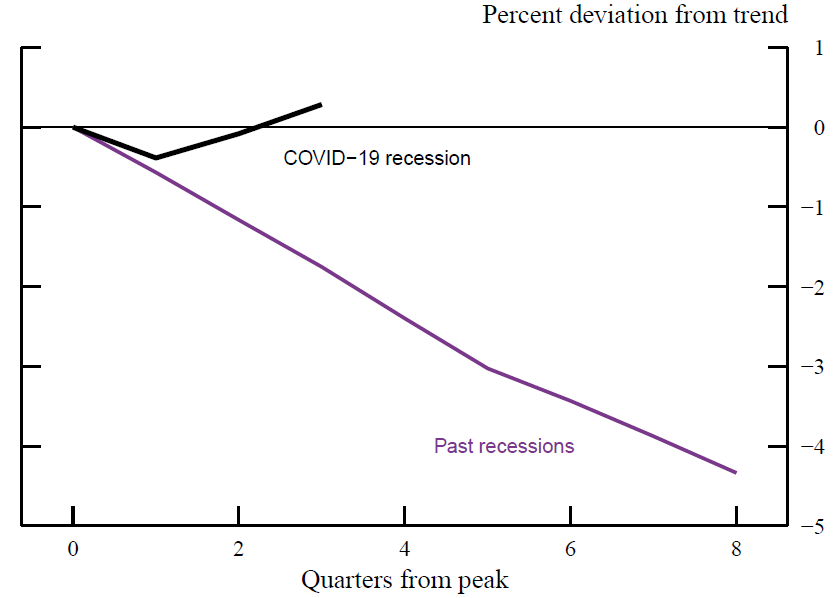
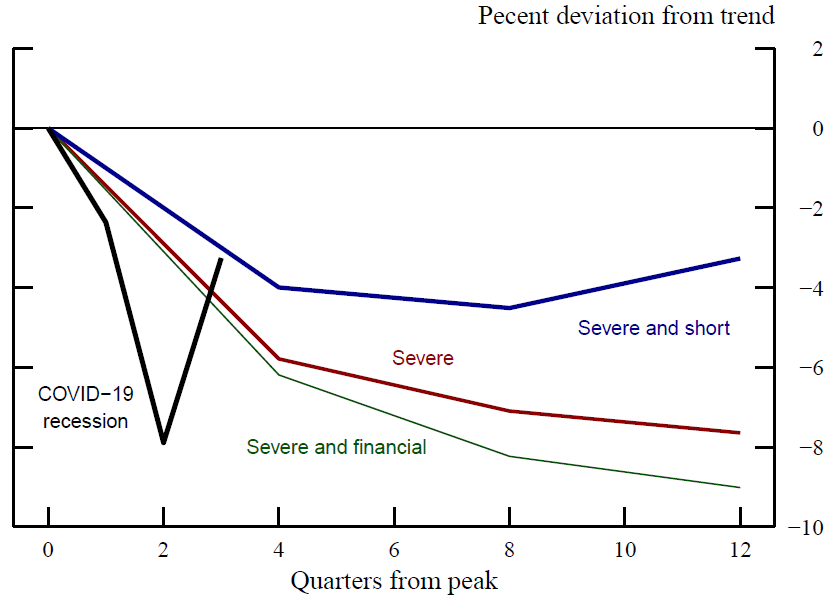
Following a severe recession, economic activity typically experiences a long-lasting drag. As shown by the red line in figure 1, on average, GDP remains about 15 percent below its pre-recession trend three years after the onset of a severe recession.6 Severe and financial recessions tend to have even greater persistent negative effects on GDP (green line), as documented in well-known studies.7 By contrast, "severe and short" contractions are followed by more rapid rebounds. Nonetheless, even these shorter recessions usually leave the level of GDP about 5 percent below pre-crisis trend after three years.
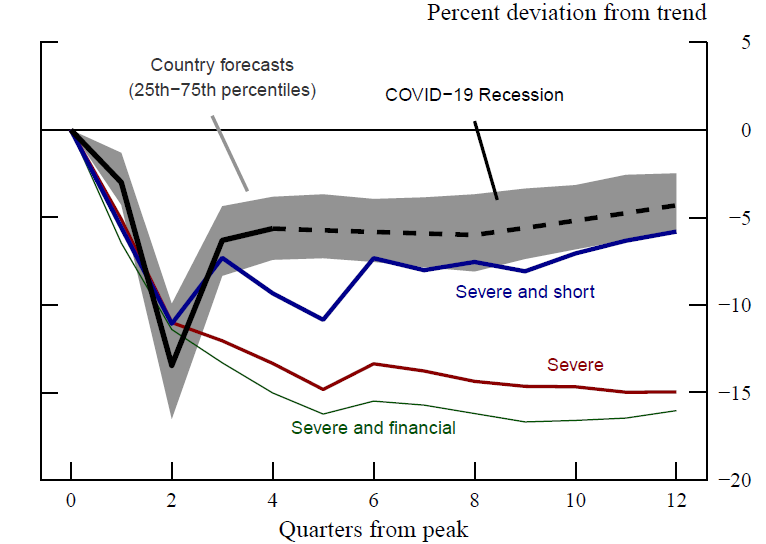
Note: The black line shows the current average GDP path for the COVID-19 recession supplemented with the forecast from the IMF's World Economic Outlook. The gray band shows the 25th to 75th percentile of individual countries' current GDP paths and forecasts. Blue, red, and green lines represent the mean GDP path across past recessions. Severe recessions have a drop in GDP of greater than 7 percent over 2 quarters, preceded by positive growth. Short recessions have positive growth in the third quarter. Financial recessions coincide with banking crises defined by Luc Laeven and Fabian Valencia (2020). Trend is the average growth from 2 to 6 years before each recession. Quarterly GDP data covers 56 countries from 1947–2019.
Source: International Monetary Fund World Economic Outlook (April 2021), authors’ calculations.
The current recovery outperforms those from typical severe recessions. Figure 1 compares the ongoing global recovery, and its projected path, with the historical evolution of GDP in the aftermath of severe contractions. Given the sharp rebound in economic activity in the second half of 2020 (solid portion of black line), the recovery from the COVID-19 shock has so far outperformed those from typical severe recessions, suggesting that this episode may look more like the "severe and short" recessions rather than the "severe and financial" ones.8 Indeed, the average foreign GDP forecast from the IMF April 2021 World Economic Outlook (dashed portion of black line) lines up well with the recoveries from severe and short contractions.
There is important heterogeneity across recoveries from severe recessions. In table 2, we report the number of contractions which were followed by "overshooting recoveries", that is a recovery with output rising above its pre-recession trend within three years. As shown in the first row of table 2, only about one third (70 out of 246) of total foreign recessions were followed by an overshooting recovery. However, most of these overshooting episodes occurred after shallow contractions.9 When we restrict our sample to severe recessions, overshootings are more rare, representing less than one fourth of such episodes (5 out of 22), mostly in the EMEs.10 As shown in table 2 and in figure 2, and in line with the evidence in figure 1, overshootings are even rarer (2 out 11) following severe and financial contractions, while they are more common (4 out of 9) after severe and short contractions.
Table 2: Past Overshooting Recessions
| Recessions | Overshooting recoveries | |||||
|---|---|---|---|---|---|---|
| All | AEs | EMEs | All | AEs | EMEs | |
| Total | 246 | 183 | 63 | 70 | 52 | 18 |
| Severe | 22 | 11 | 11 | 5 | 1 | 4 |
| Severe and financial | 11 | 4 | 7 | 2 | 0 | 2 |
| Severe and short | 9 | 4 | 5 | 4 | 1 | 3 |
Note: Counts of recessions and recessions with overshooting recoveries in sample of 56 countries from 1947–2019. AEs is advanced economies. EMEs is emerging market economies. Overshoots recover GDP to trend within 3 years of each recession trough. Trend is the average growth from 2 to 6 years before each recession.
Source: Authors' calculations.
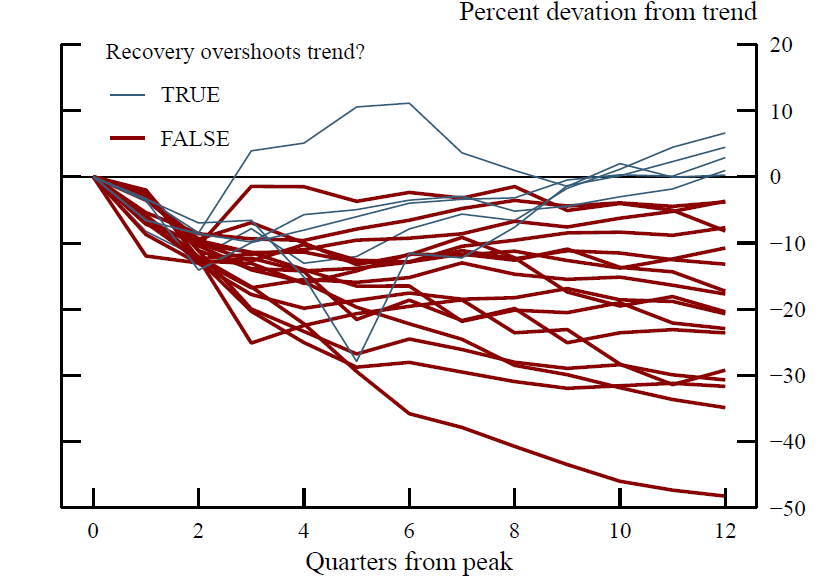
Note: Each line plots the GDP path for each of the 22 "severe recessions" in the sample. Severe recessions have a drop in GDP of greater than 7 percent over 2 quarters, preceded by positive growth. Trend is the average growth from 2 to 6 years before each recession. Quarterly GDP data covers 56 countries from 1947–2019.
Source: Authors’ calculations.
Policy Responses and the post-COVID-19 recovery
The relatively benign outlook for the post-COVID-19 recovery may be the result of the aggressive and broad measures enacted by foreign governments and central banks in response to the COVID-19 pandemic.
Central banks interventions supported market functioning and access to credit, avoiding widespread financial turmoil. Expansionary monetary policy, massive liquidity provision and targeted credit support contributed to stabilize financial conditions and reduce volatility across many countries.
Discretionary fiscal responses amounted to more than 20 percent of GDP in AEs and almost 10 percent in EMEs, where policy space is more limited, as shown in figure 3. These fiscal interventions provided extraordinary support to the balance sheets of firms and households. For example, strong government support for businesses, through grants, loans, and moratoriums on debt repayments, contributed to an unprecedented—relative to past recessions—reduction in bankruptcies in most AEs (figure 4).11 These measures limited the deterioration in firms net worth and will likely sustain investment growth. In AEs, fiscal policy provided substantial backing to households disposable income, which held up considerably better compared to previous downturns (see figure 5), and which even increased in a few countries during 2020. The resulting increase in savings should boost consumer spending once health restrictions are lifted, bolstering the pace of the recovery.
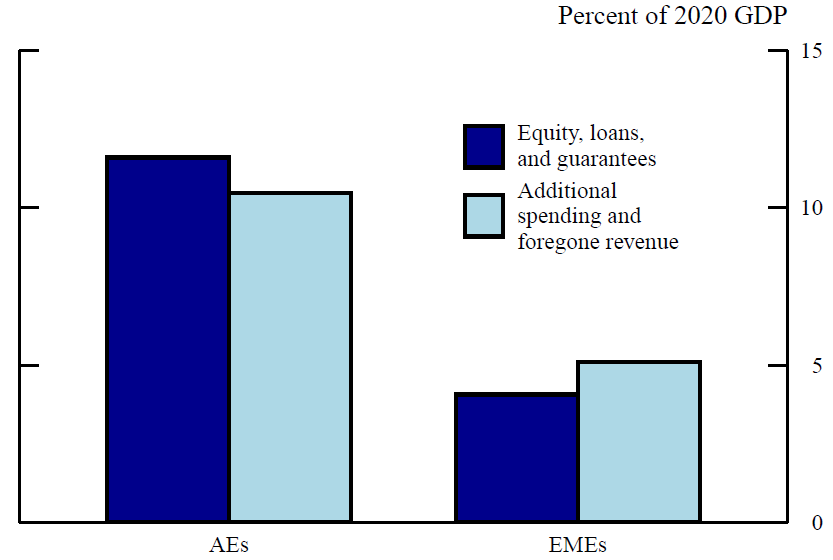
Note: Data summarize key fiscal measures enacted by 20 advanced economies (AEs) and 15 emerging market economies (EMEs) in response to the COVID-19 recession as of March 17, 2021. Aggregates are a simple average across countries.
Source: International Monetary Fund.
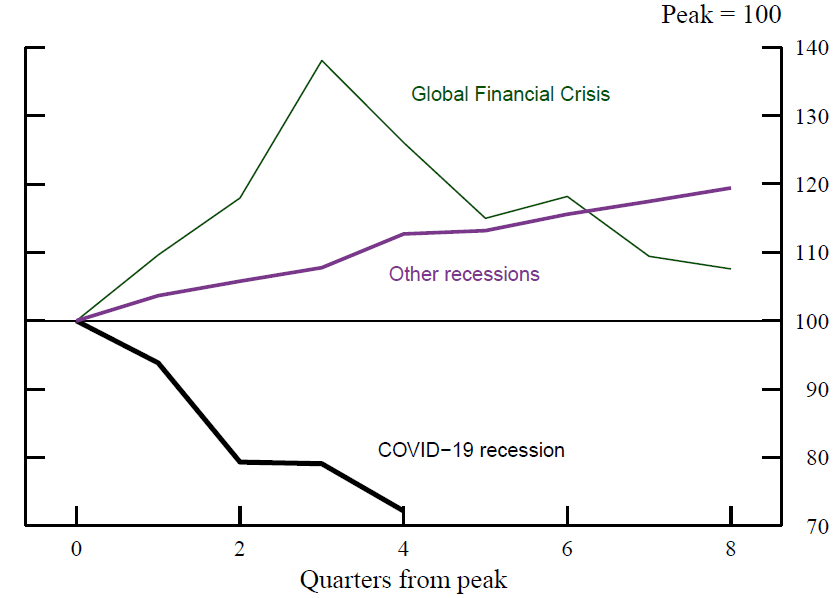
Note: Data are from 13 countries (11 advanced foreign economies, the United States, and South Africa) from 1990–2020.
Source: International Monetary Fund, CEIC, national authorities.
Note: Data are for 19 advanced economies from 1975–2019. Past recessions cover 75 episodes. Trend is the average growth from 2 to 6 years before each recession.
Source: Federal Reserve Bank of Dallas, authors’ calculations. The authors acknowledge use of the dataset described in Mack and Martínez-García (2011).
The Role of Productivity
The evolution of productivity will also be important in determining the speed of the current recovery. Previous severe recessions resulted in long-lasting declines in labor productivity, which hindered the rebound in activity. After severe recessions, average labor productivity usually remains 4 to 9 percent below its pre-recession trend three years after the start of the crisis (figure 6). Large downturns can affect productivity through several channels, including scarring effects on human capital, lower innovation, and capital misallocation.12
Note: Observations for past recessions are severe (17), severe and short (7), and severe and financial (10). Severe recessions have a drop in GDP of greater than 7 percent over 2 quarters, preceded by positive growth. Short recessions have positive growth in the third quarter. Financial recessions coincide with banking crises defined by Luc Laeven and Fabian Valencia (2020). Trend is the average growth from 2 to 6 years before each recession. Data are for 53 economies for previous recessions and 17 economies for the COVID-19 recession.
Source: The Conference Board, Organization for Economic Co-operation and Development Economic Outlook, authors’ calculations.
The implications of the COVID-19 recession for productivity are difficult to predict.13 Following a large decline in the first half of 2020, output per hour rebounded strongly in the second half of the year (the black line in figure 6). Several studies suggest that the COVID-19 pandemic may bring about structural changes and cleansing effects that can offset the decline in productivity typically associated with sharp contractions, providing further support to the recovery in the coming years. For example, the exit of unproductive firms might foster reallocation toward more productive businesses and industries, though one side effect of the policies used to support troubled firms during the pandemic might be that unviable companies are kept operating longer than necessary.14 In addition, digitization and automation accelerated in several companies as a result of the pandemic. Finally, many firms may opt for a permanent shift toward new flexible working arrangements, including remote working, which, together with the adoption of new technologies, could increase the productivity of many workers.15
References
Jose Maria Barrero, Nicholas Bloom, and Steven J. Davis (2020), "Why Working from Home Will Stick," BFI Working Paper 2020-174
Nicholas Bloom, Philip Bunn, Paul Mizen, Pawel Smietanka, and Gregory Thwaites (2020), "The Impact of Covid-19 on Productivity," NBER Working Paper Series 28233.
Valerie Cerra and Sweta Chaman Saxena (2008), "Growth Dynamics: The Myth of Economic Recovery," American Economic Review, vol. 98 (March), pp. 439–57.
Alistair Dieppe, Sinem Kilic Celik, and Cedric Okou (2020), "Implications of Major Adverse Events on Productivity," Policy Research Working Paper 9411.
Robert Martin, Teyanna Munyan, and Beth Anne Wilson (2015), "Potential Output and Recessions: Are We Fooling Ourselves?" International Finance Discussion Papers 1145
Albert Queralto (2020), "A Model of Slow Recoveries from Financial Crises," Journal of Monetary Economics, vol. 114 (October), pp. 1–25.
Luc Laeven and Fabian Valencia (2020), "Systemic Banking Crises Database II," IMF Economic Review, vol. 68 (June), pp. 307-61
Mack, A., and E. Martínez-García. 2011. "A Cross-Country Quarterly Database of Real House Prices: A Methodological Note." Globalization and Monetary Policy Institute Working Paper No. 99, Federal Reserve Bank of Dallas.
1. Contact: [email protected]. At the time of writing, all authors worked at the Federal Reserve Board. All errors and omissions are our own responsibility. The views expressed in this paper are solely the responsibility of the authors and should not be interpreted as reflecting the views of the Board of Governors of the Federal Reserve System or of anyone else associated with the Federal Reserve System. Return to text
2. Data on real GDP from Haver Analytics covering Argentina, Australia, Austria, Belgium, Brazil, Canada, Chile, China, Colombia, Costa Rica, Czech Republic, Denmark, Ecuador, Estonia, Finland, France, Germany, Greece, Hong Kong, Hungary, Iceland, India, Indonesia, Ireland, Israel, Italy, Japan, Jordan, Latvia, Lithuania, Luxembourg, Malaysia, Mexico, Netherlands, New Zealand, Norway, Peru, Philippines, Poland, Portugal, Russia, Singapore, Slovakia, Slovenia, South Africa, South Korea, Spain, Sweden, Switzerland, Taiwan, Thailand, Turkey, United Kingdom, United States, Uruguay, Venezuela. Designation of advanced economies follows the IMF, https://www.imf.org/external/pubs/ft/weo/2021/01/weodata/groups.htm. Return to text
3. Recessions are identified following the Bry-Boschen procedure for quarterly data, requiring at least two quarters from peak to trough and four quarters from a trough to peak. Return to text
4. We define as "severe" those recessions in which GDP declines at least 7 percent over two consecutive quarters, preceded by a quarter of positive growth. Return to text
5. Dates for financial crises come from the database of Luc Laeven and Fabian Valencia (2020), "Systemic Banking Crisis Database II," IMF Economic Review, vol. 68 (June), pp. 307-61. Return to text
6. We compute the pre-recession trend as the average growth from two to six years before each recession, as in Robert Martin, Teyanna Munyan, and Beth Anne Wilson (2015), "Potential Output and Recessions: Are We Fooling Ourselves? (PDF)" International Finance Discussion Papers 1145 (Washington: Board of Governors of the Federal Reserve System, September). Return to text
7. See, for example, Valerie Cerra and Sweta Chaman Saxena (2008), "Growth Dynamics: The Myth of Economic Recovery," American Economic Review, vol. 98 (March), pp. 439–57. Return to text
8. One important caveat is that there are only nine episodes of severe and short recessions in our sample (New Zealand in 1973, Greece in 1980 and 1990, Argentina in 1989, Mexico in 1994, Turkey in 1993 and 2001, Venezuela in 2001, and Iceland in 2008). Return to text
9. The average peak-to-trough GDP decline in the 69 overshooting recoveries was about 3 percent. Return to text
10. The five overshooting episodes following severe recessions reflect the experiences of small countries whose fast recoveries were partly due to large increases in external funding (New Zealand in 1973, Argentina in 1989, Turkey in 1993, and Uruguay in 2002), or soaring commodity prices (Venezuela in 2001). Return to text
11. Anecdotal evidence suggests that part of the decline in bankruptcies might also been due to the difficulty in accessing the court system during the pandemic. Return to text
12. See, for example, Alistair Dieppe, Sinem Kilic Celik, and Cedric Okou (2020), "Implications of Major Adverse Events on Productivity (PDF)," Policy Research Working Paper 9411 (Washington: World Bank Group, September); or Albert Queralto (2020), "A Model of Slow Recoveries from Financial Crises," Journal of Monetary Economics, vol. 114 (October), pp. 1–25. Return to text
13. The Organisation for Economic Co-operation and Development projects average labor productivity to slowly return to trend from its level in the third quarter of 2020, well outperforming the path following severe recessions; see Organisation for Economic Co-operation and Development (2021), "Labour Productivity Forecast," indicator (accessed March 2, 2021). Return to text
14. See, for example, Nicholas Bloom, Philip Bunn, Paul Mizen, Pawel Smietanka, and Gregory Thwaites (2020), "The Impact of Covid-19 on Productivity," NBER Working Paper Series 28233 (Cambridge, Mass.: National Bureau of Economic Research, December). Return to text
15. See, for example, Jose Maria Barrero, Nicholas Bloom, and Steven J. Davis (2020), "Why Working from Home Will Stick (PDF)," BFI Working Paper 2020-174 (Chicago: Becker Friedman Institute for Economics at the University of Chicago, December). Return to text
Caldara, Dario, Matthew DeHaven, Francesco Ferrante, and Matteo Iacoviello (2021). "The Global Recovery: Lessons from the Past," FEDS Notes. Washington: Board of Governors of the Federal Reserve System, June 22, 2021, https://doi.org/10.17016/2380-7172.2931.
Disclaimer: FEDS Notes are articles in which Board staff offer their own views and present analysis on a range of topics in economics and finance. These articles are shorter and less technically oriented than FEDS Working Papers and IFDP papers.