FEDS Notes
May 06, 2022
The Remarkable Recent Rebound in Household Formation and the Prospects for Future Housing Demand
Daniel García and Andrew Paciorek
This note updates our previous work on household formation and living arrangements from the summer of 2020. At that early stage in the pandemic, the data showed a dramatic decline in headship rates as millions of Americans changed their living arrangements, many by remaining with or moving back in with parents and older relatives.1 These changes were particularly large among young adults, Black adults, and those without a college education. As shown in figure 1 below, the changes in 2020 were on the same order of magnitude as those driven by the Great Recession. The effects of the Great Recession proved to be highly persistent, with the headship rate (the left panel) remaining a full percentage point below early-2000s levels, largely because the fraction of people living with adult family members who are not their spouses (e.g., their parents) increased by about two percentage points—the equivalent of several million adults.2
In contrast, over the past year and a half there has been a remarkable rebound in the headship rate, driven in large part by a return to the pre-pandemic rates at which younger adults lived with parents or older family members. This rebound has been an important contributor to a huge increase in housing demand. From the end of 2019 through March 2022, real market rents and house prices have soared to record highs, even as permits for new residential construction have risen to their highest level since 2006.3
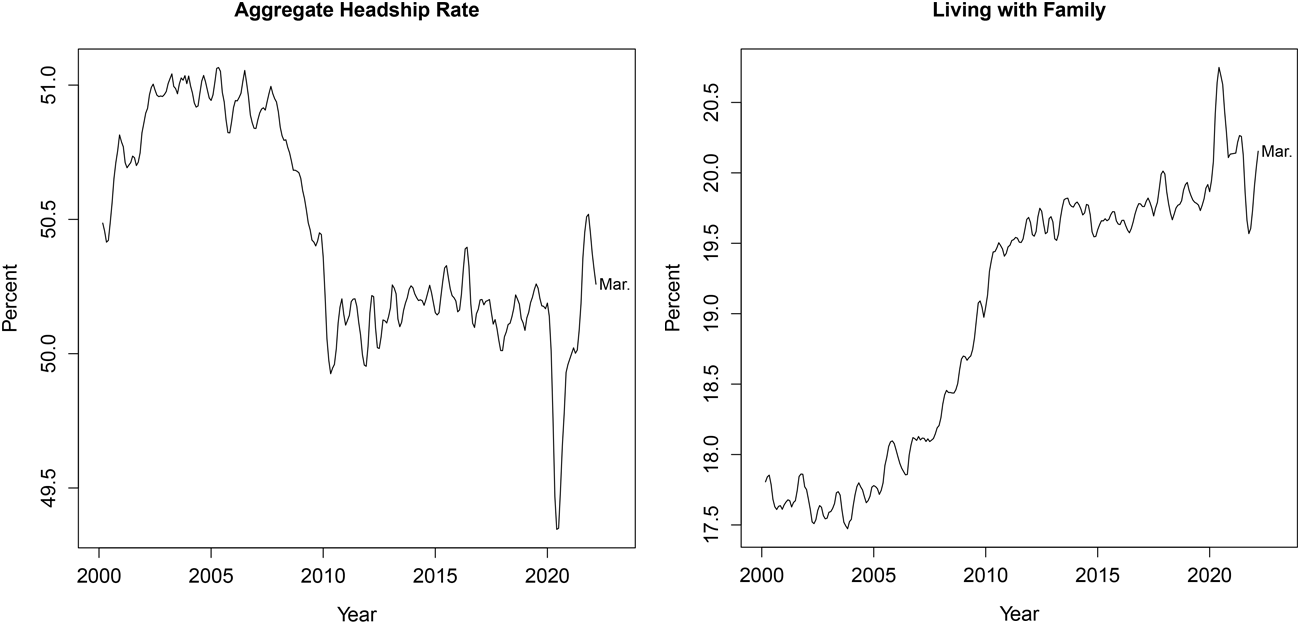
Note: Three-month moving averages. Estimates for people age 16 and up.
Source: CPS microdata and authors' calculations.
We can better understand the patterns in the headship rate by digging further into the underlying changes in behavior. Figure 2 plots changes since December 2019 in the composition of living arrangements, such as the fraction of adults living with a spouse or partner.4 At the onset of the pandemic, many adults living alone or with roommates quickly adapted by moving in with older family members or with a spouse or partner. In addition, the pandemic may have led some who were living with family members or spouses to delay moving out. Over time, some of these abrupt changes in the composition of living arrangements have gradually receded. Recently, the fraction of adults living with family and the fraction living with a spouse or partner have both returned to similar levels as prior to the pandemic. However, in perhaps a new development related to the pandemic, relatively fewer adults are living with roommates and more living alone, which boosts the headship rate, all else equal.
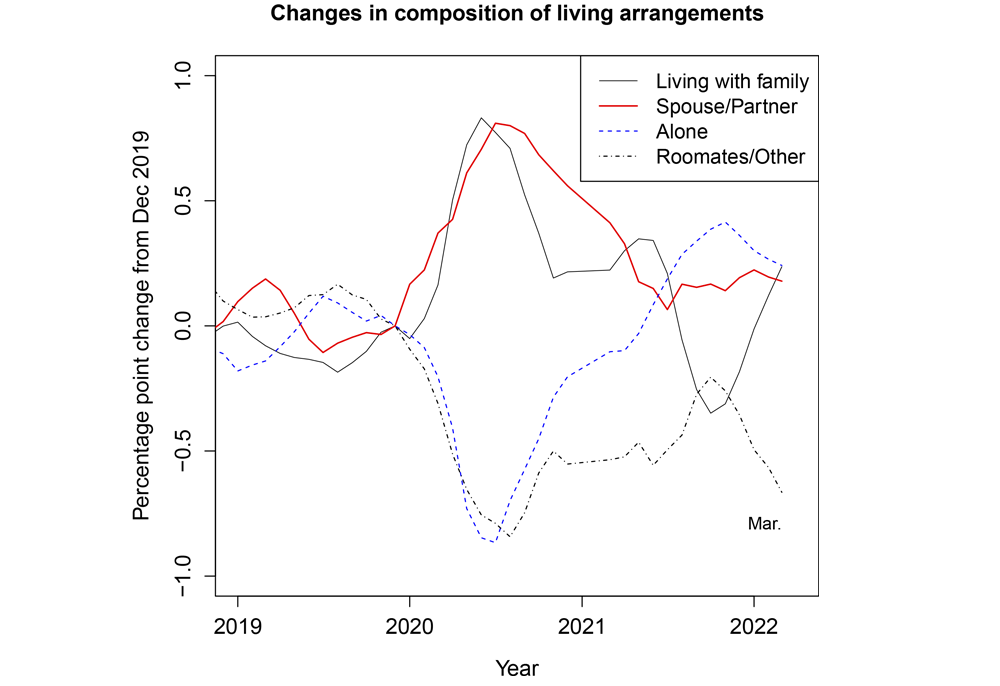
Note: Three-month moving averages. Estimates for people age 16 and up. Sum of changes in composition may not add to zero due to averaging and seasonal adjustment.
Source: CPS microdata and authors' calculations.
The fall and rebound in the aggregate headship rate masks differences in headship rates across demographic groups, both across race and ethnicity (the left panel of figure 3) and age groups (the right panel). At the onset of the pandemic, the fall in headship rates for non-whites was particularly sharp, consistent with the disparate effects of the pandemic across racial groups.5 Since then, headship rates have gradually rebounded across racial groups, although more so for whites, who are now more likely to live alone or with a spouse or partner than prior to the pandemic, and thus have a higher headship rate.
The right panel of figure 3 shows substantial differences in the evolution of headship rates by age groups since the beginning of the pandemic. The initial plunge was especially sharp for younger adults aged 16-30 (the solid black line), who partly adapted by moving in with (or staying for longer with) older relatives. Many of those changes proved transitory, and the headship rate for young adults ages 16-30 quickly retraced a good portion of the initial plunge. Still, headship for this group is yet to recover to the pre-pandemic rate. For Americans older than 64, headship rates remain a bit lower than before the pandemic but have moved up over the last six months or so. Meanwhile, headship rates for adults ages 31-64, who account for about 60 percent of the adult population, have been relatively resilient throughout.
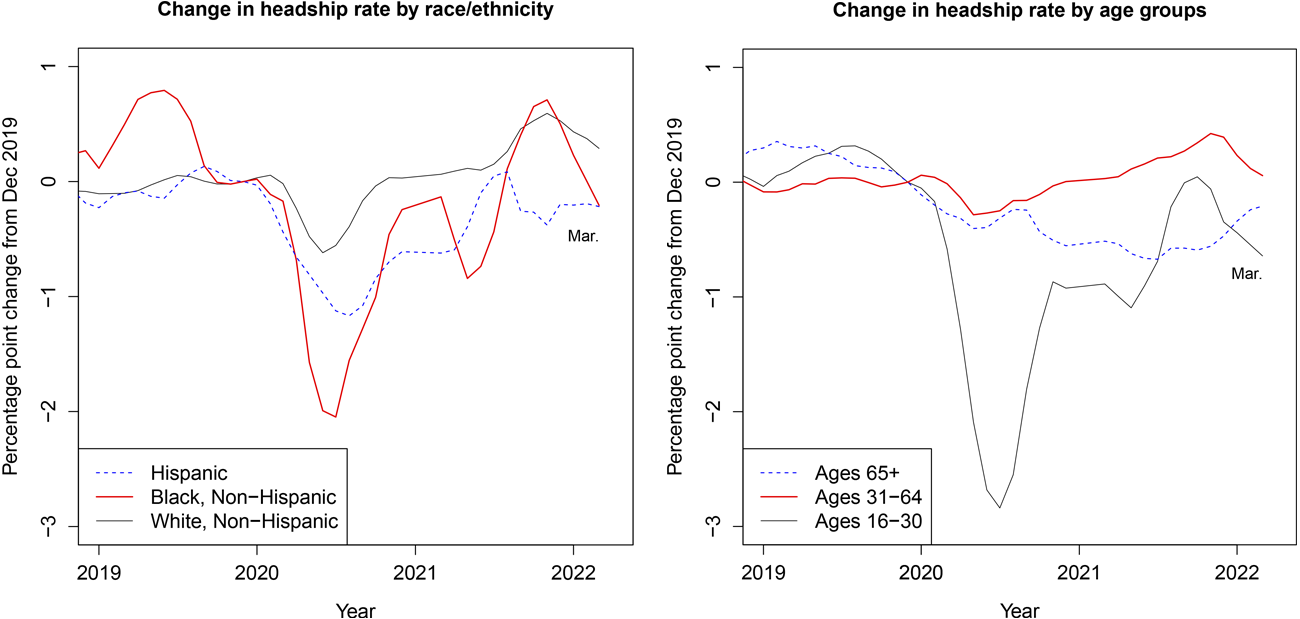
Note: Three-month moving averages. Estimates for people age 16 and up.
Source: CPS microdata and authors' calculations.
The ongoing recovery in the labor market has likely contributed to the rebound in headship rates, given that the employed typically have higher headship rates than the non-employed.6 While we do not try to establish a causal relationship between employment and headship, we do perform a decomposition exercise to give a sense of the patterns in the data. We focus on the prime-age population (ages 25-54) to abstract from confounding factors such as education and retirement. The left panel of figure 4 shows that headship rates in 2019 were about 5 percentage points higher among the employed than among the non-employed. In the early months of the pandemic, the headship rate for non-employed individuals declined somewhat, but this shift accounted for only a small portion of the decline in the headship rate for this group.
Instead, the huge fall and recovery in employment itself (right panel) has been a larger contributor to the swing in the headship rate. From February to April 2020, the 10-percentage point drop in the employed share of the population mechanically implied a decline of about 1/2 percentage point in the headship rate—near the full decline in headship rate for this group. More recently, both the headship and employment-to-population rates have been roughly in line with their pre-pandemic levels.
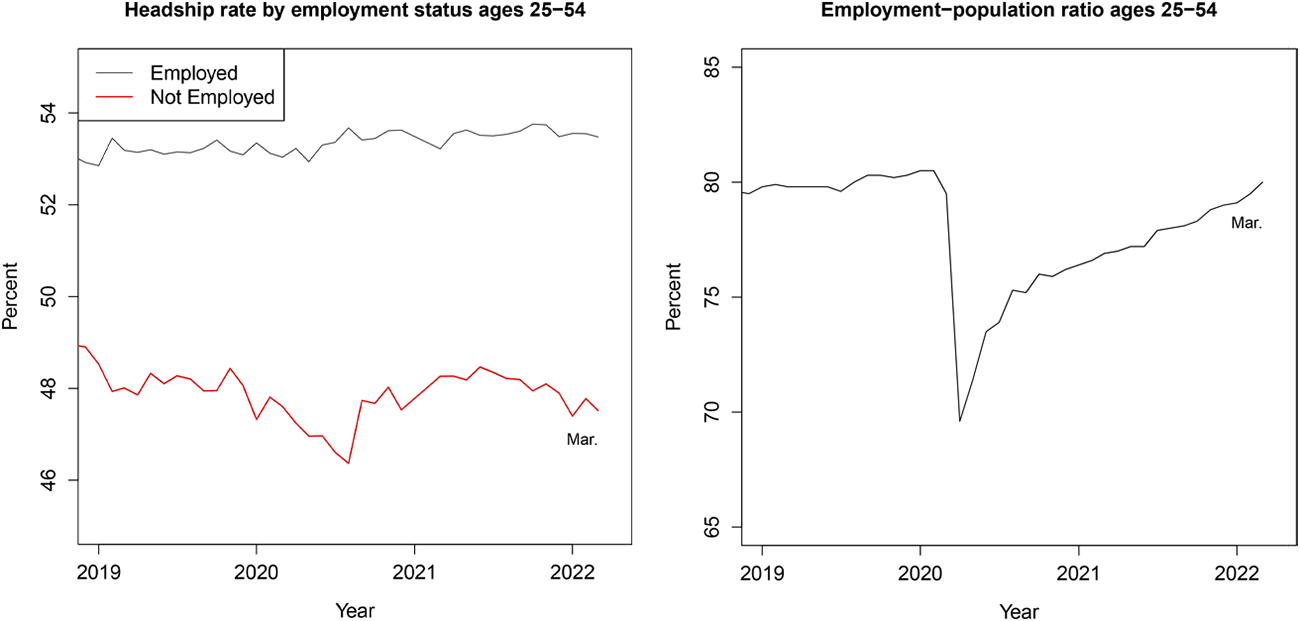
Note: Estimates for people age 16 and up.
Source: CPS microdata, authors' calculations, and BLS retrieved from FRED.
Looking ahead, headship rates might continue to climb given the strength of the labor market and as a result of pandemic-driven adaptations in how and where people prefer to live. Taking a longer view, however, any boost to housing demand from this behavioral channel may be outweighed by the weakening of U.S. population growth. As shown by the black line in the left panel in figure 5, from 2010 to 2016 the number of adults in the U.S. grew by 2.3 million per year, on average, very close to the average pace seen over the prior three decades. Since 2016, however, population growth has slowed markedly, down to a pace of roughly 1.5 million in 2021, largely because of a reduction in net international immigration. The most recent baseline projection for population growth from the Census Bureau, from 2017 (the red line), called for only a modest slowing in population growth through 2030. Actual growth has so far come in far below that estimate, and during the pandemic it even fell below the Census Bureau's "low immigration" scenario (the dashed blue line). Indeed, population growth in 2020-2021 fell about halfway between that scenario and an even more extreme "zero immigration" scenario (the dotted blue line).
While the trajectories of immigration and population growth coming out of the pandemic are highly uncertain, their implications for housing demand are crucial. The right panel below shows the levels of the adult U.S. population (the black line) and the three Census Bureau projections. Had the slowdown in immigration after 2016 not occurred, the adult population would have been expected to rise to about 288 million in 2030. Under the low-immigration projection (the blue dashed line), which has already itself proven a bit too optimistic, the adult population in 2030 would be about 5 1/2 million lower. That reduction would imply roughly 2 3/4 million fewer households at the current headship rate, which in turn would imply much less housing construction, a much higher number of vacant units, or some combination of the two. Of course, even lower levels of population growth that fall closer to the zero-immigration trend would imply an even larger reduction in housing demand.
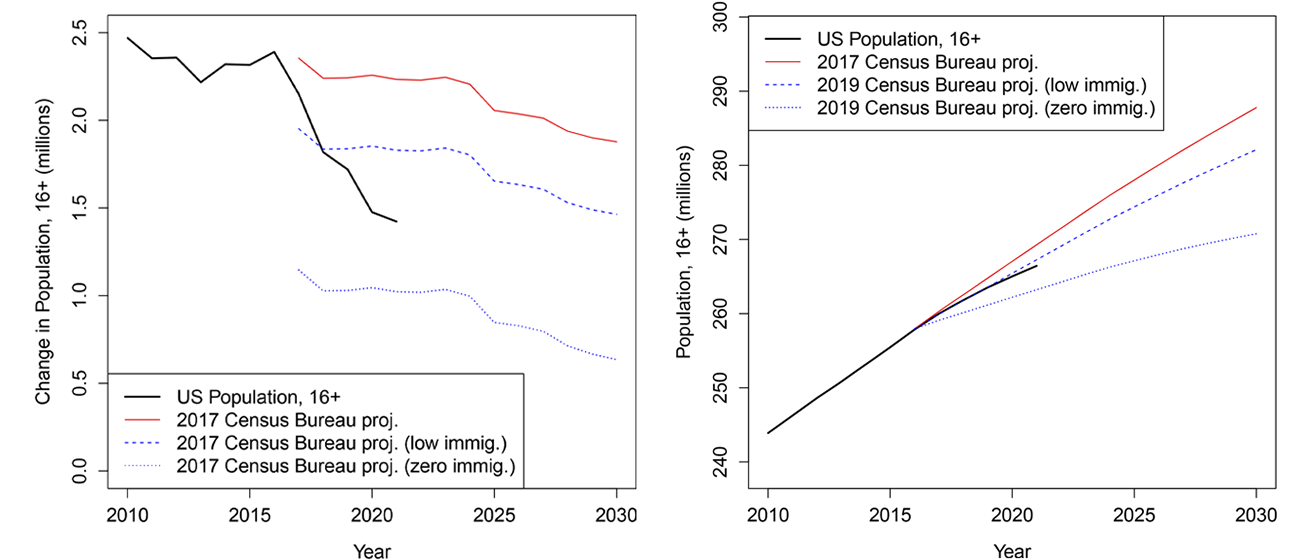
Source: Census Bureau population estimates and projections, CPS microdata, and authors' calculations.
Bibliography
Bitler, Marianne, and Hilary Hoynes. 2016. "Living Arrangements, Doubling Up, and the Great Recession: Was This Time Different?" American Economic Review 105 (5): 166-70.
Ermisch, John. 1999. "Prices, Parents, and Young People's Household Formation" Journal of Urban Economics 45(1): 47-71.
Kaplan, Greg. 2012. "Moving Back Home: Insurance against Labor Market Risk. Journal of Political Economy 120(3): 446–512.
Lee, Kwan Ok, and Gary Painter. 2013. "What Happens to Household Formation in a Recession?" Journal of Urban Economics 76: 93-109.
Paciorek, Andrew. 2016. "The Long and the Short of Household Formation." Real Estate Economics 44(1): 7-40.
U.S. Census Bureau. Current Population Survey.
1. As we discussed in our previous note, the aggregate headship rate is defined as the ratio of the number of households—or, equivalently, the number of occupied housing units—to the number of adults in the US population. The headship rate reflects a variety of choices made by adults in determining where and with whom they live, including whether to live with their parents, whether to get married or form a domestic partnership, and whether to live with roommates. Movements in the headship rate reflect both long-run factors like demographic changes and housing costs, as well as shorter-run fluctuations, such as the business cycle (Lee and Painter 2013, Paciorek 2016). Return to text
2. As in our previous note, we define an individual as living "with family" if she lives with a family member who is the CPS respondent for a household and is not her spouse. Using this definition, in 2019, more than 70 percent of those living with family lived with a parent or grandparent, 12 percent with a child, 7 percent with a sibling, and the remainder with other family members. Return to text
3. As is evident in the left panel of figure 1, the headship rate rebounded so sharply that it appreciably exceeded its pre-pandemic level in the second half of 2021 before falling back again in early 2022, as the percentage of adults living with family moved back up. This pattern could reflect the Omicron wave of COVID-19, noise in the data similar to what was seen over the prior decade, or other factors. Return to text
4. The interpretation of figures 1 and 2 may be complicated somewhat by swings in Current Population Survey response rates during the pandemic. Starting in March 2020, response rates fell sharply as the Census Bureau suspended in-person interviewing. Although response rates recovered late in 2020 as in-person visits resumed, they are still well below pre-pandemic levels, as shown on the BLS response rate page. It is likely that this additional non-response was nonrandom, and it could bias estimates of headship and household formation if changes in response rates were correlated with household types. In general, however, our interpretation of the data from the CPS itself is that the timing of the patterns we observe do not closely align with swings in response rates. In contrast, data on households and homeownership rates from the Housing Vacancy Survey (HVS), which is done as a follow-on to the CPS when a unit is identified as vacant, appear to have been substantially distorted by nonresponse. See Spader et al. (2021). Return to text
5. We show changes in headship rates since December 2019 because the levels reflect various longstanding differences across groups. For example, on average, Hispanics have lower headship rates than either whites or Blacks, because they are both more likely to live with family than whites and are more likely to be married or in a partnership (and less likely to be single) than Blacks. Return to text
6. Previous studies find that changes in employment status, and the ability to move in with family as an insurance mechanism, are a key driver of changes in living arrangements (Bitler and Hoynes 2015, Kaplan 2012, Ermisch 1999). Return to text
García, Daniel, and Andrew Paciorek (2022). "The Remarkable Recent Rebound in Household Formation and the Prospects for Future Housing Demand," FEDS Notes. Washington: Board of Governors of the Federal Reserve System, May 06, 2022, https://doi.org/10.17016/2380-7172.3114.
Disclaimer: FEDS Notes are articles in which Board staff offer their own views and present analysis on a range of topics in economics and finance. These articles are shorter and less technically oriented than FEDS Working Papers and IFDP papers.