FEDS Notes
June 25, 2019
Understanding Changes in Household Debt by Credit Risk Category: The Role of Credit Score Transitions
Sarena Goodman and Steve Ramos1
The discussion of household debt in the Federal Reserve Board's 2018 Financial Stability Report led with a figure showing outstanding debt balances over time for borrowers belonging to one of three credit risk categories—prime, near-prime, and subprime (reproduced in figure 1).2 The report emphasized that all of the net rise in aggregate debt owed by households over the past several years has accrued to borrowers with prime credit scores, indicating a reduction in credit risk for the financial system. Still, with respect to credit availability (which was not the subject of the report), the flat aggregate debt balances for the other two categories over this period are somewhat surprising in light of the considerable improvement in the macroeconomic environment and general relaxation in lending standards—particularly for mortgages, which represent the majority of household debt—that appear to have taken place. This type of macroeconomic and financial environment might have been expected to result in rising credit volumes, particularly among borrowers with lower credit scores, whom we consider to be very responsive to expansions in credit supply.
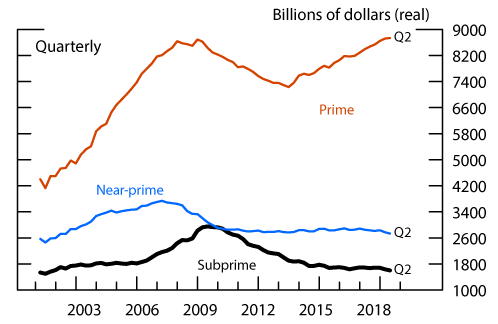
Note: Prime have scores greater than 719; near-prime are borrowers with an Equifax Risk Score from 620 to 719. Scores are measured contemporaneously. Student loan balances prior to 2004 were estimated. The data are converted to constant 2018:Q2 dollars using the consumer price index.
Source: FRBNY CCP/Equifax; Bureau of Labor Statistics consumer price index.
However, changes in total loan balances for the credit risk categories reflect not only new borrowing, loan paydowns, and charge-offs for people with relatively stable scores, but also the migration of borrowers (and their corresponding debt) between the different categories. One possibility is that strong macroeconomic performance and considerable job gains, among other factors, have resulted in stronger financial positions and rising credit scores, allowing a sizable share of borrowers to move into the prime risk category.3 In this case, relaxed lending standards may have allowed near-prime and subprime borrowers to increase their debt balances, even if that activity was obscured in the figure by the shrinking shares of borrowers in those categories.
This note analyzes the individual credit records from the FRBNY Consumer Credit Panel/Equifax (CCP) to better understand the extent to which the migration of borrowers between risk categories has contributed to recent evolutions in debt balances by category, focusing on changes during the past few years.
Specifically, we find that between 2015:Q2 and 2018:Q2:
- There was a sizable upward shift in the distribution of borrowers' credit scores that pushed the fraction of borrowers in the prime credit score range in 2018 to its highest level since 2001 and the fraction of subprime borrowers to the bottom of its range over this period;
- The lion's share of the steady and sizable increase in total debt owed by borrowers with prime credit scores over the three years reflects a steady net migration of borrowers into the highest score category from the near-prime category. Net borrowing was slightly negative among both those with prime scores in 2015:Q2 and the subset who remained prime-scored over the interval;
- Almost all of the net borrowing over the three years was among individuals whose credit scores were in the near-prime category in 2015:Q2—split about equally between those whose scores were still near-prime in 2018:Q2 and those who subsequently moved up to the prime category. Those whose scores were in the subprime category in 2015:Q2 were net borrowers as well, but this group's contribution to aggregate debt growth was negligible.
These findings materially affect the interpretation of figure 1. Indeed, they imply that a broad upward migration in credit scores in recent years has been a quantitatively important part of the story behind the improvement in the underlying portfolio of household debt. That is, it is not that prime-scored borrowers significantly increased their debt balances in recent years, but rather that millions of borrowers improved their financial positions sufficiently to have raised their scores to prime. Moreover, the concentration of the increase in aggregate household debt over the past three years in the prime category fully reflects the (contemporaneous) timing at which borrowers' scores are measured and does not imply that credit was only being supplied to prime-scored borrowers over this window.
Transitions between credit risk categories among borrowers
A credit score is intended to predict a borrower's risk of default, subject to how a proprietary scoring model interprets the information in the person's credit report.4 Thus, a borrower's credit score can change quarter to quarter as this information evolves. For example, borrowers with subprime credit scores that then see substantial improvements in their credit records—such as more consistent repayment histories and reduced credit utilization rates—can migrate to a category indicating lower credit risk.
Thus, amid improving macroeconomic conditions, the distribution of credit scores might shift up. Indeed, recent years have seen upward migrations in scores that have substantially outnumbered downward migrations, with, as can be seen in figure 2, the share of borrowers with prime credit scores, on average, rising one percentage point per year in each of the past three years and the share of borrowers in the near-prime and subprime categories each falling about ½ percentage point per year. In mid-2018, the shares of prime- and subprime-scored borrowers were at their highest and lowest levels, respectively, since 2001.
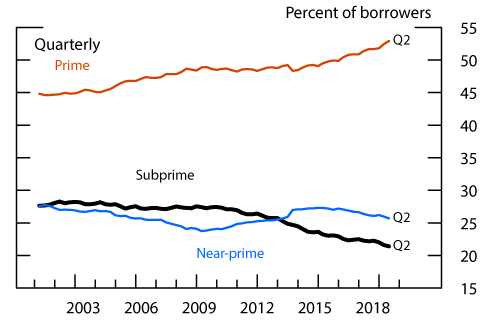
Note: Share of individuals in FRBNY CCP/Equifax panel with indicated risk scores. Prime have scores greater than 719; near-prime are borrowers with an Equifax Risk Score from 620 to 719. Scores are measured contemporaneously.
Source: FRBNY CCP/Equifax.
Table 1 tabulates borrowers in each credit risk category based on their category four quarters prior in 2016, 2017, and 2018.5 Rows 1b and 2a in the left panel, respectively, illustrate that, from 2017:Q2 to 2018:Q2, 11.6 million borrowers moved from the near-prime to the prime credit score category while only 5.6 million borrowers saw their scores fall from prime to near-prime, generating a sizable net increase in the number of prime-scored borrowers over this window.6 Indeed, nearly 10 percent of prime-rated borrowers in 2018:Q2 had near-prime credit scores four quarters earlier. Meanwhile, rows 2c and 3b in the left panel imply a decrease in the number of subprime-scored borrowers—around 9 million borrowers moved from subprime to near-prime, while about 7 million borrowers moved from near-prime to subprime—over the same four quarters.
Table 1: Decomposition of Borrowers in Each Credit Score Category by Prior-Year Category
| 2018:Q2 | 2017:Q2 | 2016:Q2 | Average | |||||
|---|---|---|---|---|---|---|---|---|
| Millions | Percent | Millions | Percent | Millions | Percent | Millions | Percent | |
| 1 Prime-rated borrowers | 121.6 | 52.9% | 117.8 | 51.6% | 114.8 | 50.8% | ||
| Category four quarters prior | ||||||||
| a Prime | 108.8 | 89.5% | 106.0 | 90.0% | 103.1 | 89.8% | 106.0 | 89.8% |
| b Near prime | 11.6 | 9.5% | 10.7 | 9.1% | 10.6 | 9.2% | 10.9 | 9.3% |
| c Subprime | 0.2 | 0.2% | 0.1 | 0.1% | 0.2 | 0.2% | 0.2 | 0.2% |
| d Score missing | 1.0 | 0.8% | 0.8 | 0.7% | 0.9 | 0.8% | 0.9 | 0.8% |
| 2 Near-prime-rated borrowers | 59.1 | 25.7% | 59.7 | 26.2% | 60.8 | 26.9% | ||
| Category four quarters prior | ||||||||
| a Prime | 5.6 | 9.5% | 5.7 | 9.6% | 5.5 | 9.0% | 5.6 | 9.4% |
| b Near prime | 39.4 | 66.6% | 40.5 | 67.8% | 41.0 | 67.4% | 40.3 | 67.3% |
| c Subprime | 9.2 | 15.6% | 8.5 | 14.3% | 9.2 | 15.2% | 9.0 | 15.0% |
| d Score missing | 4.9 | 8.3% | 5.0 | 8.3% | 5.1 | 8.4% | 5.0 | 8.3% |
| 3 Subprime-rated borrowers | 49.2 | 21.4% | 50.6 | 22.2% | 50.4 | 22.3% | ||
| Category four quarters prior | ||||||||
| a Prime | 0.5 | 1.1% | 0.6 | 1.1% | 0.5 | 1.0% | 0.5 | 1.1% |
| b Near prime | 7.0 | 14.3% | 7.7 | 15.3% | 7.4 | 14.7% | 7.4 | 14.8% |
| c Subprime | 39.7 | 80.6% | 40.0 | 79.1% | 40.1 | 79.5% | 39.9 | 79.7% |
| d Score missing | 2.0 | 4.1% | 2.3 | 4.5% | 2.4 | 4.8% | 2.2 | 4.5% |
Note: Prime have Equifax Risk Scores above 720; near-prime have scores from 620 to 719; subprime have scores below 620. Totals may not sum due to rounding.
Source: Authors' calculations from FRBNY CCP/Equifax data.
More broadly, the table illustrates that, on net, a steady and substantial number of borrowers moved from the near-prime risk category into the prime category in each of the past three years and, while somewhat more variable in size, a persistent number of borrowers flowed from subprime into near-prime, altogether pointing to a considerable improvement in households' overall financial positions and a material reduction in their underlying credit risk in recent years.7 As such, the concurrent rise in loan balances owed by borrowers with prime credit scores could very well be driven by the net migration of millions of borrowers into the prime category bringing their existing debt with them (as opposed to steady net borrowing by those with stable prime-rated scores). Moreover, the flat loan balances for the near-prime and subprime categories could be masking increased loan balances among the shrinking shares of borrowers remaining in these categories in recent years. The remainder of the analysis examines these possibilities.
Decomposing recent changes in household debt by risk category and overall
Table 2 examines changes in borrowers' credit scores and debt over the past three years. The top rows (1 and 2 of panel A) show how the number of borrowers in each credit score category and their debt balances changed between 2015:Q2 and 2018:Q2. These tabulations are based on contemporaneous credit scores and so correspond to the data shown in figures 1 and 2. In this three-year period, the number of prime-scored borrowers rose by about 10 million and prime-scored debt increased more than $900 billion (in real terms). Total household debt increased just $735 billion over this period, as debt owed by borrowers with near-prime and subprime credit scores decreased $98 billion and $75 billion, respectively.
Table 2: 3-Year Changes in Borrowers and Debt Balances in Each Score Category (2015:Q2-2018:Q2)
| Prime | Near-prime | Subprime | Total | |
|---|---|---|---|---|
| A Changes by category, 2015:Q2 to 2018:Q2 | ||||
| 1 Borrowers (Millions) | 10.2 | -1.9 | -2.4 | 5.9 |
| 2 Debt balances ($ Billions) | 908.7 | -98.0 | -75.4 | 735.3 |
| a Migration into category | 1,562.8 | 1,180.6 | 606.4 | |
| from prime | -- | 445.8 | 83.0 | |
| from near-prime | 1,444.4 | -- | 483.2 | |
| from subprime | 66.4 | 630.6 | -- | |
| from missing | 52.1 | 104.2 | 40.2 | |
| b Migration out of category (residual) | -601.6 | -1,575.0 | -718.7 | |
| c Among borrowers in category
|
-52.5
|
296.3
|
36.9
|
|
| B Net borrowing by 2015:Q2 category ($ Billions) | -39.5 | 691.9 | 50.3 | 702.7 |
| 1 Prime-scored in 2018:Q2 | -52.5 | 319.6 | 3.0 | 270.1 |
| 2 Near-prime-scored in 2018:Q2 | 8.2 | 296.3 | 10.4 | 315.0 |
| 3 Subprime-scored in 2018:Q2 | 4.7 | 76.0 | 36.9 | 117.6 |
Note: Changes in debt balances are in real terms and, except for out-migration (which are calculated as residuals), are the difference between the current quarter level and that measured twelve quarters prior for each group. Net borrowing calculations exclude borrowers unscored in either 2015:Q2 or 2018:Q2. Totals may not sum due to rounding.
Source: Authors' calculations from FRBNY CCP/Equifax data.
The rest of panel A decomposes the 12-quarter changes in debt balances by score category into the debt held by those migrating into the category, the debt held by those migrating out of the category, and net borrowing among individuals scored in the same category 12 quarters prior. Cutting the data this way reveals that all of the debt growth in the prime category over the past three years was driven by an in-migration of debt from borrowers who were scored near-prime in 2015:Q2 (row 2a plus row 2b), with debt, on net, shrinking among those who were prime in both 2015:Q2 and 2018:Q2 (row 2c). On the other hand, score improvements appear to have led to a net migration of debt out of the near-prime category (row 2a plus row 2b), even though those who were near-prime in both 2015:Q2 and 2018:Q2 saw net growth in their loan balances (row 2c). This increase—which is completely obscured in figure 1 by migratory debt flows—likely reflects rising demand for credit among these borrowers in the context of improving macroeconomic and financial conditions and a general increase in the supply of credit. Finally, though the volumes are smaller, those who were subprime-scored in both 2015:Q2 and 2018:Q2 also, on net, grew their balances (row 2c) and debt similarly migrated out of the category (row 2a plus row 2b).
Panel B in the table decomposes the recent three-year rise in total household debt based on borrowers' risk categories at the beginning of the period—that is, in 2015:Q2. (Note that in order to do this accounting exercise, we analyze the subset of borrowers in 2018:Q2 who also were scored in 2015:Q2, which, together, saw 96 percent of the aggregate increase in debt.) The topline exercise (row B) shows that almost all of the increase in total debt over the past three years accrued to borrowers whose scores were in the near-prime category in 2015:Q2. Such borrowers increased their loan balances by more than $690 billion, on net, while balances among borrowers who were initially subprime scored increased just $50 billion and balances among borrowers who were initially prime scored decreased $40 billion. The next rows break these figures down based on borrowers' score categories in 2018:Q2. In particular, rows 1 and 2 show a fairly even split in the large rise in debt balances among borrowers who were initially near-prime scored between those who remained near-prime in 2018:Q2 ($296 billion) and those whose scores rose to prime ($320 billion).
So, what have we learned from these decompositions? Primarily, that the net borrowing volumes in panel B, which are based on initial credit scores (in 2015:Q2), bear virtually no resemblance to the changes in debt shown in panel A, which are based on contemporaneously measured scores. The large (and steady) climb in prime-scored debt in recent years evident in figure 1 is not the result of new borrowing by people with stable prime credit scores. It is instead driven by the millions of borrowers that were initially near-prime a few years ago bringing their existing balances with them and, to a lesser but still noticeable extent, taking on new debt, as they migrated into the prime category. Indeed, nearly all of the increase in aggregate debt over the past three years accrued to individuals whose scores were initially in the near-prime category. In fact, borrowers with stable near-prime credit scores increased their balances nearly on par with those who migrated up to the prime category, but this activity has been obscured by the large volumes of debt migrating in and out of the category. Finally, a small amount of new debt in recent years accrued to borrowers who were subprime three years ago. While the majority of this debt belongs to those who remained subprime over the period, the overall out-migration of debt from this category, at several times its size, more than offset it.
Questions for future research
This initial analysis of credit score migrations raises several questions for future research.
First, it would seem useful to better understand the timing between the recent changes in near-prime borrowers' credit scores and their decisions/ability to take on additional debt. For example, has borrowing tended to precede or follow peoples' upward migrations of credit scores? Did near-prime borrowers tend to anticipate their increased financial wherewithal and take on additional debt before it was recognized in their scores, or did an increase in scores create an increased willingness or ability to take on more debt?
Second, can we better understand the economic and/or demographic factors that have generated such a large, ongoing improvement in credit scores over the past few years? For example, given that credit scores tend to rise over the life cycle, to what extent do these improvements reflect an aging population? And, how much can be accounted for by improving employment opportunities and other conditions in borrowers' local economies?
Third, how do the recent changes in the distribution of credit scores compare with the changes seen prior to, during, and in the immediate aftermath of the Financial Crisis and Great Recession? Have similar forces (with opposite directions) been evident recently, or do the credit score evolutions appear particularly distinct?
Fourth, how reliable are credit score migrations for predicting borrowers' ability to repay? That is, do recent changes in borrowers' credit scores have any predictive power for their prospective debt repayment rates, conditional on their current scores? Should debt balances for borrowers with recent increases in credit scores be considered more or less risky than those for borrowers with stable scores?
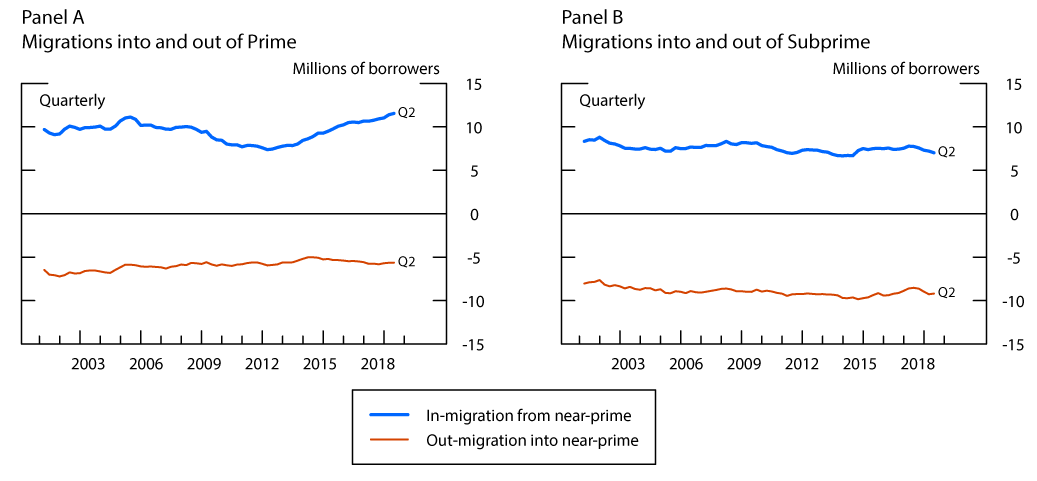
Note: Prime have scores greater than 719; near-prime are borrowers with an Equifax Risk Score from 620 to 719. Migrations are from four quarters earlier. Gross flows from subprime into prime average 0.141 million per year; gross flows from prime into subprime average 0.605 million per year.
Source: FRBNY CCP/Equifax.
1. The authors thank Michael Palumbo for creative and analytic contributions to this note. Return to text
2. For tracking potential vulnerabilities to systemic risk, the distinction among risk categories is relevant because of their substantial historical differences in debt repayment rates and the associated credit losses to lenders. The analysis in this note delineates these categories using the Equifax Risk Score that is included in the FRBNY/CCP data and thus may differ in its conclusions from one based on another credit score. In particular, the relationship between the Equifax Risk Score and the FICO (Fair Isaac Corporation) score that is relied upon by mortgage lenders to assess borrower risk does not appear to be static (Laufer and Paciorek, 2016). Note also that our credit score categories are grouped as follows: "prime" scores exceed 719; "near-prime" scores are between 620 and 719; "subprime" scores are below 620. Return to text
3. Another possibility, of course, is that the benefits of a strong economy have proved elusive to many people with lower credit scores who continue to struggle financially and have not experienced increased credit availability or have remained reluctant to take on more debt. Return to text
4. Discussions of how consumer credit scores are constructed by national credit rating agencies and used by lenders can be found in Report to the Congress on Credit Scoring and Its Effects on the Availability and Affordability of Credit (2007) and The Impact of Differences between Consumer-and Creditor-purchased Credit Scores: Report to Congress (2011). Return to text
5. Transitions into and out of the prime and subprime credit score categories over the full sample, 2001 to 2018, are shown in the two panels of the appendix figure at the end of this note. Return to text
6. Rows 1c and 3a show a small net migration of borrowers from the prime to subprime risk categories over the four quarters ending in 2018:Q2; there was also a small net migration to a missing score in the data that is not reported in the table. The number of borrowers with near-prime credit scores decreased only slightly over the four quarters ending in 2018:Q2 because the net inflow from the subprime category was just a little smaller than the net outflow to the prime category and because, on net, a lot of "new" borrowers—i.e., those with missing scores four quarters prior—entered the sample with near-prime credit scores. Return to text
7. Low delinquency rates on existing loan balances and other measures of loan performance for prime-scored debt in recent years favor a real improvement in underlying credit risk over, say, an aberration in scoring algorithms in explaining the upward migration of credit scores. That said, the risk of default associated with a given credit score can vary with overall economic conditions, such that delinquency rates conditional on credit scores tend to be lower than average under strong macroeconomic conditions and higher than average following economic downturns (VantageScore, 2016). As such, our analysis of the past three years likely yields relatively conservative estimates of improvements in "credit quality." Return to text
Goodman, Sarena, and Steve Ramos (2019). "Understanding Changes in Household Debt by Credit Risk Category: The Role of Credit Score Transitions," FEDS Notes. Washington: Board of Governors of the Federal Reserve System, June 25, 2019, https://doi.org/10.17016/2380-7172.2395.
Disclaimer: FEDS Notes are articles in which Board staff offer their own views and present analysis on a range of topics in economics and finance. These articles are shorter and less technically oriented than FEDS Working Papers and IFDP papers.