FEDS Notes
July 10, 2017
Trading Activities at Systemically Important Banks, Part 1: Recent Trends in Trading Performance
Diana Iercosan, Ashish Kumbhat, Michael Ng, and Jason Wu1
Executive summary
Trading and market-making activities are a key line of business for systemically important banks and are essential to the functioning of capital markets.2 These activities have undergone significant transformations since the financial crisis, as banks continue to adapt to an evolving macroeconomic and financial landscape, new regulatory standards, and investor expectations.3 Views on ways to assess the performance of banks' trading businesses have become more dispersed, as have forecasts for the future of such businesses given limited public disclosure on trading activities.4
Using a confidential data set collected daily by onsite supervisors, this note provides a comprehensive look at the performance of systemically important banks' trading and market-making activities since the financial crisis. The assessment of trading performance in each asset class is benchmarked against the market risk that banks took, as captured by their internal value-at-risk (VaR) estimates. Daily data on trading performance in various asset classes allow us to explore relationships in trading performance across banks and across asset classes, which is infeasible based on quarterly public reporting.5
Our main finding is that for the average bank, trading revenue per dollar of VaR committed has clearly trended up over the past six years, although trading performances in some asset classes were better than in others. Furthermore, the imprint of systematic factors on trading performance across banks has become smaller over time. Taken together, these findings suggest that since the financial crisis, banks have become more efficient in generating trading revenue across asset classes and, as a class of financial intermediaries, may have become more diversified in how trading revenue is generated.
In two companion FEDS Notes articles, "Trading Activities at Systemically Important Banks, Part 2: What Happened During Recent Risk Events?" and "Trading Activities at Systemically Important Banks, Part 3: What Drove Trading Performance?", we expand upon the analysis in this note using the same supervisory data to investigate, respectively, banks' trading performance during certain risk events, such as the "flash rally" in interest rate markets on October 15, 2014, and the drivers of trading performance, such as asset price changes and trading volumes.
Background on supervisory trading revenue and VaR data
Our analysis focuses on 13 systemically important domestic bank holding companies and foreign banking entities. Collectively, this group accounts for the vast majority of bank-intermediated trading activities in security and derivative markets relevant to U.S. investors.6 As part of continuous monitoring of these banks, onsite supervision teams from the Federal Reserve System regularly collect and review detailed information about the bank's performance and risk exposures (Eisenbach and others, 2017) through their management information systems (MIS). This collection constitutes the basis for the supervisory data we use in this note.
While the MIS information contains many other aspects of trading activities, two of the most important metrics utilized in continuous monitoring are trading revenue (also known as "profit and loss," or P&L) and one-day-ahead VaR.7 In addition to gains and losses on positions and inventory that result from market moves, trading-revenue data typically also capture gains from fees and commission associated with market-making activities and flow trading as well as any applicable interest payments from carrying a position.8 As retrieved from the MIS, trading revenue and VaR are typically captured in real time. The metrics have not been modified by valuation adjustments, such as those that pertain to financing costs, counterparty credit worthiness, or independent price verification. Free of the infrequent and often lengthy valuation adjustment process, these metrics are typically available on a daily basis and in a timely manner.
As banks are different in their types of business lines, trading desks, and risk exposures, onsite supervision teams collaborate with analytical staff at the Federal Reserve Bank of New York to organize trading revenue, VaR, and other MIS-based information in a consistent manner. Most notably, they stratify trading activities of each firm into several standard asset classes to facilitate comparisons across banks.9 In this note, we focus on five major asset classes that have the most complete data: credit, commodities, equities, foreign exchange, and rates, in addition to total trading revenue and total VaR on the overall trading book. Table 1 summarizes the availability of daily trading revenue and VaR data across these asset classes.
Table 1: Availability of daily trading revenue and VaR data
| Trading revenue | VaR | |||
|---|---|---|---|---|
| Number of banks reporting data | Average number of days reported | Number of banks reporting data | Average number of days reported | |
| Total | 13 | 1,552 | 11 | 1,462 |
| Commodities | 9 | 1,469 | 9 | 1,267 |
| Credit | 11 | 1,403 | 9 | 1,205 |
| Equity | 10 | 1,434 | 11 | 1,250 |
| Foreign exchange | 12 | 1,278 | 9 | 1,262 |
| Rates | 11 | 1,301 | 11 | 1,150 |
Source: Federal Reserve Bank of New York; Federal Reserve Board staff calculations.
The MIS data collection began in 2010; roughly six years of data is used in this note. As can be seen, not all banks' trading performances in each asset class are captured on each day, reflecting the fact that the MIS data collection occasionally encounters certain frictions, particularly at the beginning of the data collection period. There are also cases where banks reported either trading revenue or VaR, but not both. Federal Reserve System staff routinely work with the banks to ensure the accuracy of the data and eliminate entry errors. Indeed, they help identify and remediate certain types of data issues, while other types are eliminated over time by improvements in banks' MIS and risk-management capabilities. To further purge erroneous outliers in the data, for each bank and asset class, we winsorize both the daily trading revenue and the VaR data at their 0.5 and 99.5 percentiles.
Trends in trading performance
In the remainder of this note, we use VaR-adjusted trading revenue--defined as trading revenue on day t divided by the one-day-ahead VaR on day t−1--to proxy the trading performance of banks. This adjustment, or normalization, is necessary in order to facilitate comparisons of trading performance, because the dollar amounts of trading revenue differ substantially across banks and across asset classes. Furthermore, as VaR is an important component of market risk management (for example, trading desks and business lines often use VaR limits to constrain excessive risk taking), this normalization is a natural measure of trading performance because it accounts for revenue per dollar of market risk committed.
Importantly, we do not use observations on VaR-adjusted trading revenue to draw conclusions about the traditional bank earnings benchmark of return on equity, as the two do not coincide. Even though VaR forms the basis for market risk-based regulatory capital under the U.S. implementation of the Basel Accords, equity capital consumed by the trading business is a far more complex amalgamation of various other regulatory calculations, including risk-insensitive leverage ratios, stress-based calculations like the Basel 2.5 Stress VaR and Comprehensive Capital Analysis and Review, and liquidity ratios that constrain how trading businesses are funded. Therefore, VaR is not a proxy of the amount of bank equity capital required by the trading business--calculating the latter is infeasible at the frequency and asset-class granularity we are interested in. With this in mind, the following trends on trading performance highlight the evolving landscape of trading and market making.
Trading performance has improved at the average bank. As shown in figure 1, 60-day moving averages of the daily VaR-adjusted trading revenue for the average bank displayed clear upward trends over the past six years for all asset classes.10 In other words, banks commit less market risk in the process of generating trading revenue, in part reflecting lower levels of volatility in the market, which, all else being equal, lead to lower VaR. The average bank also generally has trading profits rather than trading losses, as evident by the fact that VaR-adjusted trading revenues are almost always above zero.
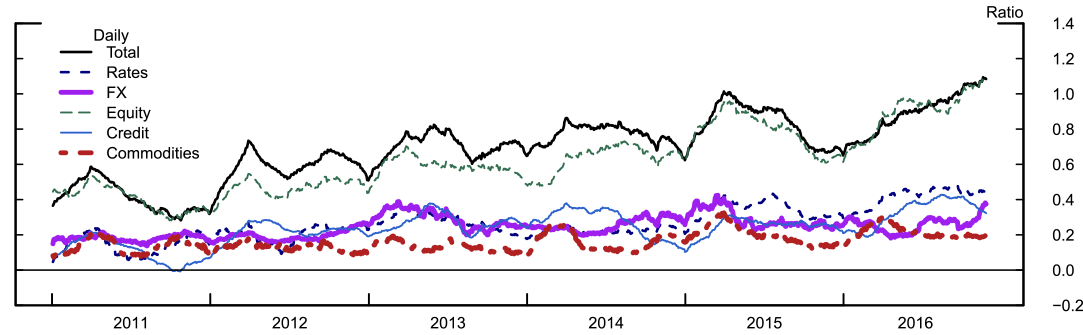
Note: 60-day moving average of the VaR-adjusted trading revenue (that is, trading revenue on day t divided by the one-day-ahead VaR on day t−1) for the average bank in each asset class.
Source: Federal Reserve Bank of New York; Federal Reserve Board staff calculations.
The trading performance of the average bank differs across asset classes: The VaR-adjusted trading revenue for foreign exchange, interest rates, commodities and credit trading, (which together constitute the "FICC" business) are generally lower than that for equities, which could explain why certain banks have devoted more resources to building up that business line over the past several years.11 Relatedly, as equities contribute the most to total trading revenue for the average bank, their trading performance co-moves the most with total trading performance. The VaR-adjusted total trading revenue is generally higher than VaR-adjusted revenue for individual asset classes, likely reflecting diversification benefits. Specifically, the denominator of VaR-adjusted trading revenue--total VaR--is often much smaller than the summation of VaRs across asset classes.
Trading performance has become less systematic across banks. The imprint of systematic factors on trading performance across banks can be evaluated using principal component analysis--for each asset class, principal components (PCs) extracted from the VaR-adjusted trading revenue of the panel of banks can be interpreted as systematic factors that influence all banks. The more these PCs explain the total variation across banks, the more the trading performance of banks is dependent on these systematic factors. For three two-year periods, Figure 2 shows the percentage of the total variance of VaR-adjusted trading revenue across banks that can be explained by the first two PCs.
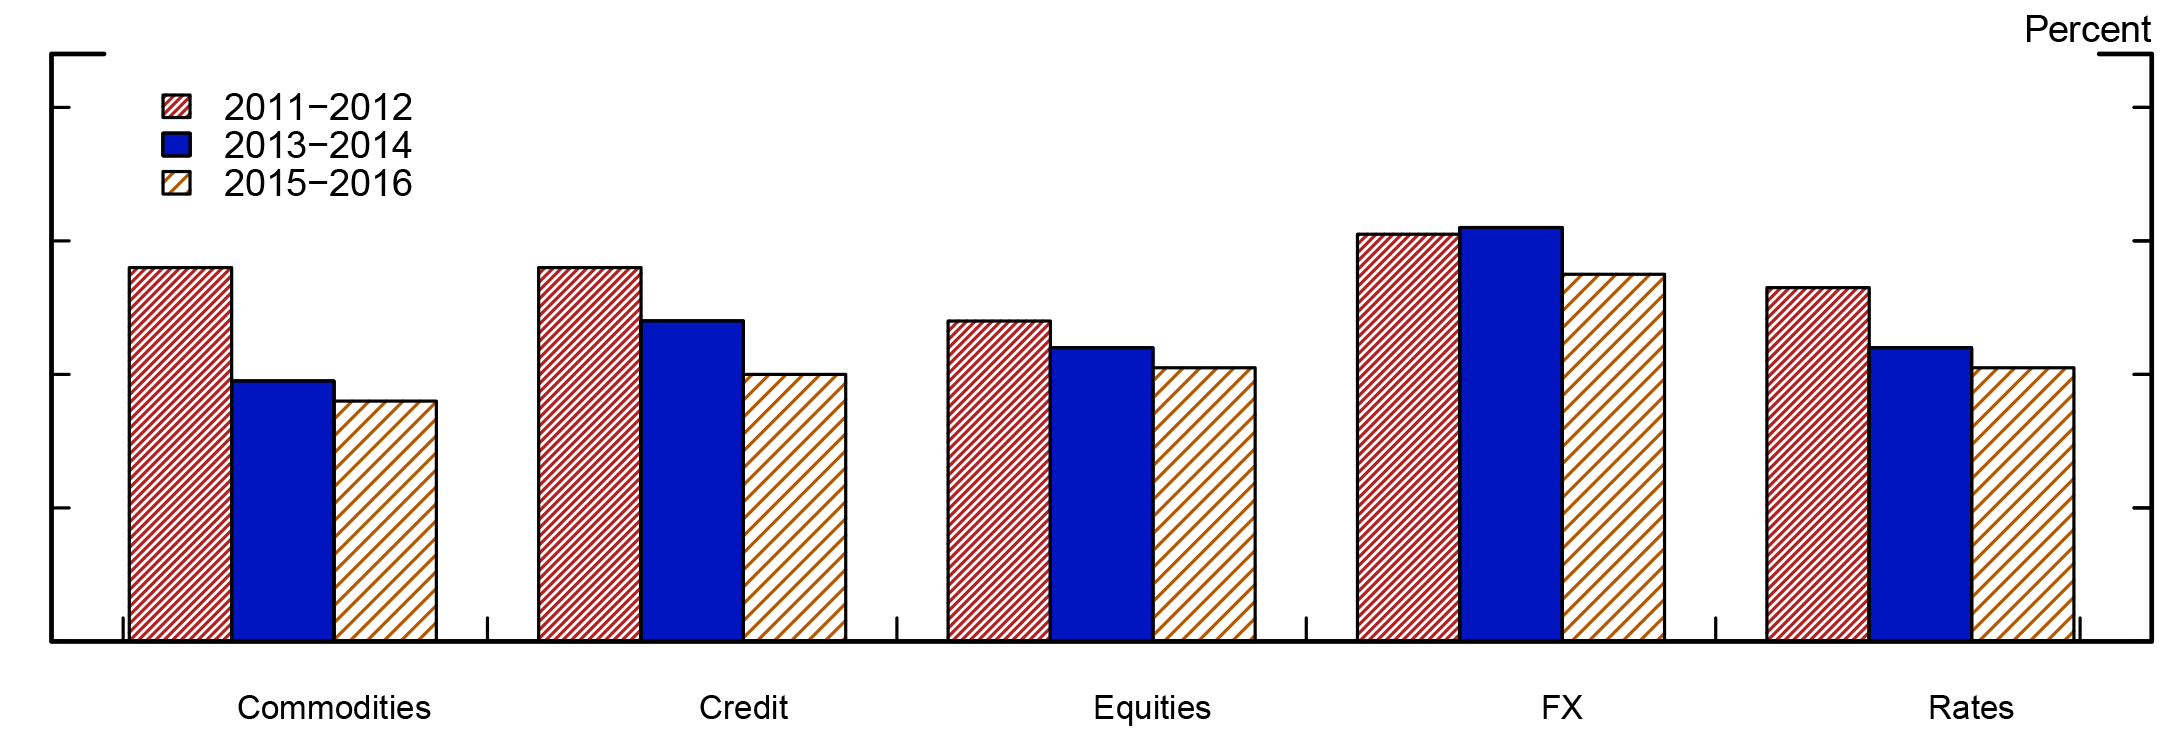
* This note was revised on July 11, 2017 to correct a labeling error in Figure 2.
Note: Cumulative percentage of total variance of VaR-adjusted trading revenue explained by the first two principal components. For each asset class, principal components are extracted from two years of time series of VaR-adjusted trading revenue across banks. Missing VaR-adjusted trading revenue observations for a given bank and asset class are interpolated using the expectation maximization algorithm.
Source: Federal Reserve Bank of New York; Federal Reserve Board staff calculations.
The dependence of trading performance on systematic factors is highest immediately following the crisis, as the first two PCs explained more than half of the total variation across banks in four of the five asset classes. Over the next four years, however, the importance of the first two PCs declines, as the total variance explained dropped by around 15 percentage points for commodities, credit, and rates, indicating that the dependence of banks' trading performance on systematic factors waned.
Correlations of trading performance across asset classes are modest. Table 2 displays the correlations of VaR-adjusted trading revenue of the average bank for pairs of asset classes. Overall, these pairwise correlations are modest; one implication of this finding is that for the average bank, the chance of a bad trading performance occurring simultaneously across multiple asset classes is limited. That said, the trading performance of rates is the most correlated with those of other asset classes, presumably because the rates trading performance reflects major developments in markets, the macroeconomy, and the stance of monetary policy. Indeed, the correlations between rates and equities and between rates and credit are the two highest pairwise correlations.
Table 2: Correlations of Trading Performance across Asset Classes
| Commodities | Credit | Equities | Foreign exchange | |
|---|---|---|---|---|
| Commodities | ||||
| Credit | 0.07 | |||
| Equities | 0.20 | 0.37 | ||
| Foreign exchange | 0.13 | 0.15 | 0.31 | |
| Rates | 0.17 | 0.37 | 0.42 | 0.34 |
Note: Pairwise correlations of VaR-adjusted trading revenue for the average bank. Cells with entries larger than 0.3 are highlighted with bold text.
Source: Federal Reserve Bank of New York; Federal Reserve Board staff calculations.
VaR is seldom breached by trading revenue. Is good VaR-adjusted trading revenue driven by unjustifiably small VaR estimates? A VaR breach analysis sheds light on this question: If a 99 percent, one-day-ahead VaR is correctly calibrated, daily trading revenue should breach that VaR 1 percent of the time. A lower breach frequency suggests that the VaR model is too conservative, while a higher breach frequency indicates that the VaR fails to capture the tail trading losses it is designed to capture.12 Using the supervisory data, table 3 provides a summary on VaR breaches.
Table 3: VaR Breaches across Asset Classes
| Number of banks with at least one breach | Average breach frequency | |
|---|---|---|
| Total | 3 | 0.07% |
| Commodities | 7 | 0.80% |
| Credit | 3 | 0.50% |
| Equities | 4 | 0.17% |
| Foreign exchange | 4 | 1.75% |
| Rates | 1 | 0.23% |
Note: The number of firms that report both trading revenue and VaR ranges from 8 to 11, depending on the asset class. "Average breach frequency" is the average of the ratio between the number of VaR breaches and the number of trading days across banks that report at least one breach.
Source: Federal Reserve Bank of New York; Federal Reserve Board staff calculations.
As can be seen, banks' trading revenues generally do not breach their VaRs. Only a small number of banks report any breaches to their total VaR, and for the banks that have breaches, the average breach frequency is significantly lower than 1 percent. These results are indications that banks' internal VaR models have conservative biases. The same evaluation is generally true at the asset-class level, with the exception of commodities, where most firms report at least one breach, and foreign exchange, where, for the firms that experience at least one VaR breach, they tend to see their VaRs breached more often than they should.
References
Adrian, Tobias, Erkko Etula, and Tyler Muir (2014). "Financial Intermediaries and the Cross Section of Asset Returns," Journal of Finance, 69 (6), pp. 2557-96.
Aramonte, Sirio, Marius del Giudice Rodriguez, and Jason Wu (2013). "Dynamic Factor Value-at-Risk for Large Heteroskedastic Portfolios," Journal of Banking & Finance, vol. 31 (11), pp. 4299-4309.
Berkowitz, Jeremy, and James M. O'Brien (2002). "How Accurate Are Value-at-Risk Models at Commercial Banks?" Journal of Finance, 57 (3), pp. 1093-1111.
Eisenbach, Thomas, Andrew Haughwout, Beverly Hirtle, Anna Kovner, David Lucca, and Matthew Plosser (2017). "Supervising Large, Complex Financial Institutions: What Do Supervisors Do?" Federal Reserve Bank of New York Economic Policy Review, 23 (1), pp. 57-77.
He, Zhiguo, Bryan Kelly, and Asaf Manela (2016). "Intermediary Asset Pricing: New Evidence from Many Asset Classes," Journal of Financial Economics, forthcoming.
He, Zhiguo, and Arvind Krishnamurthy (2013). "Intermediary Asset Pricing," American Economic Review, 103 (2), pp. 732-70.
McKinsey & Company (2011). Global Corporate and Investment Banking: An Agenda for Change, http://www.mckinsey.com/~/media/mckinsey/dotcom/client_service/financial%20services/latest%20thinking/reports/global_corporate_and_investment_banking_an_agenda_for_change.ashx.
Oran, Olivia (2016). "Banks Pile into Equities Trading as Salve for Bond Wounds," Reuters, April 20.
1. Iercosan and Wu are at the Federal Reserve Board. Kumbhat is a former Senior Financial Analyst at the Federal Reserve Board. He is currently a Member of the Secretariat at the G20 Financial Stability Board. Ng is a former Senior Research Assistant at the Federal Reserve Board. He is currently a Research Analyst at the Brookings Institution. The analysis and conclusions set forth are solely the responsibility of the authors and do not indicate concurrence by the Board of Governors of the Federal Reserve System, the Financial Stability Board or any of its members, or the Brookings Institution. We thank Darau Johnson, Andrew McKenna, Dan Li, Egon Zakrajšek, and the Market Risk team at the Federal Reserve Bank of New York for helpful comments, and we are grateful to David Crick for assisting with data permission and access. Return to text
2. For example, the asset pricing literature shows that wealth constraints on bank-affiliated broker-dealers, which could be viewed as the marginal investor in asset markets, affect the price of risk and that they amplify asset correlations (He and Krishnamurthy, 2013; Adrian, Etula, and Muir, 2014; He, Kelly, and Manela, 2016). Return to text
3. See McKinsey & Company (2011) for a discussion on the effect of these factors on the trading business. Return to text
4. Fitch Ratings, in 2012, called for more disclosure to "support a complete assessment of the impact of the various drivers of trading revenue." Return to text
5. Public data sources, such as the 10-K, 10-Q, and Y-9C, report quarterly revenue numbers for fixed income and equities. Return to text
6. For example, the U.S. banks in our sample constitute 83 percent of all trading assets among the 162 bank holding companies that filed the Y-9C report as of the fourth quarter of 2016. Return to text
7. The one-day-ahead VaR is usually a quantile of the P&L distribution on day t+1, given the bank's trading positions on day t. The methodology, look-back period, and confidence level behind the reported VaR could be different across banks. We use simple Gaussian multipliers to standardize all VaRs across banks to be at the 99 percent confidence level (for example, if a bank reports a 95 percent VaR, we standardize it to 99 percent by multiplying it by 2.33/1.64). Return to text
8. P&L associated with traditional investment banking activities, such as equity and debt issuance and advisory services, are typically not included. Return to text
9. The trading activities captured by MIS include trading positions and transactions booked in all domestic subsidiaries, including the holding company's wholly owned primary dealer, other securities broker-dealer subsidiaries, and depository subsidiaries. Return to text
10. As can be seen in table 1, in calculating the VaR-adjusted trading revenue for the average bank, the number of banks with data in a given asset class fluctuates over time. Return to text
11. A number of domestic and foreign banks have reportedly made additional investments in staffing and technology infrastructure to support the growth of the equities trading business. See Oran (2016). Return to text
12. Berkowitz and O'Brien (2002) and Aramonte, Rodriguez, and Wu (2013) discuss the importance and interpretation of VaR breaches. Return to text
Iercosan, Diana, Ashish Kumbhat, Michael Ng, and Jason Wu (2017). "Trading Activities at Systemically Important Banks, Part 1: Recent Trends in Trading Performance," FEDS Notes. Washington: Board of Governors of the Federal Reserve System, July 10, 2017, https://doi.org/10.17016/2380-7172.2023.
Disclaimer: FEDS Notes are articles in which Board staff offer their own views and present analysis on a range of topics in economics and finance. These articles are shorter and less technically oriented than FEDS Working Papers and IFDP papers.