FEDS Notes
July 10, 2017
Trading Activities at Systemically Important Banks, Part 2: What Happened during Recent Risk Events?
Diana Iercosan, Ashish Kumbhat, Michael Ng, and Jason Wu 1
Executive summary
As documented in the FEDS Notes article "Trading Activities at Systemically Important Banks, Part 1: Recent Trends in Trading Performance," trading performance at systemically important banks, measured by trading revenue per dollar of value-at-risk (VaR) committed, has trended up over the past few years.2 Robust trading revenue at these banks has also been a key driver of profitability in recent quarters.3 But do these positive trends obscure substantial trading losses when markets experience unanticipated risk events or large price moves?
Using a confidential data set of trading revenues across systemically important banks and across asset classes collected daily by onsite supervisors, we find that while certain events--such as the "flash rally" in interest rates on October 15, 2014--left an imprint on some trading businesses, banks' trading performance overall has been quite resilient to a host of risk events over the past few years. The possibility that trading businesses were not vulnerably positioned during these events could have shielded banks from large losses.4
This resilience should not be overstated, however, as the shocks to financial markets brought about by the risk events studied in the note were moderate compared with the experiences during the financial crisis. Moreover, it is possible that this list of events omits certain days where markets experienced outsized price moves. To address the latter issue, we also systematically compare distributions of VaR-adjusted trading revenue of the average bank on days with significant declines in the stock market, widening of credit spreads, or notable increases in interest rates--"large move" days over the past seven years--to those on all other trading days when these large asset price moves were absent. This exercise reveals that the distributions of VaR-adjusted trading revenue on large move days and on all other days are generally only modestly different, which again suggests that banks' trading performance has been resilient over the past several years.
Our findings have clear positive implications for financial stability. As highlighted by a number of important recent contributions to the literature on financial intermediation such as He and Krishnamurthy (2013), the absence of negative wealth shocks at banks could help support certain asset prices during volatile times.5 In addition, steady trading performance during risk events could also reduce the likelihood of disruptions to counterparty relationships.
Background on supervisory trading revenue and VaR data
Our analysis focuses on 13 systemically important domestic bank holding companies and foreign banking entities. Confidential daily supervisory data on trading revenue and one-day-ahead VaR for five major asset classes (credit, commodities, equities, foreign exchange, and rates) from 2010 to 2016 are used in this note. Data for foreign banks encompass their trading activities in the United States but not globally. Not all banks' trading revenue or VaR in each asset class are captured on each day, although data for our panel of firms are reasonably balanced.6 The FEDS Notes article "Trading Activities at Systemically Important Banks, Part 1: Recent Trends in Trading Performance" contains a detailed description of the data.
Trading revenue during risk events
Financial markets constantly confront risk events that arise from geopolitical, economic, and policy developments. The focus of this section is to take a closer look at several key events over the past few years--ones that have left significant imprints on financial markets--and how banks' trading businesses performed on those days. The list of risk events we focus on is non-exhaustive but diverse. Chronologically, these are the "taper tantrum" in 2013, the flash rally in 2014, the Swiss National Bank's (SNB) decision to remove the ceiling on the Swiss franc and the surprise devaluation of the renminbi (RMB) in 2015, and the Brexit referendum and the U.S. presidential election in 2016.7 These events or their outcomes were largely unanticipated by market participants. As can be seen in figure 1, key asset prices experienced large moves on the days of the events.8
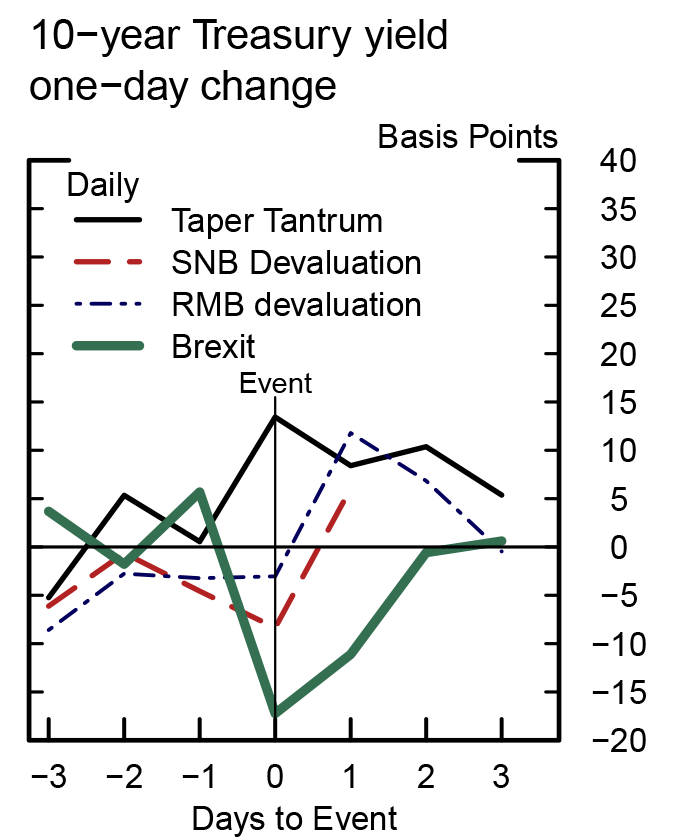
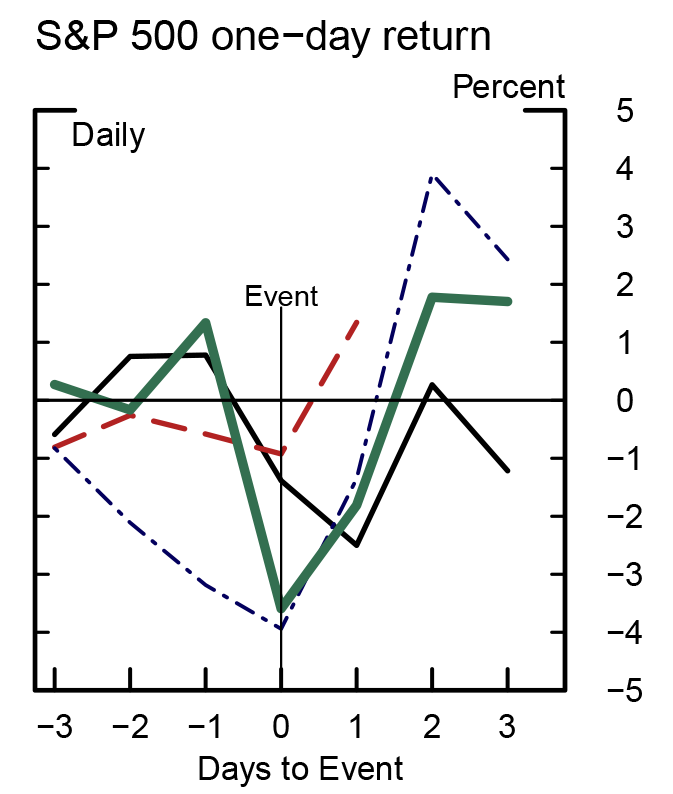
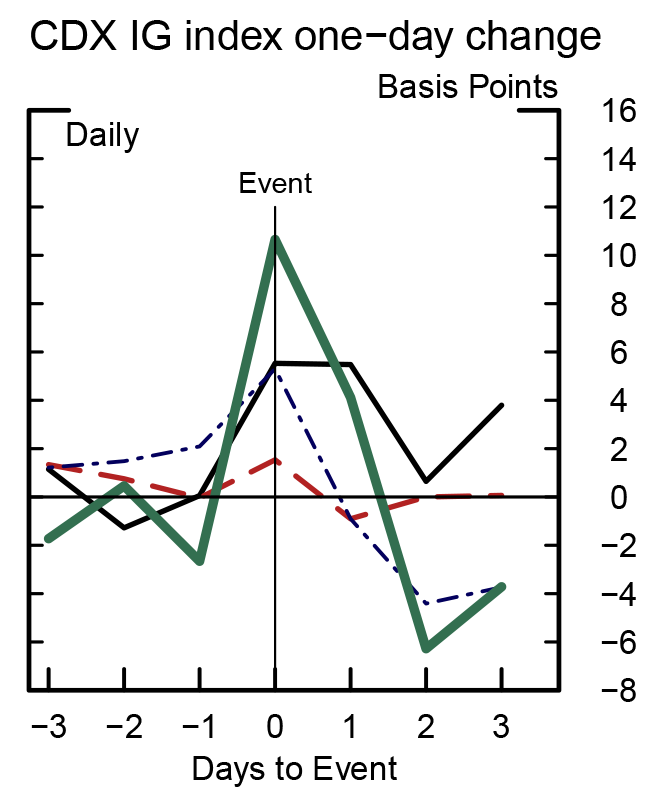
Note: The event days for the taper tantrum, SNB devaluation, RMB devaluation, and Brexit are June 19, 2013, January 25, 2015, August 24, 2015, and June 24, 2016, respectively. Event lines for the flash rally and U.S. elections are omitted for brevity.
Source: Bloomberg; Markit.
The top panel of figure 2 shows the percentage of large banks that had total trading revenue on the day of the event below the 5th percentile of their respective historical distributions since 2010 (the red portions of the bars) and the percentage of banks that had trading revenue above the 95th percentile (the green portions). Unusually poor trading revenues, which include some instances of trading losses, were experienced by about one-half and one-quarter of the banks on the days of the flash rally and SNB devaluation, respectively. For the other events, essentially no banks experienced unusually poor trading revenues. In fact, some banks performed quite well during these events--for example, one-third of banks made large trading profits on Brexit day despite large declines in the prices of risky assets.
It is possible an event affects trading revenue over time rather than immediately on the day, as investors digest the news and trade accordingly or as the effects of the event percolate across markets. The bottom panel of figure 2 provides evidence that this was not the case for the events we consider; it shows that only a few banks had unusually good or poor trading revenue in the week of the events by historical standards. In other words, any effects of the events on trading performance appeared to be short-lived.
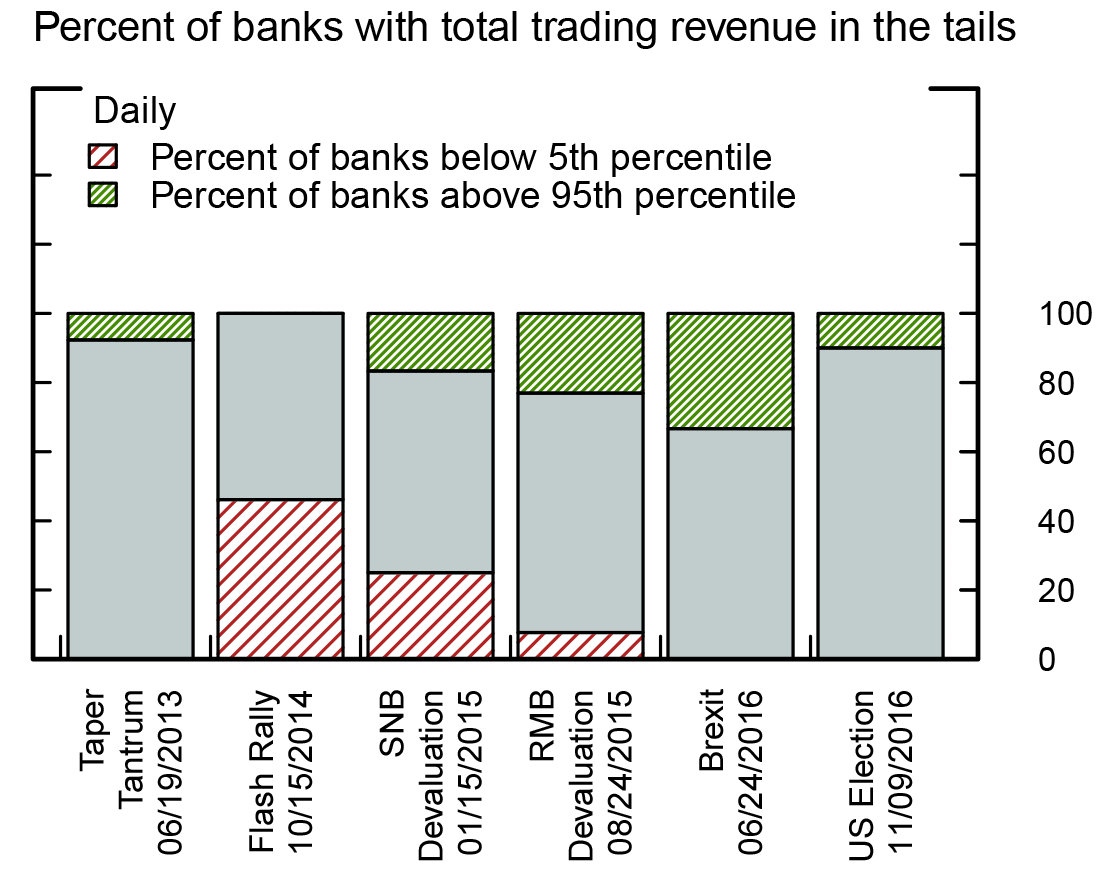
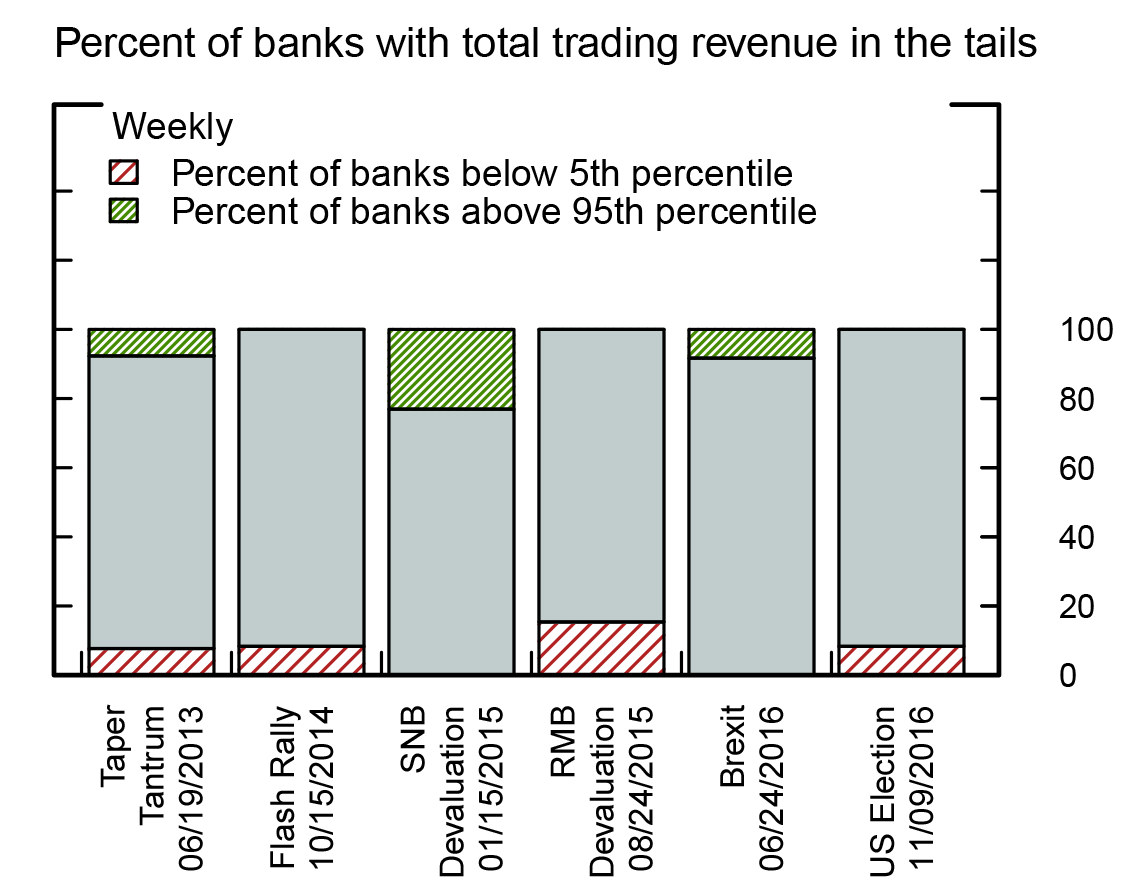
This note was revised on July 12, 2017 to correct a labeling error in Figure 2.
Note: The red portions of the bars in the top (bottom) panel show the percent of banks in our sample that had daily (weekly) trading revenue below the 5th percentiles of their respective historical distributions, which span the 2010-16 period. The green portions show the percent of banks that had trading revenue above the 95th percentiles of their respective historical distributions. Not all banks report trading revenue for each asset class and each day. For each bank, weekly trading revenue was calculated by taking the average of trading revenue for days within a week, multiplied by the number of trading days in the week.
Source: Federal Reserve Bank of New York; Federal Reserve Board staff calculations.
Depending on the nature of the risk event, trading performance in some asset classes could be affected more than others. Table 1 displays, across five asset classes, the percentages of banks that had trading revenue below the 5th percentile (rows labeled "≤q(.05)") and above the 95th percentile (rows labeled "≥q(.95)") on the day of the events. Corroborating the top panel of figure 1, the credit, equities, and rates businesses of many banks performed poorly on the flash rally day relative to history, while the foreign exchange businesses of almost one-half of banks were negatively impacted by the SNB devaluation.9 Outside of these instances, however, trading performance across asset classes was generally resilient for the vast majority of banks during these risk events, with the equities and foreign exchange business lines at a number of banks benefiting from the volatility induced by the RMB devaluation and by Brexit.10
Table 1: Percent of banks with unusually good or poor trading revenue following events by asset class
| Total | Commodities | Credit | Equities | Foreign exchange | Rates | ||
|---|---|---|---|---|---|---|---|
| Taper tantrum (6/19/2013) | ≤q(.05) | 0 | 0 | 0 | 0 | 0 | 0 |
| ≥q(.95) | 8 | 0 | 0 | 0 | 20 | 13 | |
| Flash rally (10/15/2014) | ≤q(.05) | 46 | 0 | 72 | 30 | 16 | 54 |
| ≥q(.95) | 0 | 0 | 0 | 10 | 0 | 9 | |
| SNB devaluation (1/15/2015) | ≤q(.05) | 25 | 0 | 0 | 0 | 45 | 9 |
| ≥q(.95) | 16 | 0 | 0 | 20 | 45 | 18 | |
| RMB devaluation (8/24/2015) | ≤q(.05) | 8 | 0 | 18 | 10 | 0 | 27 |
| ≥q(.95) | 23 | 11 | 9 | 50 | 83 | 0 | |
| Brexit (6/24/2016) | ≤q(.05) | 0 | 0 | 10 | 0 | 10 | 0 |
| ≥q(.95) | 33 | 0 | 10 | 20 | 70 | 50 | |
| U.S. elections (11/9/2016) | ≤q(.05) | 0 | 0 | 13 | 0 | 11 | 0 |
| ≥q(.95) | 10 | 0 | 0 | 33 | 33 | 14 | |
Note: For each event, the row labeled "≤q(.05)" ("≥q(.95)") shows the percentages of banks that reported total or asset class-specific trading revenue below the 5th (above the 95th) percentiles of their respective historical distributions from 2010 to 2016. Not all banks report trading revenue for each asset class and each day.
Source: Federal Reserve Bank of New York.
In summary, while certain risk events over the past five years--particularly the flash rally on October 15, 2014--have left some imprint on banks' trading performance, unusually poor trading revenue by each bank's historical standards were not at all pervasive during most other risk events. Overall, banks' trading performance has been quite resilient. When trading revenue was affected by an event, the effects did not appear to be persistent.
Trading revenue on days with large asset price moves
This section focuses on trading performance on days in our sample period that had sizable market moves, such as large declines in the stock market, in addition to the six risk events in the previous section. In order to effectively summarize trading revenue that is very different in size across different banks and asset classes, we normalize it using the 99 percent, one-day-ahead VaR computed by each bank for each asset class--the resulting VaR-adjusted trading revenue could be viewed as trading revenue generated by each dollar of VaR committed, which we use as a proxy for trading performance.11 Figure 3 shows the pooled (across banks) distributions of VaR-adjusted total (top panel), credit (middle panel), and equities (bottom panel) trading revenue on three sets of large move days--the 50 trading days with the largest declines in the S&P 500, the 50 trading days with the largest widening of CDX IG index spreads, and the 50 trading days with the largest increases in the 10-year Treasury yields--as well as distributions over all other trading days.
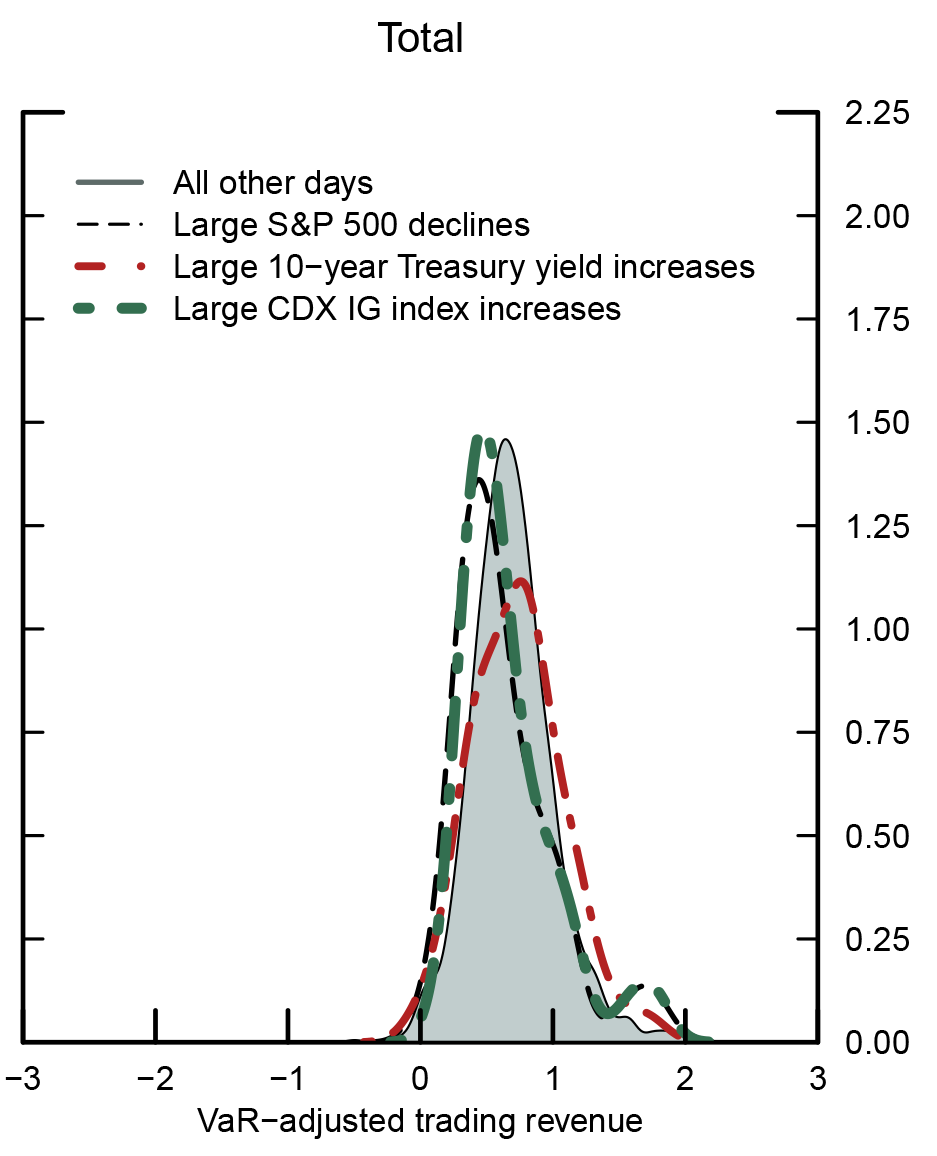
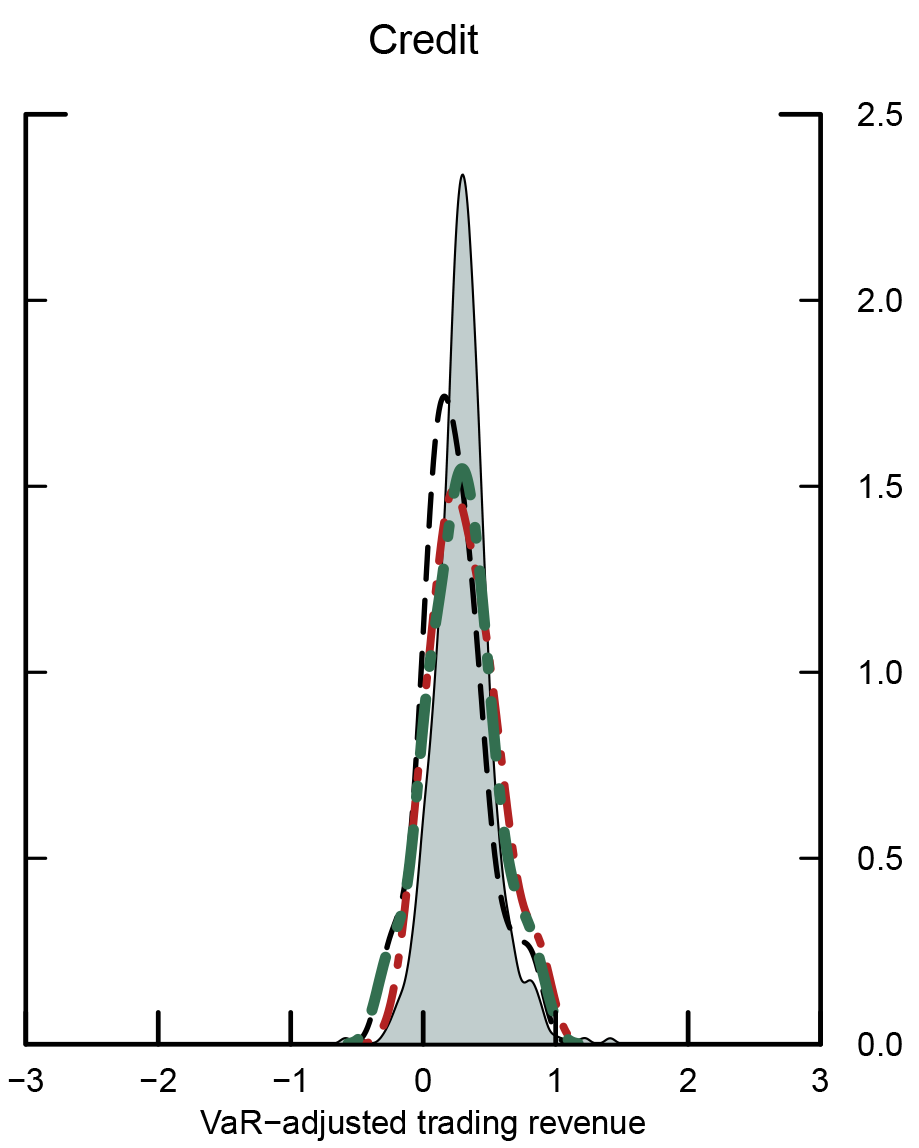
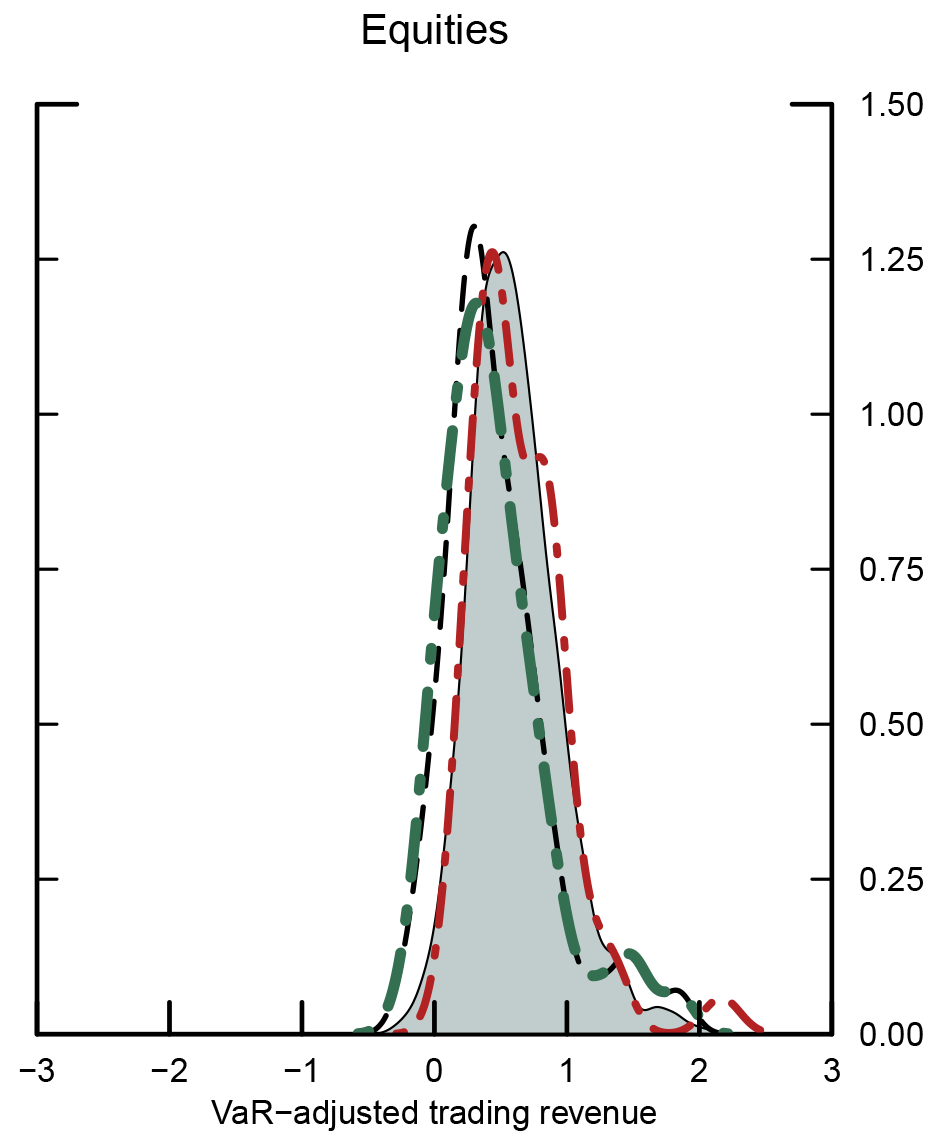
Note: The top, middle, and bottom panels show distributions of VaR-adjusted trading revenue for the total trading business, credit, and equities, respectively. Each distribution is a smoothed density based on a Gaussian kernel with the bandwidth selected by Silverman’s rule of thumb. In each panel, the solid gray area is the pooled distribution (that is, all banks included) of VaR-adjusted trading revenue on days without large market moves. The black, red, and green lines represent, respectively, the pooled (across banks) distributions based on the 50 days with the largest S&P 500 declines, the 50 days with the largest 10-year Treasury yield increases, and the 50 days with the largest CDX IG increases. Some trading days included in these 50-day distributions overlap.
Source: Federal Reserve Bank of New York; Federal Reserve Board staff calculations.
Trading performance appears to be hindered on days with large stock market declines or large credit spread widening--the black and green dashed distributions, respectively. These distributions are to the left of those over all other trading days--the shaded gray areas--and are also generally wider, possibly reflecting differences in positioning or in the amount of trading activity across banks on those days. Equities appears to be the most affected asset class by these large moves. That said, the relative shifts of the distributions are fairly modest, which indicates that days with large asset price moves do not generally have an outsized effect on trading performance. Furthermore, as can be seen in the left panel, large total trading losses were not that much more common on days with large asset price moves, as the left-tail of the distribution are not noticeably thicker.
Table 2 summarizes, for each asset class, the ratios of the means of the pooled distributions of VaR-adjusted trading revenue for days with large asset price moves to the means for all remaining days. Cells are highlighted if the means are statistically different at a 5 percent significance level using a two-sided t-test. All ratios are positive across all asset classes, which shows that the average VaR-adjusted trading revenue on large move days were profits rather than losses. Large stock market declines weaken trading performance in credit and equities by one-third and one-fourth, respectively. Large credit spread widening have similar effects on these asset classes as large stock market declines, likely because these two types of moves often occur at the same time. Large interest rate increases boost average trading performance in rates by about one-half. Despite these asset class-level findings, average total VaR-adjusted trading revenue on days with large asset price moves are only modestly different from that on all other days, which indicates that banks' overall trading businesses have been resilient to price swings.
Table 2: Ratios of the means of VaR-adjusted trading revenue distributions on large move days to all other trading days
| Total | Commodities | Credit | Equities | Foreign exchange | Rates | |
|---|---|---|---|---|---|---|
| Large S&P 500 declines | 0.88 | 1.53 | 0.61 | 0.74 | 1.22 | 1.2 |
| Large 10-year yield increases | 0.96 | 0.87 | 0.87 | 0.98 | 1.59 | 1.53 |
| Large CDX IG increases | 0.93 | 1.67 | 0.74 | 0.69 | 1.2 | 1.31 |
Note: Each cells shows the ratio of the mean VaR-adjusted trading revenue across banks on each type of large move days to all other trading days. A ratio smaller (greater) than one indicates that the mean VaR-adjusted trading revenue is lower (higher) on the large move days than on all other trading days. Shaded cells indicate that the two means are statistically different at a 10 percent or smaller significance level based on a two-sided t-test.
Source: Federal Reserve Bank of New York; Federal Reserve Board staff calculations.
In sum
We show that while trading performance for some systemically important banks in a few asset classes are affected by selected risk events or on certain days with large asset price moves, banks have generally shown resilience and experienced few losses. A companion FEDS Notes article, "Trading Activities at Systemically Important Banks, Part 3: What Drives Trading Performance?" shows that trading performance over the past several years has been driven more by intermediation activities than by asset price moves, which supports our findings.12
References
Adrian, Tobias, Daniel M. Covitz, and J. Nellie Liang (2015). "Financial Stability Monitoring," Annual Review of Financial Economics, vol. 7, pp. 357–95.
Cielinska, Olga, Andreas Joseph, Ujwal P Shreyas, John Tanner, and Michalis Vasios (2017). "Gauging Market Dynamics Using Trade Repository Data: The Case of the Swiss Franc De-Pegging," Financial Stability Paper No. 41. London: Bank of England, January, www.bankofengland.co.uk/financialstability/Pages/fpc/fspapers/fs_paper41.aspx.
Financial Crisis Inquiry Commission (2011). The Financial Crisis Inquiry Report: Final Report of the National Commission on the Causes of the Financial and Economic Crisis in the United States, Washington: U.S. Government Printing Office, February 25, https://www.gpo.gov/fdsys/pkg/GPO-FCIC/content-detail.html.
He, Zhiguo, Bryan Kelly and Asaf Manela (forthcoming). "Intermediary Asset Pricing: New Evidence from Many Asset Classes," Journal of Financial Economics.
He, Zhiguo, and Arvind Krishnamurthy (2013). "Intermediary Asset Pricing," American Economic Review, vol. 103 (April), pp 732–77.
1. Iercosan and Wu are at the Federal Reserve Board. Kumbhat is a former Senior Financial Analyst at the Federal Reserve Board. He is currently a Member of the Secretariat at the G20 Financial Stability Board. Ng is a former Senior Research Assistant at the Federal Reserve Board. He is currently a Research Analyst at the Brookings Institution. The analysis and conclusions set forth are solely the responsibility of the authors and do not indicate concurrence by the Board of Governors of the Federal Reserve System, the Financial Stability Board or any of its members, or the Brookings Institution. We thank Darau Johnson, Andrew McKenna, Dan Li, Egon Zakrajšek, and the Market Risk Team at the Federal Reserve Bank of New York for helpful comments, and David Crick for assisting with data permission and access. Return to text
2. Trading revenue is benchmarked against VaR, a reasonable proxy for market risk, so that comparisons of trading performance could be made across banks and across asset classes. As discussed in more details in "Trading Activities at Systemically Important Banks, Part 1: Recent Trends in Trading Performance," this VaR-adjusted trading revenue is not the same as traditional bank earnings benchmarks, such as return on equity. Return to text
3. See, for example, http://www.wsj.com/graphics/bank-earnings/ for quarterly trading results as reported by systemically important banks. Return to text
4. Adrian, Covitz, and Liang (2015) explain that the price of risk is more sensitive to shocks when vulnerabilities are high. Conversely, when vulnerabilities are low—for example, when risk-taking or the use of leverage is not excessive—market shocks do not amplify price movements as much, and banks are more resilient. Return to text
5. In an empirical assessment of the theoretical predictions of He and Krishnamurthy (2013), He, Kelly, and Manela (forthcoming) show that the price of risk on intermediary capital is positive; one implication of this result is that more resilient intermediaries, like systemically important banks, could prevent poor performance in assets that have high average returns, which are likely more risky in nature. Return to text
6. On days that a firm does not report VaR for certain asset classes, a 99 percent VaR is estimated by fitting an Asymmetric Power GARCH (1,1) model of trading revenue to those asset classes. Return to text
7. The term "taper tantrum" generally refers to a period from May to July in 2013 when longer-term interest rates reacted substantially to various news reports and the Federal Reserve's communications about changes to the size and timing of the large-scale asset purchase program. The calendar date of June 19, 2013, was selected because of the sizable selloff of longer-term bonds on that day. Return to text
8. While the flash rally on October 15, 2014, did not result in large end-of-day asset price changes, the intraday swings in the 10-year Treasury yield exceeded 35 basis points. Return to text
9. Cielinska and others (2017) show that during the SNB devaluation episode, rapid intraday price fluctuations were associated with poor market liquidity, particularly the limited provision of liquidity by dealer banks in the first hour after the event, which could be explained by our finding that some banks experienced poor trading performance. Return to text
10. An asset class-specific evaluation of trading performance in the week of the risk events suggests that only a few banks-asset class combinations have unusually good or poor trading performance. Return to text
11. See the FEDS Notes article "Trading Activities at Systemically Important Banks, Part 1: Recent Trends in Trading Performance" for a more in-depth discussion of VaR-adjusted trading revenue. Return to text
12. More specifically, that FEDS Notes article finds that trading performance has mostly been driven by trading volumes, bid-ask spreads, and securities issuance, which suggests that banks have limited reliance on large directional/proprietary positions to generate revenue. This finding stands in stark contrast to the widely documented large trading losses that bank-dealers experienced during the financial crisis as a result of sizable proprietary positions (see, for example, the Financial Crisis Inquiry Commission (2011)). Return to text
Iercosan, Diana, Ashish Kumbhat, Michael Ng, and Jason Wu (2017). " Trading Activities at Systemically Important Banks, Part 2: What Happened during Recent Risk Events?," FEDS Notes. Washington: Board of Governors of the Federal Reserve System, July 10, 2017, https://doi.org/10.17016/2380-7172.2024.
Disclaimer: FEDS Notes are articles in which Board staff offer their own views and present analysis on a range of topics in economics and finance. These articles are shorter and less technically oriented than FEDS Working Papers and IFDP papers.