FEDS Notes
August 02, 2019
The Universe of Leveraged Bank Loan and High Yield Bond U.S. Mutual Funds1
Ayelen Banegas and Jessica Goldenring2
Executive Summary
Since the financial crisis, the markets for Bank Loan (BL) and High Yield Bond (HYB) mutual funds (MFs) have grown significantly, with assets under management increasing from $19 billion and $75 billion to close to $117 billion and $225 billion, respectively, as of December 2018. This note aims to characterize the universe of BL MFs and compare it against that of HYB MFs on several dimensions. The main takeaways are as follows:
- BL and HYB MFs' respective market share of leverage loans (LL) and high yield (HY) corporate bonds outstanding increased since the mid-2000s. BL MFs reached a 15 percent peak in 2013 and since has fluctuated around 7 and 10 percent. Meanwhile, HYB MFs' market share consistently increased since the mid-2000s, reaching about 16 percent at the end of 2018.
- On aggregate, BL MFs held about 74 percent of their assets in LL while HYB MFs held 5 percent of total assets in such loans. In addition, both MF categories held, on average, about three percent of their assets in cash.
- In terms of credit rating, HYB and BL MFs hold around 60 percent of B, BB and BBB-rated assets. Moreover, HYB MFs hold about 10 percent more below B rated assets than BL MFs.
- At the asset class level, net flows as a share of assets were larger and more volatile for BL MFs than for their HYB counterparts.
- HYB MFs significantly outperformed BL MFs since early 2000.
- Introduction
The underlying assets of corporate debt mutual funds are often grouped into two broad categories that lie at different ends of the credit spectrum: investment grade and high yield. While mutual funds investing primarily in investment grade corporate bonds are considered less risky, higher returns are generally associated with high yield mutual funds. Two increasingly popular investment categories within the high yield MF universe are BL and HYB MFs.
BL MFs invest a large share of their portfolios in leveraged loans, defined as commercial loans lent to high yield companies. The issuing companies are usually below investment grade or unrated with a risk profile similar to speculative grade firms. Similarly, HYB MFs primarily invest in high yield bonds or "junk bonds". Reportedly driven in part by investors reaching for yield in the sustained low interest rate environment, the demand for bank loans and high yield bonds increased substantially since the financial crisis: from 2008 to year-end 2018, institutional leveraged loan outstanding increased from around $550 billion to $1,150 billion and HY bonds outstanding increased from $750 billion to $1000 billion. Moreover, since 2008, HYB MFs' assets under management increased from around $75 billion to $225 billion and bank loan funds grew from $19 billion to $117 billion. These trends highlight changes in the HYB and BL market and are motivation for further insight into the high yield mutual fund universe. Before detailing the BL and HYB MFs universes, there are differences between BL and HYB that are important to note:
- Coupons: BLs are floating rate investments, typically defined as Libor plus a fixed spread. As a result, as interest rates (i.e. Libor) rise, coupon rates also increase. On the other hand, HY bonds typically have fixed coupons. Interest rate increases tend to benefit floating rate investments such as BLs.
- Recovery rate: BLs are collateralized, senior secured debt, at the top of a company's corporate capital structure. In the case of a company's default, BL investors are more likely to receive more principal back than HY bond investors. HY bonds are subordinate in the capital structure and are paid after BLs.
- Callability: BLs are callable at par at any time after the first few months of the issuance, and therefore can have limited upside potential during bull markets. In contrast, HY bonds tend to have better call protections, allowing investors to benefit further from price appreciation.
- Liquidity: HYBs are generally more liquid than bank loans as loans tend to be less standardized, which can lead to more uncertainty and longer settlement time. As a result, during periods of market stress, in which investors are reducing their exposures to these assets, BLs can be expected to experience larger price declines than HY bonds.
- Investor Protection: BLs contain covenants, or restrictions, that put limitations on borrowers and protect investors by requiring the borrower to do or refrain from doing certain activities. These clauses in the loan agreement can be particularly useful for lenders in the event of a default or loan restructuring. However, these covenants have been loosening over the past years, leading to more similarities between BL and HY bonds.
- Transparency: Firms issuing bonds are subject to more stringent disclosure requirement than firms issuing loans. Bank Loans are not a security and are less regulated. Moreover, because of the limited public disclosure of their financial information, BLs are generally more difficult to monitor by a third-party.3
This analysis uses monthly share class data from Morningstar Direct (MD).4 The sample contains U.S. domiciled mutual funds over the 2000-2018 period and includes both active and inactive funds in order to avoid survivorship bias.5 The following subsections characterize and compare the universes of these two mutual fund investment categories.
- Assets Under Management
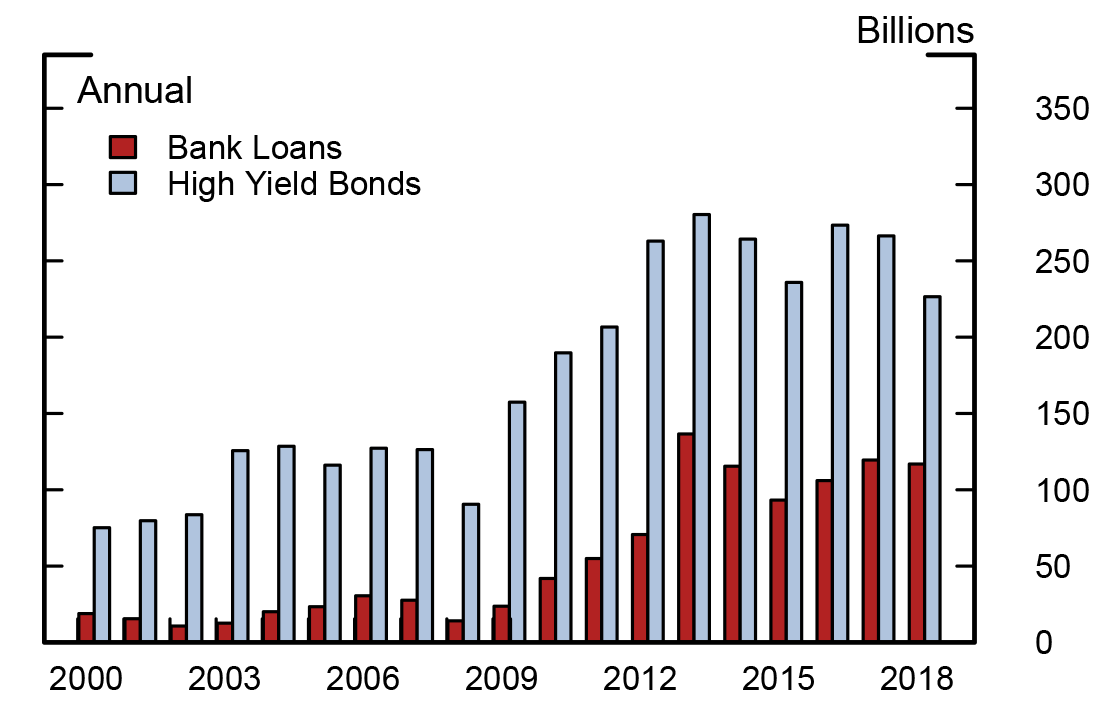
2.1 BL and HYB assets under management have grown significantly since the financial crisis.
Total net assets of BL and HYB MFs, depicted in figure 1, rose at a strong pace during the post-crisis period, supported by large inflows, new funds and positive performance. Specifically, BL MF assets under management (AUM) increased from roughly 19 to 117 billion dollars over the sample period, while HYB MF assets grew from close to 75 to 225 billion dollars. Notably, the growth in AUM was associated with a rise in the number of mutual funds investing in these asset classes, with BL and HYB MFs increasing from 16 and 153 funds to 56 to 191 funds respectively over the sample period. The breakdown of assets by investor type also highlights the increased participation of institutional investors in BL and HYB funds, particularly since the financial crisis. For instance, the share of total assets held by institutional investors in BL MFs jumped from nearly 16 percent in 2009 to 50 percent at the end of 2018. Similarly, HYB MF institutional investors' participation increased notably since 2009, reaching 40 percent at the end of 2018.
- Portfolio Allocations
3.1 BL funds held about 74% of their assets in leveraged loans, while HYB funds held near 5% of total assets in such loans.
BL mutual funds held about 74 percent of their assets in bank loans, which accounted for $84 billion as of fourth quarter of 2018, while HYB funds held only 5 percent of total assets in such loans, equivalent to around $12 billion in AUM. Meanwhile, HYB funds held about 76 percent of total assets in corporate bond securities while BL funds held around 11 percent. In addition, both MF categories hold less than 5 percent net cash, on average, through the sample. These cash allocations can be particularly relevant for these fund categories since both BL and HYB MFs engage in liquidity transformation and therefore might need cash buffers to meet large redemptions.6 In addition, we find that BL and HYB MFs held a relatively small share of their bond portfolios in foreign fixed income assets, with domestic debt comprising about 81 and 84 percent of BL and HYB allocations to the fixed income sector, respectively.
3.2 BL and HYB MFs held about 74% and 71% of their fixed-income allocation in B and below-B rated debt.
Although by definition BL and HYB MFs invest primarily in below investment grade debt, in this section we use MD credit rating variables to decompose BL and HYB MF fixed income and cash allocations in terms of their credit quality.7 Figures 2 and 3 display the breakdown of assets by specific credit ratings.8 In both BL and HYB MFs, the largest credit category correspond to B rated securities, representing about 42 and 32 percent, respectively. For BL MFs, these percentages account to about $27 billion in assets at end-of-year 2018, while for HYB MFs, B rated allocations are close to $25 billion. Overall, at the end of 2018, BL and HY funds held 74% and 71%, respectively, of their rated assets in securities with a credit rating of B and below.
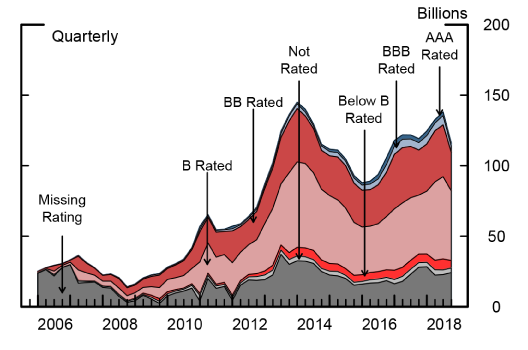
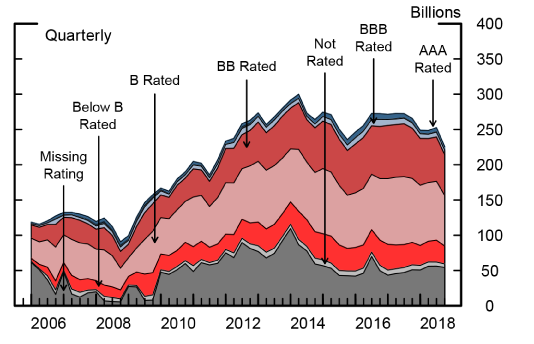
Moreover, the specific credit ratings highlight the Investment Grade (IG) and High Yield (HY) composition as the shades of blue in figures 2 and 3 show the allocation to IG assets while the shades of red summarize the HY assets. The color composition juxtaposes the large majority of high yield assets held by both BL and HYB MFs versus the small share (around 5 percent for both) of IG rated holdings at the end of 2018. The concatenation of ratings is used to construct market share estimates described in the next section.
3.3 BL MFs held about 7% of LL outstanding while HYB MFs held roughly 16% of HY bond outstanding at the end of 2018.
Understanding their market share in the underlying asset markets is important in assessing the possible risks of BL and HYB MFs. Figure 4 show estimates of the share over time of BL and HYB outstanding held by the corresponding MF categories.9 On balance, the percentage of BL and HYB MFs trends up through the sample. BL MFs, reached its peak in 2013 and has since fluctuated between 7 and 10 percent. Of note, in 2018 the BL percent was near 10 percent but dropped to 7 percent in the fourth quarter due to large redemptions in December.10 Meanwhile, the share for HYB funds increased in the post-crisis period and is somewhat higher than the level observed for BL MFs, at 16 percent.11
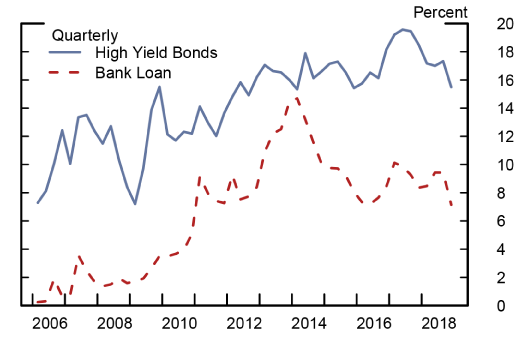
Note: Ratio for BL is the assets of BL held by BL MFs to institutional leveraged loan outstanding. The ratio for HY is the assets of HY bonds held by HY MFs to HY bonds total outstanding. HY CB outstanding excudes unrated.
Source: Morningstar, Inc.; Thomson Reuters LPC; Mergent, Inc.
- Flow and Performance
The growth of BL and HYB MFs' AUM was driven by positive performance, strong inflows and new funds entering the sector in the post-crisis period. In particular, BL MFs experienced large net inflows, reaching a $61.8 billion peak in 2013. Since then, net flows decreased substantially, with annual net outflows reaching almost 20 billion dollars in 2014 and in 2015. More recently, BL annual net flows have remained almost flat. Specifically in 2018, annual net flows reached 0.2 billion dollars. HY MFs show a similar pattern to BL MFs post-crisis and experienced large net inflows, with annual net flows reaching a 26.6 billion dollar peak in 2012, followed by strong outflows in the order of 18 and 13 billion dollars in 2014 and 2015, respectively. However, unlike BL MFs, in 2018, HY MFs experienced large net outflows close to 31 billion dollars.12
4.1 Flows as a share of assets have been larger and more volatile for BL than for HYB MFs.
The monthly frequency data highlights that BL net flows as a share of total net assets (TNA) at times were substantial and volatile, with net outflows reaching between 5 to 11 percent of total AUM (figure 5). Though smaller in magnitude than BL flows, HYB fund net flows as a share of TNA were also volatile, with redemptions reaching their record high level of 4.4 percent of TNA around the Taper Tantrum in 2013. Of note, BL and HYB MF flows tend to show different sensitivity to interest rate changes, as BLs generally benefit from interest rate hikes while HY bond performance is negatively affected by rising interest rates. The Taper Tantrum in May 2013 provides an illustration of the different effects of a monetary policy shock on the flows of these two investment categories. This event triggered notable outflows from HYB MFs, with monthly redemptions reaching 4.4 percent of TNA in June of 2013, equivalent to around $11 billion in AUM. At the same time, as shown by figure 5, BL MFs experienced large net inflows in the order of 6 percent of TNA, totaling about 6 billion dollars. This event highlights the different effects of a change in the expected future benchmark interest rate on BL and HYB flows. Nevertheless, it is important to note that other types of shocks, such as credit shocks, could trigger different flow patterns and investor redemption behavior than the ones observed during the Taper Tantrum.
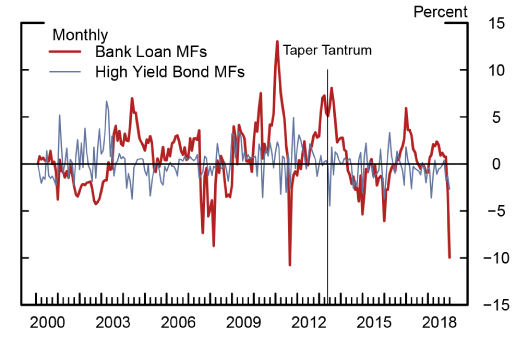
Note: Values are calculated as the weighted sum of fund's flows for a given day divided by total assets of the share class universe (TNA) where the weight is the lag assets of the fund divided by the lag TNA. Date of the Taper Tantrum is May 2013.
Source: Morningstar, Inc.
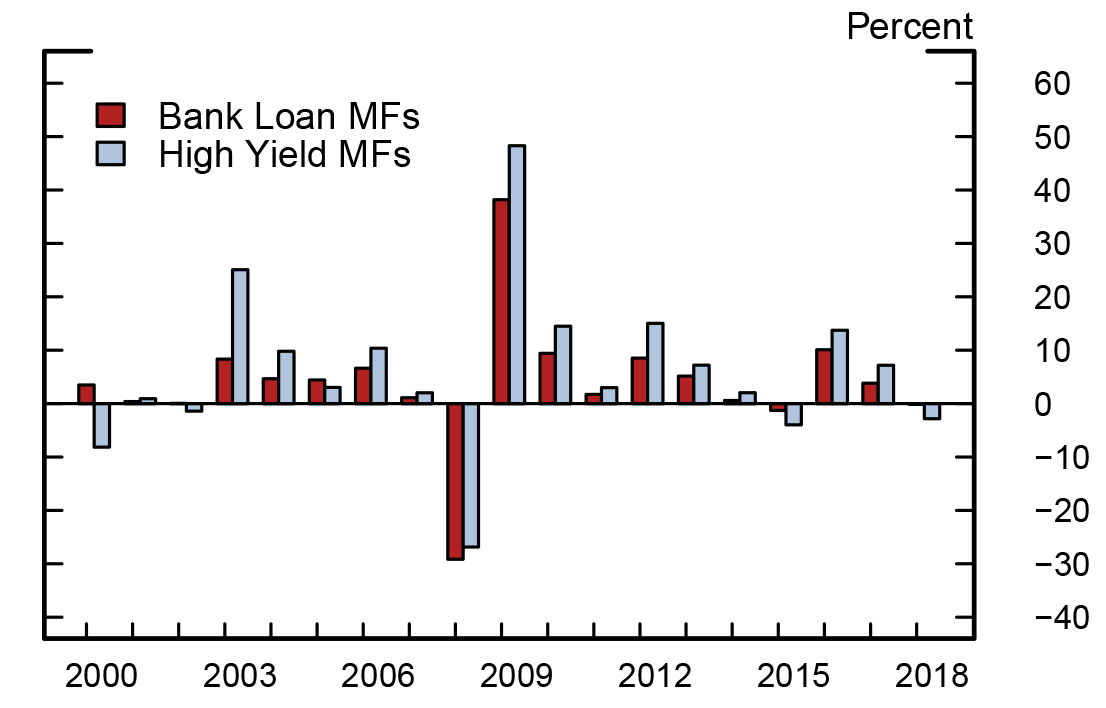
4.2 HY MFs consistently outperformed BL MFs.
Figure 6 presents BL and HY annual MF returns over time. These returns are net of fees and expenses and are asset-weighted averages of the underlying fund level returns. As shown in figure 6, BL MFs have lagged HY MF performance for most of the calendar years covered in the analysis.13. Both investment strategies experienced their worst year in 2008, with BL MFs producing a negative 29 percent annual return, and with HY MFs delivering negative returns in the order of 27 percent. Following the burst of the crisis, performance rebounded strongly in 2009 with BL and HY MF returns reaching their highest levels at about 38 percent and 48 percent, respectively. In looking at the return correlation between BL and HYB MFs, monthly correlation increased notably in the post-crisis period (June 2009 to the end of year 2018) to 0.9, from 0.6 in the pre-crisis period (2000 to December 2007).
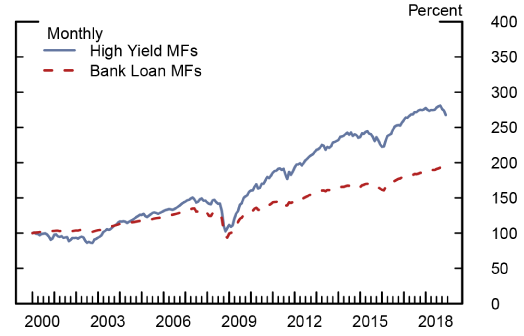
To further illustrate how BLs performed relative to HY bonds, figure 7 shows the evolution of $100 dollars invested in the BL and HYB portfolios that include all the funds in our MF universes. As depicted in figure 7, while $100 invested in the BL benchmark at the end of 2001 delivered about $200 at the end of 2018, $100 invested in the HY benchmark returned close to $300 over the same period. This relative underperformance of BL funds is consistent with the lower volatility of BL MF returns.14 Specifically, HYB MFs experienced higher return volatility on average than BL funds. Over the 2000-18 period, HYB funds monthly volatility stands at 2.2 percent on average, while that of BL funds is close to 1.3 percent.
- Concluding Remarks
This note documents the characteristics and trends of mutual funds investing primarily in BL and HY bonds MFs over the 2000-18 period. We show that AUM of both BL and HY MFs grew at a strong pace during the post-crisis years, driven by positive performance, net inflows and new funds entering the high yield space. We also document that BL MFs have underperformed HY MFs over the period and that BL net flows as a share of assets have been larger and more volatile than those experienced by HY MFs. Going forward, although HY MFs tend to be associated with lower liquidity risk and greater potential for price appreciation, BL MFs may continue to be an attractive alternative to investors seeking to minimize interest rate risk in the high yield space.
Future analysis could build on recent work on MF liquidity transformation and explore in detail the case of bank loan MFs, analyzing the potential price impact of large redemptions on investors' portfolios, as well as the financial stability implications at the aggregate level.
1. This note is based on our working paper "Leveraged Bank Loan versus High Yield Bond Mutual Funds". The analysis and conclusions set forth are our own and do not reflect the views of the Board of Governors or the staff of the Federal Reserve System. Return to text
2. We are very grateful to Min Wei, Dan Li, Chuck Press and Zack Saravay for their insightful comments. Return to text
3. In the case of BLs, financial information related to the loan arrangement is generally only fully disclosed to the lenders and or potential investors. Return to text
4. Morningstar, Inc. Morningstar Direct, http://corporate.morningstar.com/US/asp/subject.aspx?xmlfile=40.xml. Return to text
5. The sample also excludes fund of funds. Return to text
6. Funds may also manage liquidity through internal portfolio construction by holding a larger share of their portfolios on highly liquid assets, managing liquidity at the firm level, or expanding their credit lines, among other tools. Return to text
7. It is not possible to subset only fixed-income and cash instruments in the Morningstar feed; however the allocation variables confirm that there is not a significant amount of cash offsetting BL and HYB funds fixed-income allocations.. Return to text
8. This rating breakdown is performed using Morningstar's credit quality variables. Missing represent the share of AUM that were not classified by MD. Return to text
9. For BL, these estimates are computed as the share of leveraged loans in BL MFs relative to the total assets of institutional leverage loans outstanding reported by S&P/LSTA by way of Thomson Reuters. A similar approach is applied to estimate the share of HY securities held by HYB MFs, where total HY corporate bond outstanding is from Mergent's FISD. Return to text
ergent, Inc. Fixed Investment Securities Database (FISD).
Thomson Reuters LPC. Dealscan and LoanConnector, http://www.loanconnector.com/loanconnector/LPC_LC2_SecurID.html.
10. CLOs have historically been the largest player in the institutional leveraged loan market. Return to text
11. For more information see Appendix B, figures B.3 and B.4, where we create a range for these estimates. Return to text
12. Early 2019 data shows that these outflows rebound but remain negative on net. Return to text
13. This result is also consistent with benchmark returns for both BL and HYB markets. Return to text
14. Market commentary had also related BL MFs' lower returns relative to those of HYB funds to the negative convexity of bank loans, which can be callable at par at any time, and therefore their upside potential for price appreciation tends to be capped during bull markets. Return to text
Banegas, Ayelen, and Jessica Goldenring (2019). "The Universe of Leveraged Bank Loan and High Yield Bond U.S. Mutual Funds," FEDS Notes. Washington: Board of Governors of the Federal Reserve System, August 2, 2019, https://doi.org/10.17016/2380-7172.2394.
Disclaimer: FEDS Notes are articles in which Board staff offer their own views and present analysis on a range of topics in economics and finance. These articles are shorter and less technically oriented than FEDS Working Papers and IFDP papers.