FEDS Notes
February 18, 2022
What Happens When Banks Tighten C&I Loan Supply?
Andrew Castro, David Glancy, Felicia Ionescu, and Greg Marchal1
Introduction
The supply of bank credit is an important driver of macroeconomic outcomes, with significant implications for employment and output (Basset et al., 2014; Chodorow-Reich, 2014). However, studying credit supply is not straightforward for several reasons. First, credit supply is a multidimensional concept, encapsulating numerous decisions, such as: Who gets credit? How much? At what terms? Second, supply is not usually directly observable. While we may observe changes in loan volumes, it is difficult to determine whether such movements are driven by supply or demand.
In this note, we use confidential survey data on banks' changes in loan terms and standards to study how various loan outcomes are affected by changes in credit supply. Banks report such changes along numerous dimensions, allowing us to construct a summary index representing the variety of ways in which banks may change supply. We then combine this information on bank underwriting decisions with data on aggregate portfolios and loan level originations to investigate how changes in loan supply affect credit outcomes, in particular loan volumes and terms. We demonstrate that loan balance growth slows, and loan rates and collateralization requirements rise, in the year following a contraction in the supply of commercial and industrial (C&I) loans, controlling for factors that may simultaneously influence the demand for such loans.
Data and Methodology
We measure the supply of C&I credit using banks' responses to questions from the Federal Reserve's Senior Loan Officer Opinion Survey (SLOOS).2 Specifically, we construct a summary index at the bank-quarter level using banks' self-reported changes in C&I loan terms or standards. We then use balance sheet data from Call Reports, and loan level originations data from the Y-14Q, to assess how changes in supply affect loan outcomes.3
SLOOS questions ask banks to report changes in the supply of C&I credit along numerous dimensions: (i) standards for approving loans, (ii) maximum sizes of credit lines, (iii) maximum maturity of credit lines, (iv) costs of credit lines, (v) loan spreads, (vi) risk premiums, (vii) loan covenants, (viii) collateralization requirements and (ix) the use of interest rate floors.4 For each of these questions, we create a net tightening variable taking the value of 1 if a standard or term tightened "somewhat" or "considerably", 0 if it was "basically unchanged," and -1 if it eased "somewhat" or "considerably."
Banks rarely tighten a single term in isolation. For example, if banks decide to require higher spreads for higher loan-to-value (LTV) loans, this could entail higher loan spreads (for a given LTV), higher risk premia (higher spreads for riskier loans), smaller loan sizes (for a given spread and collateral value), and tighter collateral requirements (for a given loan rate and loan size). It is therefore unsurprising that responses to questions about terms and standards are highly correlated. We take the first principal component of the set of net tightening variables to create a single summary index measuring changes in C&I loan supply from each bank in our sample.5
With this bank-quarter measure of changes in the supply of C&I credit in hand, we then investigate what happens when banks tighten credit. We estimate the equation:
$$$$\Delta y_{b,t} = \beta \text{Tightening Index}_{b,t} + \gamma \text{Demand}_{b,t} + \tau_t + \varepsilon_{b,t}$$$$
Where $$\text{Tightening Index}_{b,t} $$ is the first principal component for the set of term-specific net tightening variables as reported by bank $$b$$ in quarter $$t$$, normalized to have unit variance. $$\text{ Demand}_{b,t} $$ is a variable measuring the net change in C&I loan demand in that quarter (1 for stronger, 0 for unchanged, -1 for weaker), and $$\tau_t$$ is a quarter fixed effect. The inclusion of the quarter fixed effect means that $$\beta$$ reflects the effect of an idiosyncratic change in standards, that is, a change relative to other banks. Finally, $$\Delta y_{b,t}$$ is the outcome variable of interest, for example, the growth in outstanding C&I loan balances over the following year.
This work builds on a large existing literature using SLOOS responses to measure credit supply. For example, Lown & Morgan (2006), Bassett et al. (2014), and Haltenhof et al. (2014) all construct aggregate measures of the shares of banks tightening standards and show that those indexes are predictive of economic activity. Broadly speaking, we make two departures from this work. First, instead of focusing solely on lending standards, we measure credit supply based on the full array of standards and terms that banks report about in the SLOOS. Second, we focus on the cross-section of banks rather than the time series. In other words, this note asks what happens when banks tighten relative to other banks, instead of what happens when banks are tightening in aggregate.6 We demonstrate that this broader measure of credit supply is useful; the tightening index is more predictive of subsequent changes in loan balances than reported changes in standards alone.
Changes in Bank Credit Supply and C&I Loan Growth
Table 1 presents the results of regressing C&I loan growth on the tightening index and the reported change in C&I loan demand for the period from 1990 to 2019. The estimates in column 1, which omits the quarter fixed effects, imply that a one standard deviation increase in the tightening index is associated with a 3.13 percentage point drop in C&I loan growth in the following year.
Columns 2 and 3 add macroeconomic controls and quarter fixed effects to the specification, respectively.7 The predicted effects of tightening decline when these aggregate developments are accounted for, indicating that banks tend to tighten during times of stress, when balances would fall even without a change in supply conditions. However, the coefficient on the tightening index is still economically and statistically significant. A one standard deviation greater tightening reduces C&I loan balances by 1.2 percent relative to other banks over the same time.
In column 4, we add the reported change in standards to our specification. This approach allows us to assess whether the tightening index—which accounts for reported changes in loan terms and standards—adds information beyond what is reflected in the standards measure. The coefficient on standards is negative, indicating that tighter standards are associated with weaker growth even when controlling for the broader index, but it is not statistically significant.8 The coefficient on the tightening index edges down when standards are included but remains statistically significant. These results indicate that the tightening index, by accounting for changes to both terms and standards, improves the measurement of loan supply compared to using standards alone.
Lastly, column 5 shows that the effects on loan growth are asymmetric. The specification includes a term that interacts the tightening index with an indicator for whether the index is greater than 0, denoted Tightening Index+. A one standard deviation tightening is predicted to reduce C&I loan growth by 2.2 percent relative to a bank at the mean, whereas a one standard deviation easing is only predicted to increase growth by 0.3 percent. Thus, tightening tends to have a much stronger effect on loan growth than easing.
In all these regressions, reported increases in demand are associated with stronger C&I loan growth. In column one, we find that when banks report that demand strengthened, C&I loan growth is on average 3.3 percentage points higher in the following year. This relationship drops to around two percentage points when we include macroeconomic variables and quarter fixed effects (columns 2 and 3) but remains statistically significant.
Table 1: Effect of Tightening on C&I Loan Growth
| (1) | (2) | (3) | (4) | (5) | |
|---|---|---|---|---|---|
| Tightening Index | -3.13** | -1.70** | -1.22** | -1.05* | -0.32 |
| (0.31) | (0.35) | (0.39) | (0.47) | (0.59) | |
| Demand | 3.28** | 2.17** | 1.88** | 1.87** | 1.87** |
| (0.45) | (0.41) | (0.43) | (0.43) | (0.43) | |
| Standards | -0.53 | ||||
| (0.69) | |||||
| Tightening Index+ | -1.91* | ||||
| (0.92) | |||||
| Qtr FE | X | X | X | ||
| Macro Vars | X | ||||
| Banks | 171 | 171 | 171 | 171 | 171 |
| Obs. | 6494 | 6494 | 6494 | 6494 | 6494 |
How do these effects vary over time? The previous results assessed the effects of credit conditions on growth over the subsequent year. We now estimate a set of regressions to trace out the effects of changes in supply and demand over different time horizons:
$$$$ln(\text{C&I Loans})_{b,t+h}-ln(\text{C&I Loans})_{b,t}=$$$$
$$$$\beta^{h} \text{Tightening Index}_{b,t}+\gamma^{h} \text{Demand}_{b,t} +\tau^{h}_t+\epsilon^{h}_{b,t},\ \ h\in\{-6,...6\}$$$$
Figure 1 plots the dynamics for C&I loan balances around a reported tightening in supply (left) and increase in demand (right). When the tightening index increases by one standard deviation, C&I loan balances edge down in the following quarter. Balances then progressively decline over the next year and are down about 2 percent 6 quarters after tightening. Meanwhile, when banks report an increase in demand, there is an immediate one percentage point jump in C&I loan balances in the following quarter. This is likely a result of most C&I commitments being lines of credit rather than term loans. An increase in demand will be associated with more draws immediately, causing balances to rise. However, tightening standards will mean fewer commitments being made at the time of tightening, followed by a slow decline in balances as other loans mature or payoff.
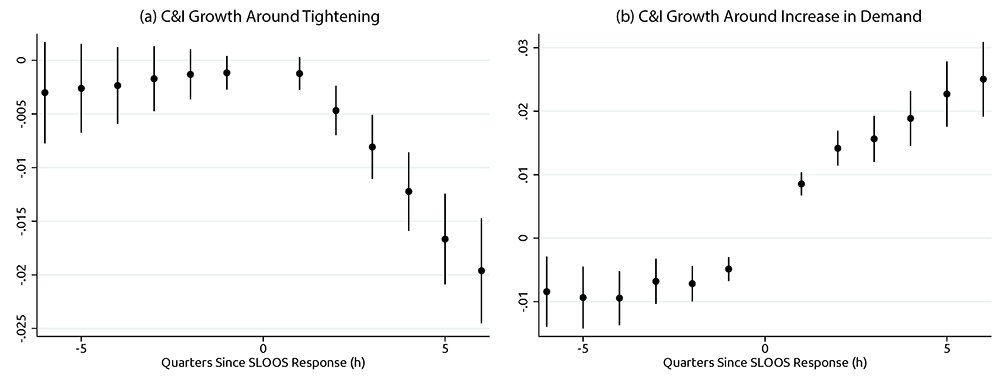
Note: This figure plots the regression coefficients from:
$$ln(\text{C&I Loans})_{b,t+h}-ln(\text{C&I Loans})_{b,t}=\beta^{h} \text{Tightening Index}_{b,t}+\gamma^{h} \text{Demand}_{b,t} +\tau^{h}_t+\epsilon^{h}_{b,t}$$
by time horizon $$h$$. The charts plot point estimates and 90% confidence intervals for $$\{\beta^{h}\}$$, reflecting trends in C&I loan volumes around a one standard deviation tightening, on the left, and $$\{\gamma^{h}\}$$, reflecting trends in C&I loan volumes for banks reporting that demand increased relative to bank reporting demand as unchanged, on the right. The sample covers period from 1990 to 2019.
Source: Call Reports, SLOOS.
Changes in Bank Credit Supply and Terms on New Originations
The previous results highlight that changes in banks' C&I terms and standards significantly affect the volume of loans. While some of the terms and standards included in the tightening index directly relate to loan volumes (e.g. standards affect how many firms can get loans, and maximum sizes affect how large those loans are), others may relate more to loan terms or borrower characteristics. We use Y-14Q data to investigate how the average characteristics of new originations shift in the quarters after a bank changes supply.
Figure 2 plots changes in the average terms on new loan originations around reported changes in bank supply. These estimates are based on specifications equivalent to those in Figure 1 except the dependent variables now reflect changes in loan terms instead of volumes. The left panel in figure 2 plots developments in the average loan rate for new commitments in a quarter (weighted by the size of loan commitments), while the right panel shows the change in the share of commitments that are secured with a first lien.
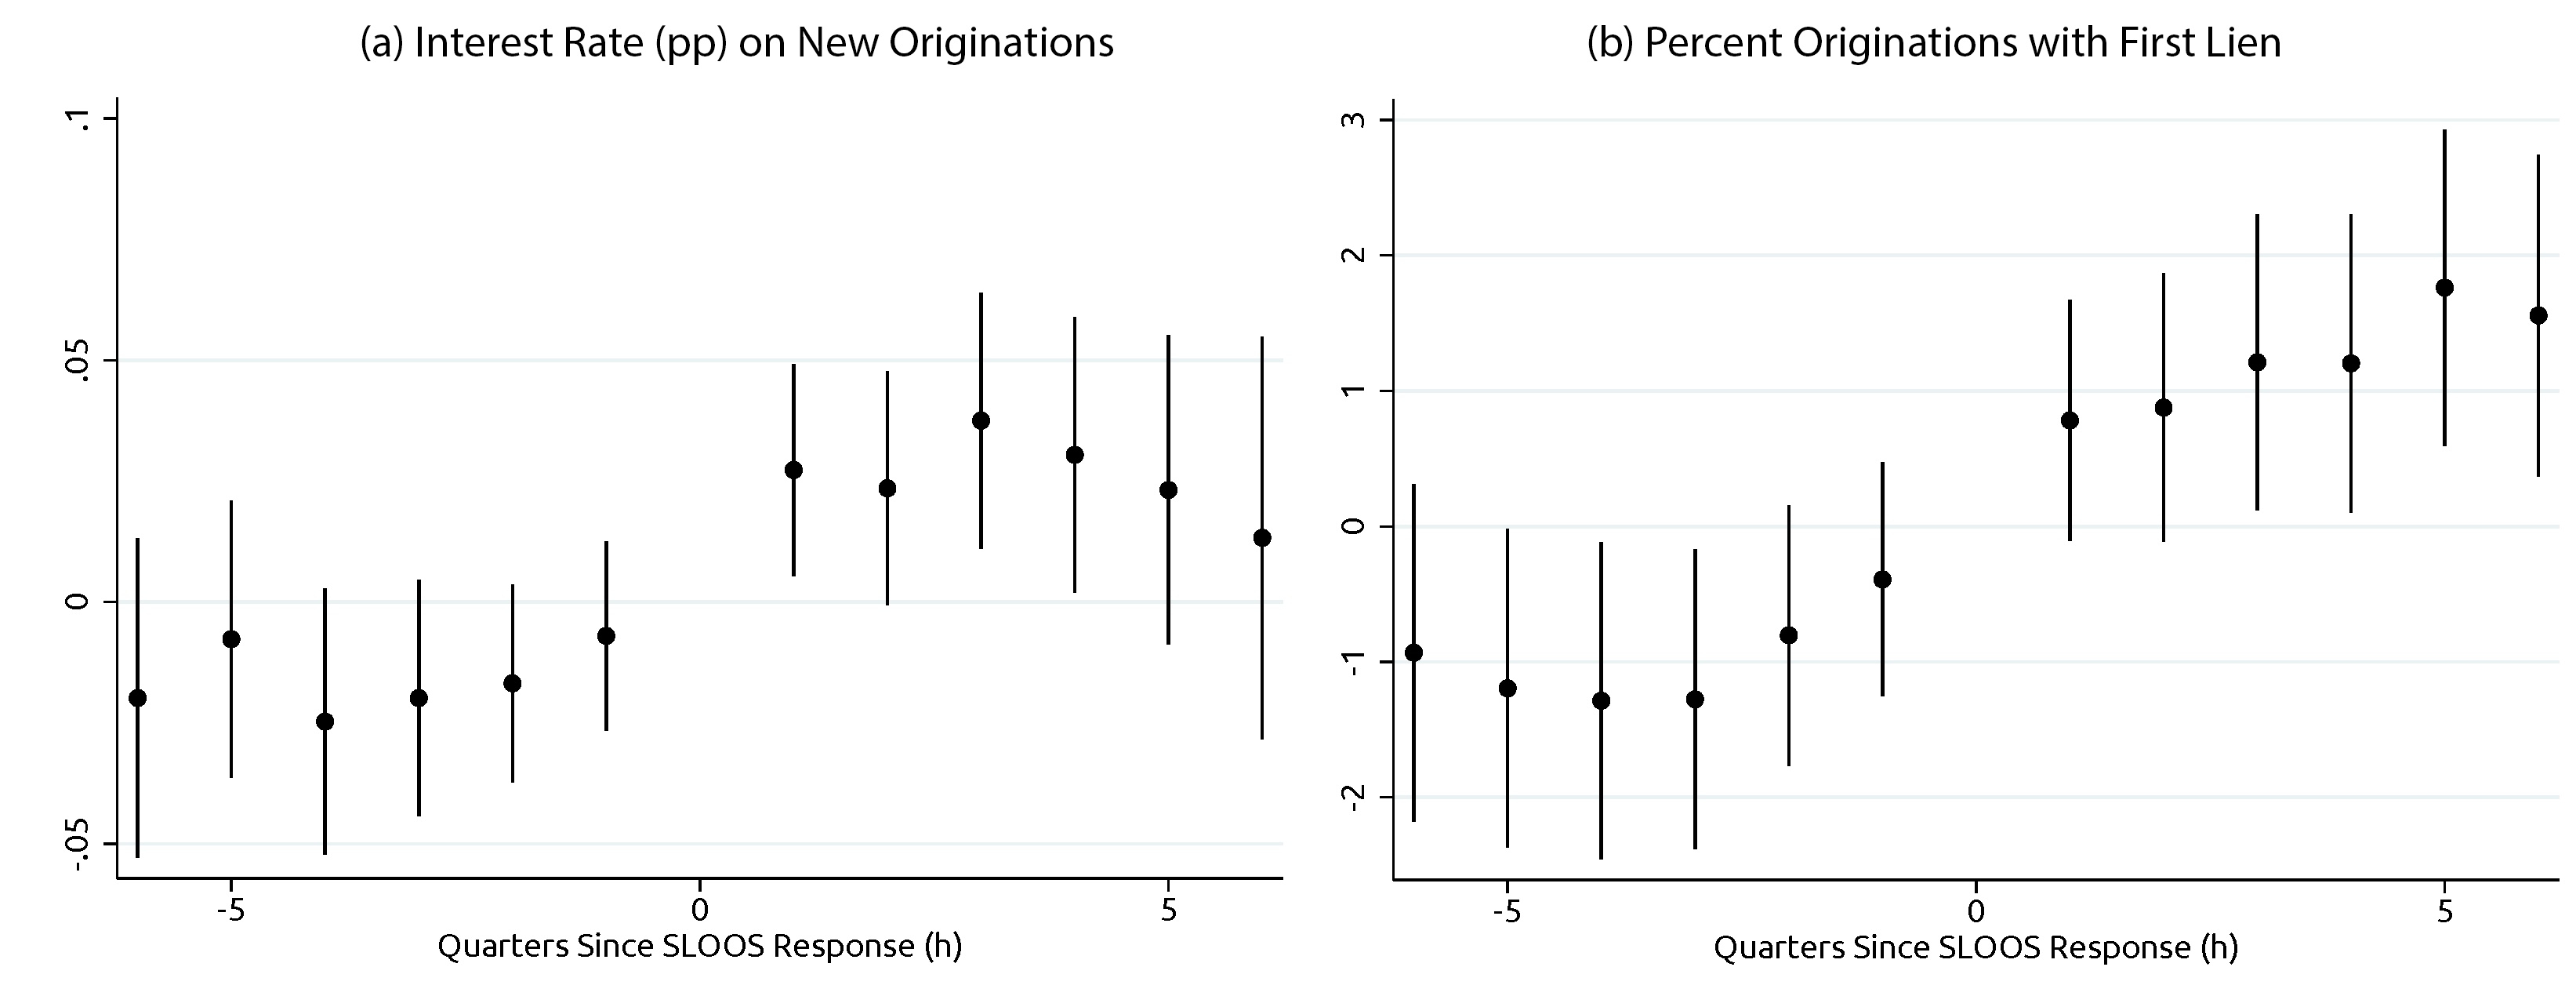
Note: This figure plots the regression coefficients from:
$$y_{b,t+h}-y_{b,t}=\beta^{h} \text{Tightening Index}_{b,t}+\gamma^{h} \text{Demand}_{b,t} +\tau^{h}_t+\epsilon^{h}_{b,t}$$
by time horizon $$h$$. Each figure plots point estimates and 90% confidence intervals for $$\{\beta^{h}\}$$, where $$y$$ is the commitment-weighted average interest rate on originations in percentage points (left) or the percent of new commitments with a first lien on the collateral (left). The sample covers period from 2012 to 2019.
Source: Y-14Q, SLOOS.
A one standard deviation increase in the tightening index results in about a 3 bp increase in loan rates for new originations in the following quarter, with interest rates on new loans remaining elevated over the following year. This increase in rates is driven by an increase in the average pricing of loans by the banks in a quarter instead of a shift to borrowers or terms that tend to carry higher interest rates on average.9 This result is consistent with a pure shift in supply (tightening is associated with higher loan rates and lower loan volumes) rather than a major shift in the composition of borrowers or terms. A caveat to our analysis is that the sample period for the Y-14 data covers 2012-on, a period during which loan performance remained strong. It is possible that there would be more notable shifts in other characteristics in a less benign credit environment.
One loan characteristic we do see change significantly is in collateral. The portion of commitments secured by a first lien on collateral rises by almost 2 percentage points in the quarters following a one standard deviation tightening in supply. This change is mostly driven by a decline in unsecured lending.
We further studied effects on other terms, and we found they did not change significantly. Specifically, tightening was not associated with a significant change in the shares of originations going to small firms, existing customers, or borrowers with an investment-grade-equivalent risk rating. Nor was tightening associated with changes in the average duration of loans or the shares of new commitments that were term loans.10
Conclusion
To conclude, our study sheds light on the effects of changes in bank credit supply, accounting for the numerous dimensions of such changes. In particular, we use banks' responses to the SLOOS regarding changes in standards and terms for C&I loans to construct a supply summary index. Consistent with this measure reflecting the supply of credit, tighter lending conditions are associated with slower growth over the following year and higher interest rates on new originations. We generally do not observe large shifts in the composition of new originations in terms of loan or borrower characteristics, though banks do less unsecured lending after tightening supply.
References
Bassett, William F., Mary Beth Chosak, John C. Driscoll, and Egon Zakrajsek. 2014. "Changes in Bank Lending Standards and the Macroeconomy." Journal of Monetary Economics 62: 23–40.
Chodorow-Reich, G. 2014. "The employment effects of credit market disruptions: Firm-level evidence from the 2008–9 financial crisis." The Quarterly Journal of Economics, 129(1), 1-59.
Herkenhoff, Kyle. 2019. "The Impact of Consumer Credit Access on Unemployment." The Review of Economic Studies, Volume, 86, Issue 6, 2019, pages 2605-2642
Lown, Cara, and Donald P. Morgan. 2006. "The Credit Cycle and the Business Cycle: New Findings Using the Loan Officer Opinion Survey." Journal of Money, Credit & Banking (Ohio State University Press) 38: 1575–1597.
Appendix
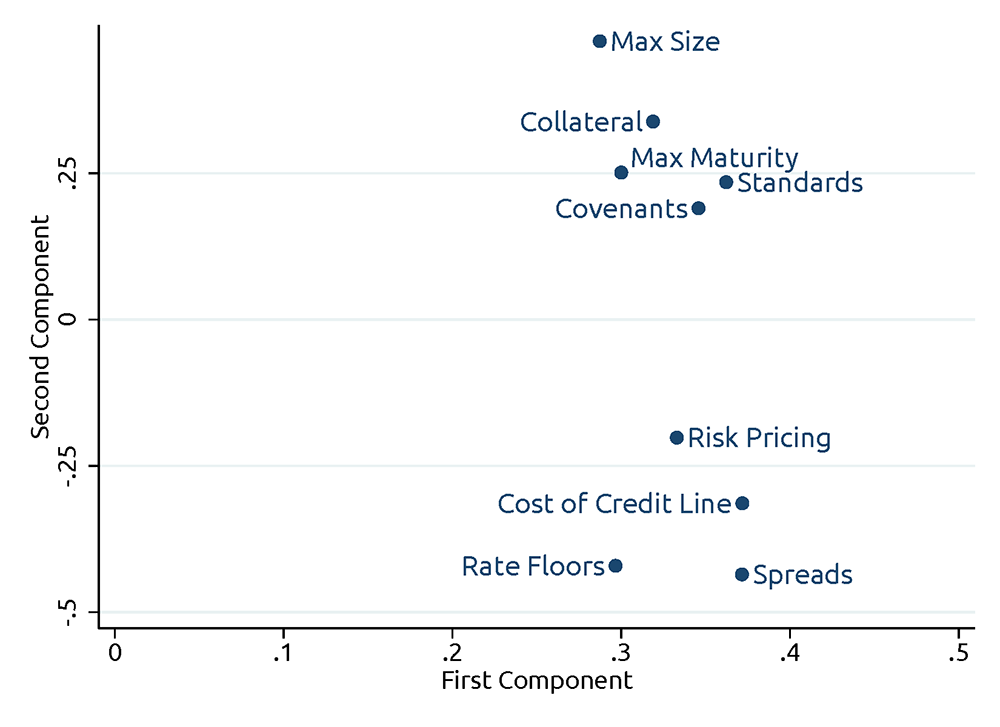
Note: This figure plots the loadings placed on the various questions about credit standards and loan terms when constructing the summary measure of changes in credit supply. The loadings for the first principal component are on the x-axis, and loadings for the second principal component are on the y-axis.
Source: SLOOS.
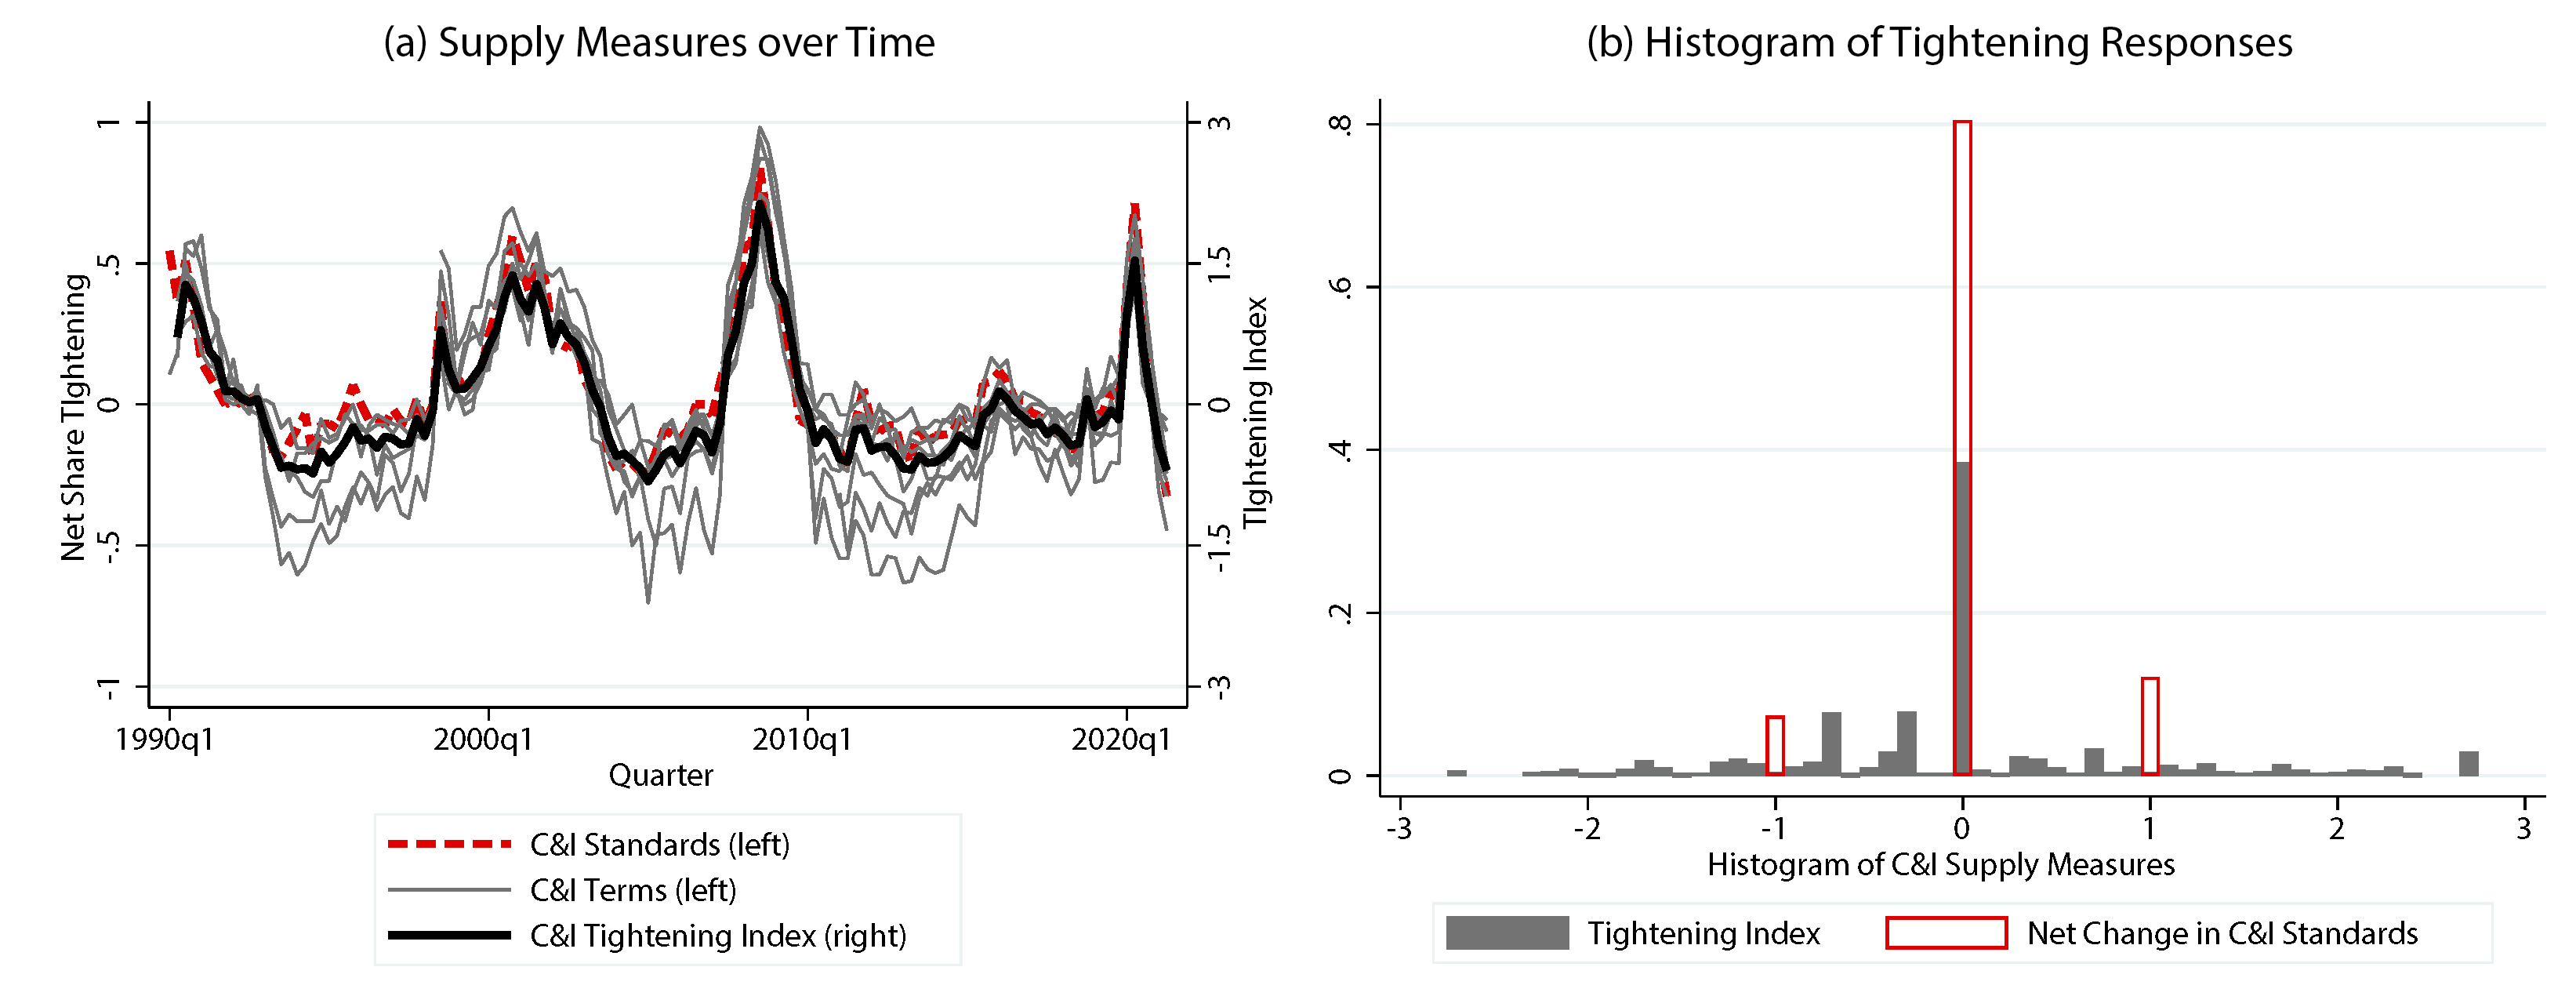
Note: The left chart plots averages across banks within a quarter for the tightening index (black), the net change in standards (red) and the net change in various terms (grey), over time. The right chart plots a histogram of the reported changes in standards and the tightening index.
Source: SLOOS.
1. Andrew Castro, David Glancy, and Felicia Ionescu are in the Division of Monetary Affairs at the Federal Reserve Board of Governors. Greg Marchal is at Michigan State. This note reflects the views of the authors and should not be interpreted as reflecting the views of the Board of Governors of the Federal Reserve System. Return to text
2. The Senior Loan Officer Opinion Survey on Bank Lending Practices is a quarterly survey of banks which inquires about changes in supply or demand for various categories of loans. A typical survey has about 70 banks responding, accounting for about 70% of assets of domestically chartered institutions. The questions analyzed in this note date back to 1990, when the survey in its modern form began. Return to text
3. The Call Reports provide quarterly information on the balance sheets of the full universe of US banks and includes a wealth of information on banks' loan portfolios. Y-14 is the data underlying the stress tests of the largest U.S. banks. It is available starting in 2011 and covers loan commitments over $1 million from banks with over $50 billion in consolidated assets ($100 billion starting in 2018). However, Y-14 data contains detailed loan level information on loan terms and borrower characteristics. Return to text
4. Not all these questions were added at the same time. When analyzing Call Report data, we omit the net tightening variables pertaining to maximum maturity, risk premiums and interest rate floors so as to be able to construct the index back to 1990:Q1. When analyzing Y-14 data, which doesn't begin until 2011, we use the full set of terms when constructing the supply index. Return to text
5. The loadings plot of the principal component index is shown in the Appendix Figure 1. The first principal component generally reflects how much terms tighten on net overall, while the second principal component generally reflects whether banks tighten on price vs. non-price dimensions. As we are interested in tightening supply overall, rather than differences in the effects of tightening across terms, we focus on the first principal component, which is very highly correlated with an unweighted average of the 9 net tightening variables. Return to text
6. These two departures are related. In the time series, the cross-bank average of the tightening index moves almost in lockstep with the net share of banks tightening standards. (See Appendix Figure 2.a for the time series for the tightening index and changes in standards and terms). The merit of using the full set of terms that banks report changing is more apparent for the cross-sectional analysis. Unlike the standards measure, which takes on three discrete values, the tightening index provides a more granular measure of changes in credit supply and gives a sense of the intensity of tightening. Namely, a bank that tightens terms across the board is likely tightening supply more, something not well captured by the standards measure. Appendix Figure 2.b plots a histogram of banks' reported net change in standards and the tightening index, demonstrating that the tightening index provides much more variation. Return to text
7. We follow Bassett et al. (2014) and control for the expected year-ahead growth in real GDP, unemployment, 3-month Treasury rate and 10-year Treasury yield from the Survey of Professional Forecasters; the changes in real GDP and the unemployment rate over the previous year; and the quarterly changes in the real federal funds rate, the excess bond premium and the VIX. Return to text
8. The predicted effect of standards on loan growth is about four times larger when the control for the tightening index is excluded. Return to text
9. To determine this, we regress interest rates on loan terms, borrower fixed effects and bank-quarter fixed effects to decompose interest rates at origination into what can be explained by risk characteristics (firms fixed effects and the pricing of loan terms) and bank pricing (bank-quarter fixed effects). We then aggregate these components to the bank-quarter level and show that the increase in rates is reflected in the bank-quarter fixed effect rather than the risk characteristics of loans. Return to text
10. The shorter time horizon and smaller sample of banks covered by the Y-14 data causes the estimates to be noisy, thus we cannot rule out economically meaningful changes in these variables as a result of tightening supply. Return to text
Castro, Andrew, David Glancy, Felicia Ionescu, and Greg Marchal (2022). "What Happens When Banks Tighten C&I Loan Supply?," FEDS Notes. Washington: Board of Governors of the Federal Reserve System, February 18, 2022, https://doi.org/10.17016/2380-7172.3058.
Disclaimer: FEDS Notes are articles in which Board staff offer their own views and present analysis on a range of topics in economics and finance. These articles are shorter and less technically oriented than FEDS Working Papers and IFDP papers.