FEDS Notes
June 25, 2020
Who Owns U.S. CLO Securities? An Update by Tranche
Laurie DeMarco, Emily Liu, Tim Schmidt-Eisenlohr
Against the backdrop of the COVID-19 crisis, leveraged loans have deteriorated and concerns about collateralized loan obligations (CLOs), the main buyers of loans on the secondary market, have increased. These concerns have reduced the demand for new CLOs, making it harder for firms to borrow through leveraged loans on the primary market (see Figure 1), as banks have found it more difficult to sell loans on the secondary market. Prices for leveraged loans on the secondary market have declined sharply (see Figure 2), mirroring declines in CLO prices (not shown).1
A key question is which investors would face losses if conditions deteriorated further and some CLOs defaulted on their more junior tranches. A challenge in answering this question has been a lack of systematic data of CLO ownership by type of investor and tranche, particularly for institutions other than banks.
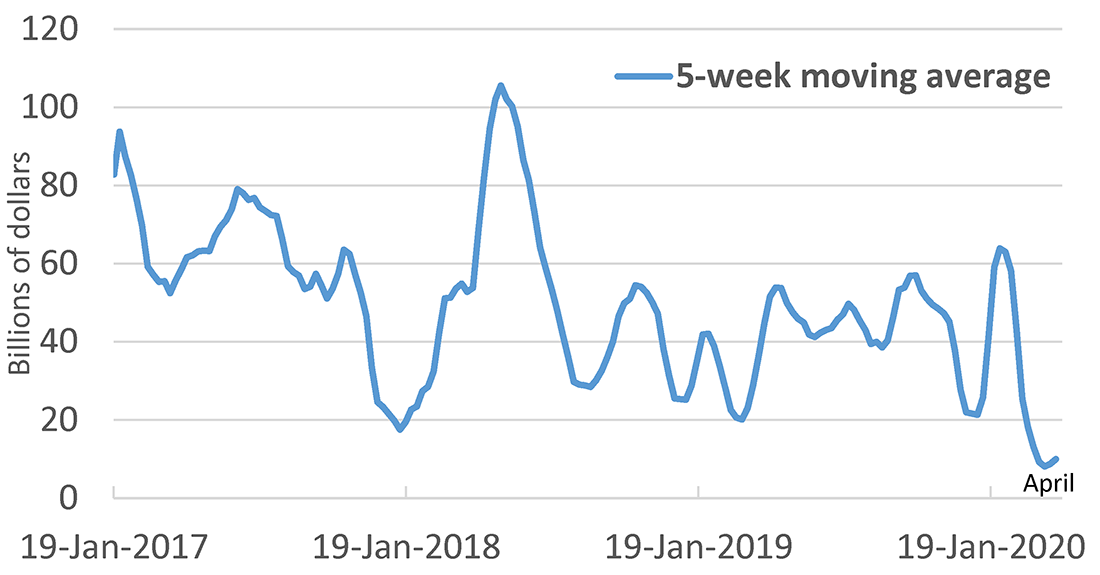
Source: Refinitiv, Dealscan and LoanConnetor, http://www.loanconnector.com/loanconnector/LPC_LC2_SecurID.html
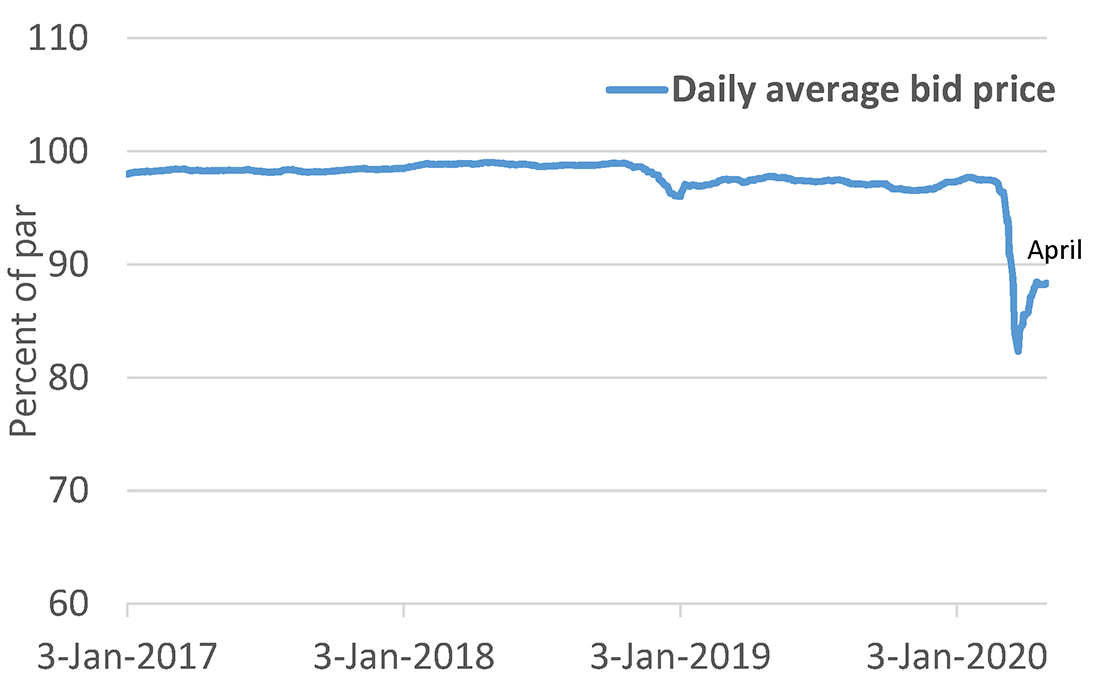
Source: Refinitiv, LSTA/LPC Mark-to-Market Pricing and Euro Pricing Service (daily observations, delivered annually), https://www.loanpricing.com/products/solutions-for-the-secondary-market/global-loan-pricing-services/lstalpc-mark-to-market-pricing-service/
This note fills this gap, providing estimates on the ownership of CLOs by investor type and tranche based on our analysis of Treasury International Capital (TIC) data on securities holdings in combination with Moody's Analytics Global CLO Data. This note expands on the earlier analysis in our 2019 FEDS Note, "Who Owns U.S. CLO Securities?", including providing revised estimates on the share of CLOs held by U.S. residents and across different investor types.2 Our new data suggest that institutional investors have sizable exposures to risky CLO tranches, which appear to be larger than what market participants believe.
CLO Tranches and Risk
CLOs have a waterfall payout structure and typically distinguish (in order of safety) between senior notes, mezzanine and junior notes, and equity notes. In case of loan defaults, losses are first borne by equity holders, followed by the holders of the other notes in order of seniority. Due to diversification requirements for CLOs, the majority of notes are senior and are AAA-rated. Equity notes typically represent less than 10 percent of a CLO. For this reason, if a CLO faces major losses, it is plausible that these would extend to holders of mezzanine and junior notes.
Holdings of CLOs by Investor Types
We estimate that U.S investors hold the vast majority, almost 80 percent, of outstanding U.S. CLO securities.3 We also estimate that institutional investors (insurance companies, mutual funds, and pension funds) and banks hold about three quarters of U.S. CLO securities owned by U.S. residents (Table 1). Insurance companies alone account for about one third of U.S. residents' holdings.4
Table 1: Domestic holdings of Cayman-issued U.S. CLO securities, by investor type as-of December 2018
Millions of dollars
| Investor Type | 2018 | |
|---|---|---|
| Insurance Company | 111,610 | 32.9% |
| Mutual Fund | 61,537 | 18.1% |
| Depository Institution | 61,204 | 18.0% |
| Other Financial Organizations (incl. Bank Holding Companies) | 35,353 | 10.4% |
| Nonfinancial Organizations (incl. household) | 27,338 | 8.1% |
| Pension Fund | 22,359 | 6.6% |
| Fund or Other Investment Vehicle | 20,182 | 5.9% |
| Total Domestic Holdings | 339,584 | 100.0% |
Source: TIC SHC(A) and Moodys Analytics, Global CLO data.
Holdings of CLOs by Tranche and Investor Type5
This note also incorporates the tranche-level data from Moody's.6 We find that the majority of holdings by banks (95.4 percent) are senior tranche securities, while the securities held by insurance companies represent a mix of both senior and mezzanine tranches (Table 2). Indeed, according to our data, just over half of the securities held by insurance companies are mezzanine- or equity-tranche securities.
Other institutional investors held a surprisingly large share of risky tranches as well. Of the U.S. CLO securities held by mutual funds, one third are mezzanine, junior, and equity tranche securities, as are nearly a quarter of those held by pension funds.
More than two thirds of holdings by funds or other investment vehicles were in mezzanine, junior, and equity tranches. This is less surprising, as this category of investor includes hedge funds that tend to hold riskier assets.
Table 2: Domestic holdings of Cayman-issued U.S. CLO securities, by investor type and tranche as-of December 2018
Millions of dollars
| Investor Type | Senior Notes | Mezzanine and Junior Notes | Equity Notes | Total* | |||
|---|---|---|---|---|---|---|---|
| Insurance Company | 53,687 | 49.3% | 53,491 | 49.1% | 1,086 | 1.0% | 108,885 |
| Mutual Fund | 39,408 | 66.4% | 12,476 | 21.0% | 7,411 | 12.5% | 59,343 |
| Depository Institution | 56,573 | 95.4% | 2,105 | 3.6% | 592 | 1.0% | 59,276 |
| Other Financial Organizations (incl. BHCs) | 20,569 | 60.4% | 9,010 | 26.5% | 4,353 | 12.8% | 34,064 |
| Fund or Other Investment Vehicle | 5,799 | 29.7% | 6,647 | 34.1% | 6,990 | 35.8% | 19,506 |
| Pension Fund | 16,946 | 76.6% | 4,938 | 22.3% | 240 | 1.1% | 22,132 |
| Nonfinancial Organizations (incl. household) | 9,937 | 38.8% | 9,944 | 38.8% | 5,251 | 20.0% | 25,638 |
| Total holdings identified by tranche | 202,918 | 61.8% | 98,612 | 30.0% | 25,923 | 7.8% | 328,846 |
To summarize, our new data suggest that institutional investors have sizable exposures to risky CLO tranches. These risky holdings appear to be larger than what market participants believe. For example, analysis by Fitch Ratings shown in Table 3 suggests that pension funds only held AAA-rated notes.
Table 3: CLO Investors by Tranche
| AAA Notes | Mezzanine Notes | Equity |
|---|---|---|
| Insurance Companies | Hedge Funds | Private Equity |
| Foreign Banks | Asset Managers | CLOs |
| Pension Funds | Insurance Companies | Credit Opportunity Funds |
| U.S. Regional Banks | CLOs | CLO Managers |
| U.S. Investment Banks |
Source: Fitch Ratings Leveraged Finance Annual Manual for the Americas, May 2017
Appendix:
Calculating who owns U.S. CLOs
Because U.S. CLO notes are frequently issued by Cayman-resident entities, these securities are considered foreign under the TIC data definitions and are reportable on several of the TIC reports (see figure 3). All holdings of such Cayman-issued securities by U.S. investors are reportable on the TIC SHC/SHCA (annual survey of foreign securities claims of U.S. residents). Conversely, any securities issued by a CLO entity incorporated in the United States and held by foreign investors are reportable on the TIC SHL/SHLA (annual survey of U.S. securities liabilities to foreigners). Because the TIC data only pick up cross-border claims and liabilities, any securities issued by a Cayman-incorporated CLO and held by foreign investors or any securities issued by a U.S.-incorporated CLO and held by domestic investors would not be reportable anywhere in the TIC system.
TIC data do not explicitly identify CLO securities. Our previous FEDS note utilized a string matching methodology to identify U.S. CLO securities in the TIC data among all Cayman Island issued securities. In this note, we instead identify CLO securities in the TIC data using security identifiers from Moodys' Global CLO Data, resulting in $329 billion. We also supplement these results with about $11 billion of securities in TIC that were identified as CLOs by the original string matching and that either were classified as asset-backed securities in the TIC data or were verified by hand from the TIC categories of bonds and preferred equity. These string-matched securities may not have a match in Moody's data due to the use of internal rather than standard security identifiers by some reporters in the TIC data or due to incompleteness of the Moody's data. The $329 billion from the Moody's match plus the additional $11 million from the original string match gives our total estimate of $340 billion.
Table 4 updates the appendix table from the earlier FEDS note using the new Moody's data-based methodology. This table shows slightly smaller holdings of U.S. CLO securities by U.S. investors and larger holdings by foreign investors.
Table 4: U.S. CLO Positions ($M)
Millions of dollars
| Date | U.S. CLOs Outstanding | U.S. loans underlying KY-issued CLOs | U.S. holdings of KY-issued CLOs* | Foreign holdings of U.S.-issued CLOs** | Estimated KY issues held by foreign investors† | Estimated U.S. issues held by U.S. investors‡ |
|---|---|---|---|---|---|---|
| 2018Q4 | 616,944 | 457,060 | 339,584 | 11,100 | 117,476 | 148,784 |
Tranches and Ratings
We display riskiness of holdings using tranche types because those are available from one source for the largest share of U.S. holdings of CLOs. However, ratings are more easily tied to price indices such as the J.P. Morgan CLO index (CLOIE). Using ratings first by Moodys, and then by S&P and Fitch where Moody ratings are not available, the tranches of U.S. holdings of Cayman-issued U.S. CLOs correspond to ratings as shown in Table 5. Ratings across the three rating schemes are reconciled and grouped into standardized ratings categories. Equity tranches generally do not have ratings available. We have ratings for about $300 billion of the $302 billion of CLOs for which we have tranche data and that are not equity tranches. Table 6 shows ratings by investor type for senior, mezzanine, and junior tranche types.
Table 5: Mapping between tranche type and ratings (Moody’s, S&P, or Fitch) for domestic holdings of Cayman-issued U.S. CLO securities
| Ratings Category | Senior Notes | Mezzanine Notes | Junior Notes |
|---|---|---|---|
| AAA | 99.6% | 1.0% | |
| AA | 0.0% | 45.5% | |
| A | 0.4% | 26.6% | 1.3% |
| BBB | 21.8% | 6.4% | |
| BB | 4.9% | 78.8% | |
| B and below | 0.1% | 13.5% |
Source: TIC SHC matched with Moody's Analytics Global CLO data plus authors' calculations.
Table 6: Domestic holdings of Cayman-issued U.S. CLO securities, by investor type and rating* as-of December 2018, excluding Equity tranches
Millions of dollars
| Investor Type | AAA | AA | A | BBB | BB | B and below | Total excluding equity tranches** |
|---|---|---|---|---|---|---|---|
| Insurance Company | 53,101 | 24,554 | 16,745 | 10,317 | 2,215 | 212 | 107,144 |
| Mutual Fund | 39,464 | 4,022 | 2,025 | 2,959 | 3,036 | 355 | 51,861 |
| Depository Institution | 56,479 | 1,276 | 349 | 18 | 106 | 16 | 58,244 |
| Other Financial Organizations (incl. BHCs) | 20,592 | 3,660 | 1,867 | 1,580 | 1,573 | 362 | 29,635 |
| Fund or Other Investment Vehicle | 5,809 | 2,083 | 1,063 | 1,996 | 1,357 | 153 | 12,462 |
| Pension Fund | 16,966 | 2,578 | 808 | 932 | 523 | 65 | 21,873 |
| Nonfinancial Organizations (incl. household) | 9,330 | 2,949 | 2,364 | 2,489 | 1,772 | 216 | 19,120 |
| Total holdings identified by rating | 201,741 | 41,121 | 25,222 | 20,291 | 10,583 | 1,381 | 300,339 |
1. If large enough, losses in CLO portfolios can trip liquidation triggers, resulting in forced sales of the underlying loans. Forced selling could further disrupt leveraged loan markets, making it even more costly for firms to borrow. Return to text
2. The previous note is Liu, Emily and Tim Schmidt-Eisenlohr (2019). "Who Owns U.S. CLO Securities?", FEDS Notes. Washington: Board of Governors of the Federal Reserve System, July 19, 2019, https://doi.org/10.17016/2380-7172.2423. Return to text
3. For this estimate, we identified CLO securities with the help of Moody's Analytics Global CLO Data, resulting in a smaller estimate of CLOs held by U.S. investors, $340 billion, relative to our 2019 FEDS note "Who Owns U.S. CLO Securities?". That note estimated that U.S. investors hold 90% of U.S. CLO securities, or $409 billion, utilizing a string matching methodology to identify U.S. CLO securities in the TIC data. See the appendix for an update to the earlier note's Table 3 and a detailed discussion of the change in methodology. Return to text
4. Relative to earlier findings reported in "Who Owns U.S. CLO Securities?", holdings are even more concentrated in insurance companies, banks, and mutual funds, with lower shares attributed to pension funds and "fund or other investment vehicle". Return to text
5. In appendix table 6, we report holdings of CLOs by rating and investor type instead. Return to text
6. For the tranche analysis, we only use the $329 billion of the $340 billion that comes from a direct match between TIC and Moody's data. Return to text
DeMarco, Laurie, Emily Liu, and Tim Schmidt-Eisenlohr (2020). "Who Owns U.S. CLO Securities? An Update by Tranche," FEDS Notes. Washington: Board of Governors of the Federal Reserve System, June 25, 2020, https://doi.org/10.17016/2380-7172.2592.
Disclaimer: FEDS Notes are articles in which Board staff offer their own views and present analysis on a range of topics in economics and finance. These articles are shorter and less technically oriented than FEDS Working Papers and IFDP papers.