FEDS Notes
January 08, 2020
Why Has Wage Growth Been Subdued in the Advanced Foreign Economies?
Stephen Lin1, Kaede Johnson2, and Tyler Powell1
In recent years, nominal wage growth has remained relatively subdued in a number of advanced foreign economies (AFEs), even as labor markets have tightened substantially. For example, as illustrated in Figures 1 and 2, the unemployment rate has fallen to low levels in the euro area and Canada, but wage growth in recent years (red dots) has, on average, been noticeably below what would be predicted by the historical relationship between wage growth and unemployment rates, the blue line.3
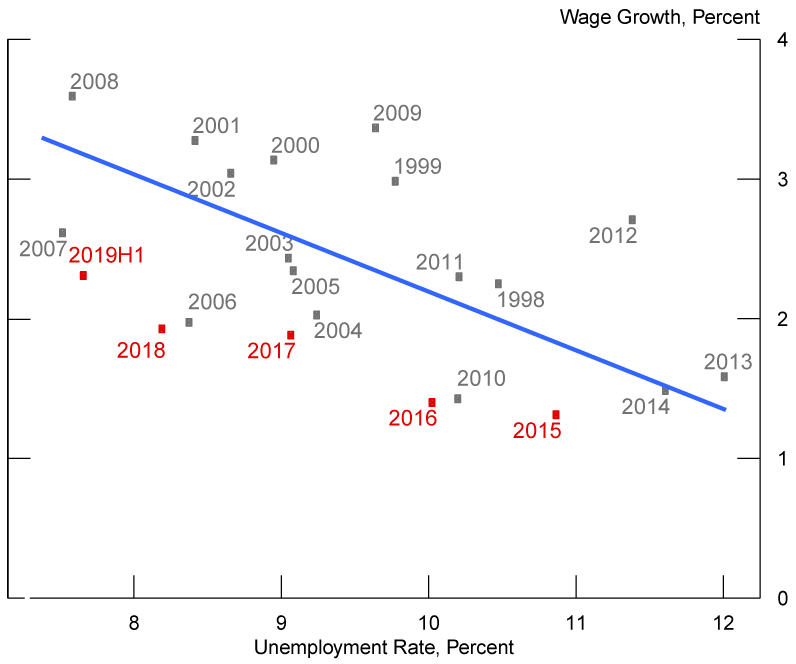
Source: OECD via Haver Analytics.
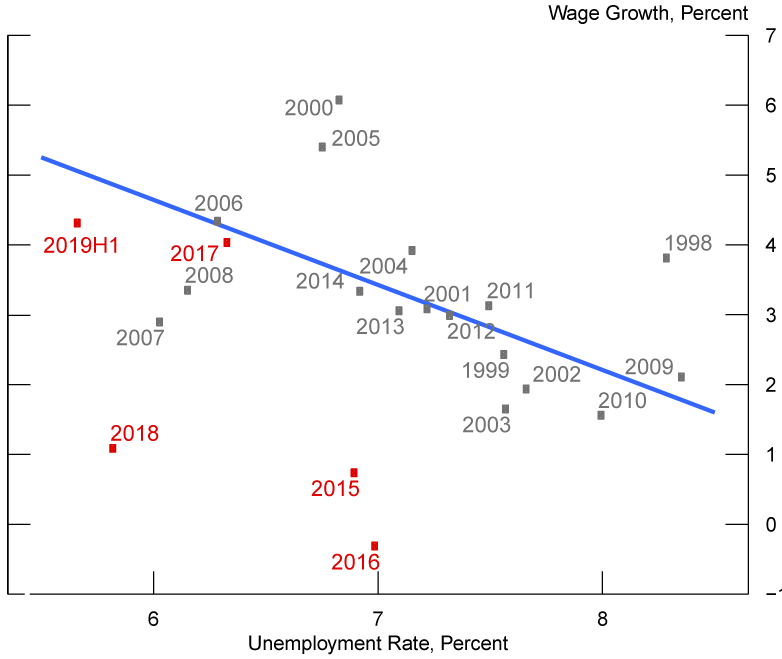
Source: OECD via Haver Analytics.
This apparent disconnect has prompted some observers to ask whether the wage Phillips curve – the empirical regularity that lower unemployment rates tend to be associated with higher wage growth -- is broken or even dead among advanced economies.4
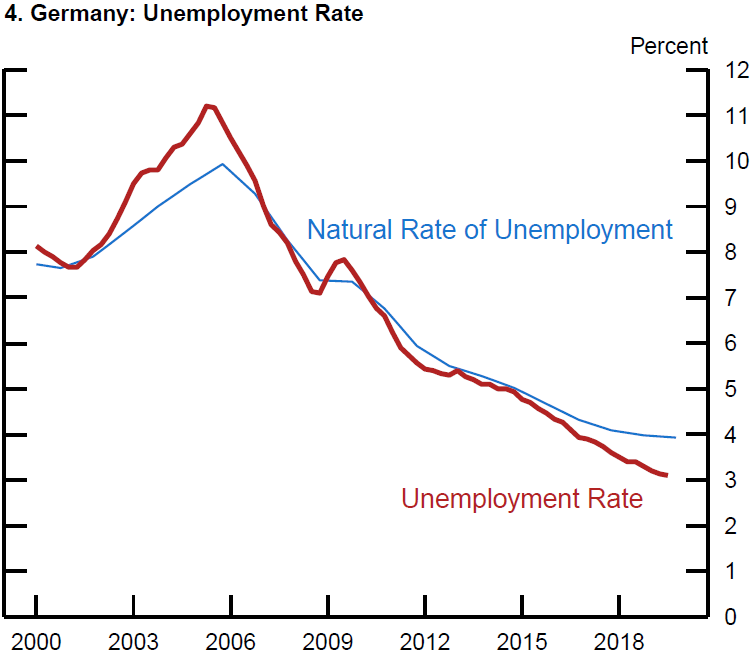
However, theory suggests a simple and stable negative relationship between actual unemployment and wage inflation only under the assumption that productivity growth, expected inflation, and the natural rate of unemployment are constant. Therefore, it is possible that lower unemployment rates are in fact putting some upward pressure on wages, but other factors are weighing on wages. First, in numerous AFEs, labor productivity has grown at a more subdued pace in recent years, as shown in Figure 3. This productivity slowdown is likely weighing on the growth of labor's marginal product and therefore wages. Second, inflation expectations have declined in some AFEs, most notably in the euro area. To the extent that firms and workers expect generally slower growth of prices across the economy, wages and the prices of other inputs would be expected to decelerate as well. Third, the estimated natural rate of unemployment – that is, the rate of unemployment that the economy tends to gravitate towards over the long term -- has fallen in some AFEs, most notably in Germany (the thin blue line in Figure 4). As a result, labor markets in Germany and some other AFEs may not be quite as tight as the unemployment rate alone would suggest.
Figure 3: Productivity Growth: 2015−2019* vs. 2000−2007
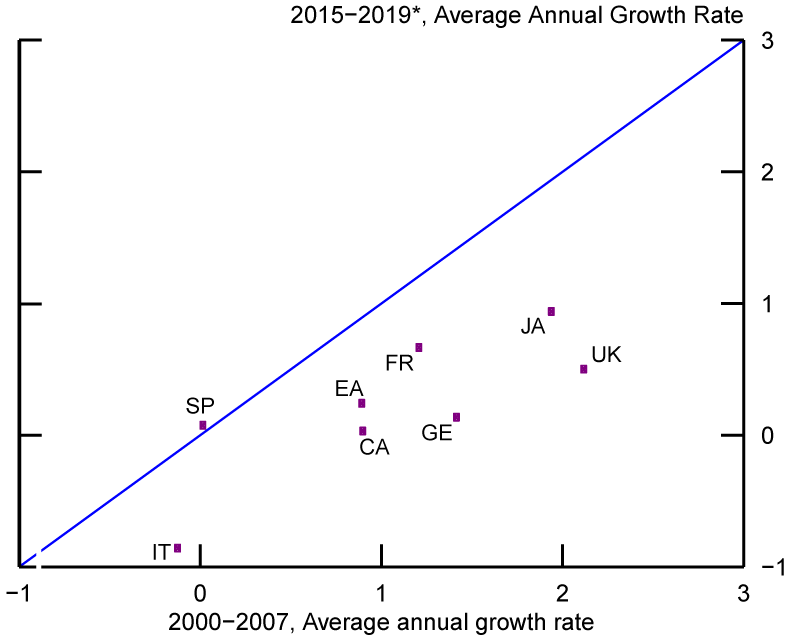
Source: Federal Statistical Office via Haver Analytics; OECD via Haver Analytics.
This note argues that these factors, especially slower productivity growth and lower natural rates of unemployment, can explain much of the weakness of wage growth and the apparent breakdown of the simple wage Phillips curve.
The analysis entails three steps. First, we estimate several versions of the AFE wage Phillips curve using data through 2010 – a basic model that controls only for the actual unemployment rate, and then several augmented models that progressively control for additional determinants of wages. Second, we show that compared to the basic model, a fuller model that accounts for slower productivity growth and lower natural rates of unemployment generates (out of sample) forecasts of wage growth in recent years that are significantly lower and more accurate. Finally, once we account for lower productivity growth and natural unemployment rates, we can reject the hypothesis of a structural change in the relationship between labor market slack and wage growth.
We estimate four versions of the AFE wage Phillips curve using quarterly data for Canada, France, Germany, Japan, and the United Kingdom through 2010. The dependent variable is the 4-quarter percentage change in compensation per hour.5
All 4 models are estimated using panel regression analysis with country fixed effects: 6
- Model 1, the basic model, explains wage growth using only the unemployment rate.
- Model 2 adds the natural rate of unemployment as an additional control to model 1.7
- Model 3 adds average productivity growth as an additional control to model 2.8
- Model 4, the fully augmented model, adds the natural rate of unemployment, average productivity growth, and long-term inflation expectations as controls.9
For all 4 models, the estimated relationships between wage growth and its potential determinants are consistent with standard economic theory and statistically and economically significant (see details in Appendix 1).
A fuller model that accounts for slower productivity growth and lower natural rates of unemployment generates out-of-sample (i.e. beyond 2010) forecasts of wage growth in recent years that are significantly lower and more accurate. Figure 5 compares the simple average of wage growth across the 5 AFEs (solid black line) with the average predictions of each of the 4 models. Consistent with the evidence shown earlier for the euro area and Canada, average AFE wage growth has been systematically lower than the prediction of model 1 (the basic model; blue dashed line) – by about 1 percentage point on average since 2011 and by even more in recent years. Model 2 (purple dotted line) takes into account lower natural rates of unemployment over time and thus predicts wage growth noticeably closer to actual wage growth. And because model 3 (green dashed-and-dotted line) also accounts for slower productivity growth, its prediction is lower still and even closer to actual wage growth. Adding controls for inflation expectations (red long-dashed line) actually has little additional effect on the model's average prediction. Even though the model predicts that lower inflation expectations should weigh on wage growth in the euro area, it also predicts that higher inflation expectations in Japan should boost wage growth there; the predicted effects have roughly offsetting effects on the average across AFEs.
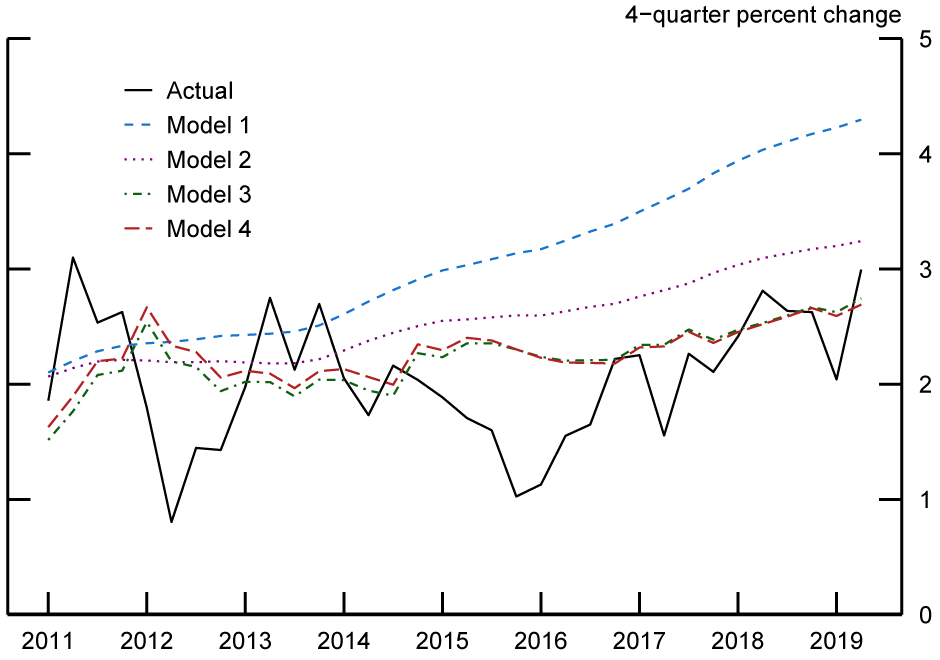
Source: OECD via Haver Analytics; Consensus Economics.
Figure 6: Contributions to Wage Growth in Advanced Foreign Economies*
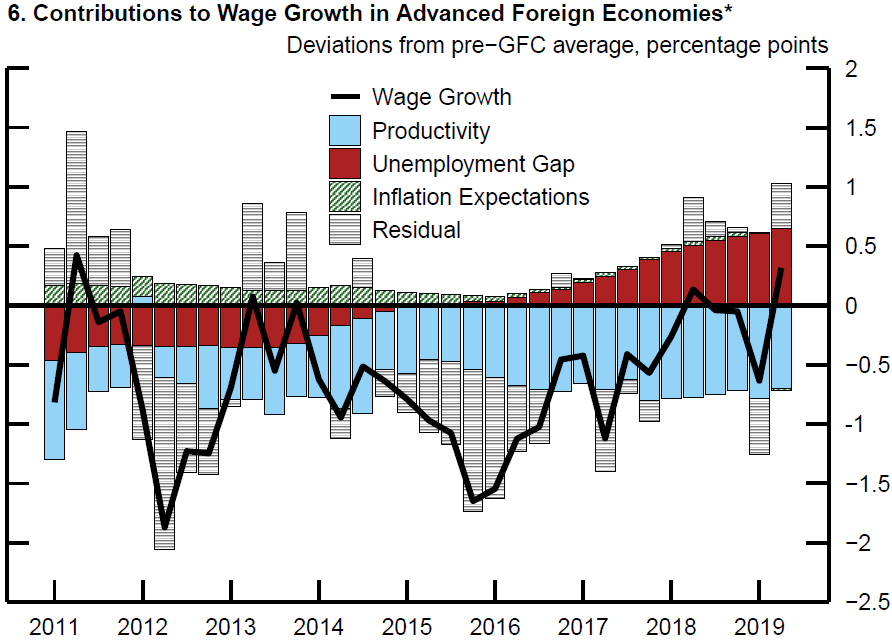
* Includes Canada, France, Germany, Japan, and the United Kingdom. Return to text
Source: OECD via Haver Analytics; Consensus Economics.
Figure 6 presents the contributions of the various determinants in explaining the fully augmented model's prediction of average AFE wage growth relative to its mean over 2000-2007. Slower productivity growth (light blue bars) is the major contributor to lower wage growth, subtracting more than 1/2 percentage point from predicted wage growth in recent years. This drag has offset the predicted boost from tight labor markets, the red bars, helping to explain why average wage growth has only recently risen above its 2000-2007 mean despite very low unemployment rates. Reinforcing these results, while we can reject the hypothesis of no structural change after 2010 in the relationship between wages and labor market slack for the simple model, we cannot reject it for the fully augmented model.
Thus, the analysis underscores the importance of accounting for lower productivity growth and natural rates of unemployment when assessing potential inflationary pressures associated with lower unemployment rates. Once we do that, we find that the wage Phillips curve implied by economic theory is actually alive and well. In recent years, tighter labor markets do appear to have put upward pressure on wage growth across the AFEs, broadly consistent with the experience of the previous decade, but these effects have been offset by other factors restraining wage growth.
Appendix 1: Wage Phillips Curve Estimates
We estimate four versions of the AFE wage Phillips curve using panel data (with country fixed effects) for Canada, France, Germany, Japan, and the United Kingdom through 2010. The dependent variable is the 4-quarter percentage change in compensation per hour:
- Model 1, the basic model, explains wage growth using only the unemployment rate.
- Model 2 adds the natural rate of unemployment as an additional control to model 1.
- Model 3 adds average productivity growth as an additional control to model 2.
- Model 4, the fully augmented model, adds the natural rate of unemployment, average productivity growth, and long-term inflation expectations as controls.
Table 1 summarizes each estimated model, displaying the coefficient estimates and p values for the key determinants of interest. For all 4 models, the estimated relationships between wage growth and its potential determinants are statistically significant at the 1 or 5 percent level, economically significant, and directionally consistent with standard economic theory. An increase in labor market slack is associated with lower wage growth, while an increase in productivity growth or inflation expectations is associated with higher wage growth.
Table 1: Wage Phillips Curve Estimates, 1990s through 2010
| Regression Coefficients | ||||
|---|---|---|---|---|
| Model 1 | Model 2 | Model 3 | Model 4 | |
| Unemployment rate | -0.88*** | |||
| (0) | ||||
| Unemployment rate gap | -0.87*** | -0.81*** | -0.83*** | |
| (1.08e-08) | (1.02e-08) | (5.00e-09) | ||
| Average productivity growth (past 3 years) | 0.70*** | 0.72*** | ||
| (2.77e-09) | (1.31e-09) | |||
| Long-term inflation expectations | 0.77** | |||
| (0.035) | ||||
| Indicators for country | Yes | Yes | Yes | Yes |
| Number of observations | 248 | 248 | 248 | 248 |
| Adjusted R-squared | 0.51 | 0.46 | 0.53 | 0.54 |
Note: The coefficient estimates are from a panel regression of wage growth on the variables shown and country indicators. P values are shown in parentheses.
Source: OECD National Accounts Database and national statistical authorities.
Bibliography
Consensus Economics, Inc., Consensus Forecasts Subscription, http://www.consensuseconomics.com/.
Haver Analytics, Haver Analytics, http://www.haver.com/our_data.html.
1. Federal Reserve Board of Governors, Division of International Finance. The views in this paper are solely the responsibility of the authors and should not be interpreted as reflecting the views of the Board of Governors of the Federal Reserve System or any other person associated with the Federal Reserve System. We thank Shaghil Ahmed, Andrea DeMichelis, Joseph Gruber, and Steven Kamin for helpful comments. Return to text
2. Formerly of the Federal Reserve Board of Governors, Division of International Finance. Return to text
3. The historical relationship is estimated using annual data from 2000 to 2010 for both the euro area and Canada. Wage growth is measured as the Q4/Q4 percent change in compensation per hour, measured as the ratio of aggregate nominal compensation of employees to aggregate hours worked, as reported in the OECD Quarterly National Accounts database. The unemployment rate is the annual average of the official measures published by Eurostat and Statistics Canada. Although figure 1 shows the wage Phillips curve for aggregate euro-area data, similar features are also observed for a number of the major member states. Return to text
4. For example, see the November 2017 article "The Phillips Curve May Be Broken For Good" in the Economist or the November 2017 Bruegel blog post "Has the Phillips Curve Disappeared?" by Silvia Merler. Return to text
5. Compensation per hour is measured as the ratio of aggregate nominal compensation of employees to aggregate hours worked, as reported in the OECD Quarterly National Accounts database. Return to text
6. The sample period is 2000:Q1-2010:Q4 for Canada, 1999:Q2-2010:Q4 for France, 1997:Q2-2010:Q4 for Germany, 1993:Q1-2010:Q4 for Japan, and 2001:Q2-2010:Q4 for the United Kingdom. The panel estimates implicitly assume that the relationships do not vary across countries or time, although country fixed effects do allow wage growth to differ across countries due to country-specific factors. Return to text
7. The natural rate of unemployment data are constructed using the OECD's annual estimates; we interpret these as Q4 values and then use linear interpolation to estimate values for the other quarters. Return to text
8. Average labor productivity growth is the annual average growth rate of labor productivity measured over a rolling 3-year window; labor productivity is measured as the ratio of real GDP to total hours worked, as reported in the OECD's Quarterly National Accounts database. Return to text
9. Inflation expectations are measured using the 6- to 10-year ahead forecast of average consumer price inflation from the Consensus Economics Survey of Economic Forecasts reported each April and October. For example, the April 2008 Consensus Survey reported average projected consumer price inflation over 2014-2018. For each year, we treat the corresponding April and October long-term inflation projections as the Q2 and Q4 values, respectively, and we use linear interpolation to infer the Q1 and Q3 values. Return to text
Lin, Stephen, Kaede Johnson, and Tyler Powell (2019). "Why Has Wage Growth Been Subdued in the Advanced Foreign Economies?," FEDS Notes. Washington: Board of Governors of the Federal Reserve System, January 8, 2020, https://doi.org/10.17016/2380-7172.2410.
Disclaimer: FEDS Notes are articles in which Board staff offer their own views and present analysis on a range of topics in economics and finance. These articles are shorter and less technically oriented than FEDS Working Papers and IFDP papers.