IFDP Notes
April 03, 2018
Distributional Consequences of Trade for U.S. Consumers: Estimating Group-Specific Import Price Inflation
Colin J. Hottman and Ryan Monarch1
Most of the literature on the distributional effects of international trade has focused on how the nominal incomes of different workers are affected differentially (e.g., Autor, Dorn, and Hanson 2013), with much less focus on the possibility that trade could cause the cost of living for different income groups to be affected differentially. However, price changes resulting from increased international integration could potentially exacerbate or alleviate the effect on real income inequality from nominal income changes. Recent work examining this price channel suggests that lower-income U.S. consumers would face a much larger price index increase than higher-income consumers if the United States were to shut itself off from the world economy (Fajgelbaum and Khandelwal 2016). Other work has shown that the burden of existing U.S. import tariffs likely falls more on lower-income households (Furman, Russ, and Shambaugh 2017). However, even though constructing import price indexes has a rich history in international economics2, to our knowledge, no prior work has actually built income group-specific import price indexes.
This note highlights the results of our project constructing import price indexes across different U.S. income deciles over the years 1998 to 2014. To do this, we use a methodology that allows for non-homotheticy, meaning that consumers with different incomes can spend different percentages of their total expenditure on the same item. In our structure, consumers demonstrate non-homotheticity both at the sector level--sectoral expenditure shares can vary across income groups--as well as at the product variety level--even within sectors, expenditure shares across product varieties can vary. Our methodology takes into account all of the relevant contributors to price index changes: changes in average product prices, changes in the distribution of product prices (i.e., changing opportunities for substitution), changes in product quality, and changes in the set of imported products. Details of our theory and implementation method can be found in Hottman and Monarch (2018).
We use two main sources of data to construct our import price indexes from 1998 to 2014: finely disaggregated price data for the universe of individual sellers exporting goods to the United States and information on the sectoral composition of spending by different income deciles. Our price data comes from customs records in the Linked-Longitudinal Firm Trade Transactions Database. These data, which are collected by U.S. Customs and Border Protection and maintained by the U.S. Census Bureau, are based on import declaration forms filed by U.S. importers. We augment the price data with the Consumer Expenditure Survey (CE), maintained by the Bureau of Labor Statistics. Publicly available CE tables provide us with the average expenditure for each income decile across a number of expenditure categories.
Our main findings are reported below:
Finding 1: Low- and high-income U.S. consumers have about the same share of spending on imported products, though both have increased somewhat over time.
Table 1 shows the share of imports in total expenditure in 1998 and 2014 for each U.S. income decile for which we have data.3 We find that the import shares are very similar across deciles. In 1998, imports were around 7 percent of expenditure for all the income deciles, before growing for each decile to around 10 percent of expenditure by 2014.
Table 1: Share of Expenditure on Imports by U.S. Decile of Income, 1998 and 2014
| 1st Decile % | 2nd Decile % | 4th Decile % | 5th Decile % | 6th Decile % | 8th Decile % | 9th Decile % | |
|---|---|---|---|---|---|---|---|
| 1998 | 6.5 | 6.6 | 6.4 | 7.0 | 7.5 | 7.0 | 7.1 |
| 2014 | 10.0 | 9.2 | 9.2 | 10.1 | 10.6 | 10.0 | 10.1 |
We do not have data on annual income and expenditures for the 3rd, 7th, or 10th income decile, which, for all other deciles, come from the U.S. Census Bureau.
Finding 2: The composition of the basket of imported products varies with income.
Despite a similar share of overall imports in total expenditure across income deciles (shown above), we find that the composition of the basket of imported products in 2014 varies significantly across income deciles. Figure 1 shows for each decile the share of expenditure on core imports (imports of non-food, non-fuel HS4 sectors) as a share of expenditure on all imports. The share of core imports ranges from about 66 percent to about 77 percent, with the core import share generally rising with income decile. Figures 2 and 3 provide examples of the share of import expenditure on specific HS4 sectors. The share of imported expenditure on washing machines, Figure 2, tends to fall with income decile, while the share of imported expenditure on sports equipment, Figure 3, tends to rise with income decile.


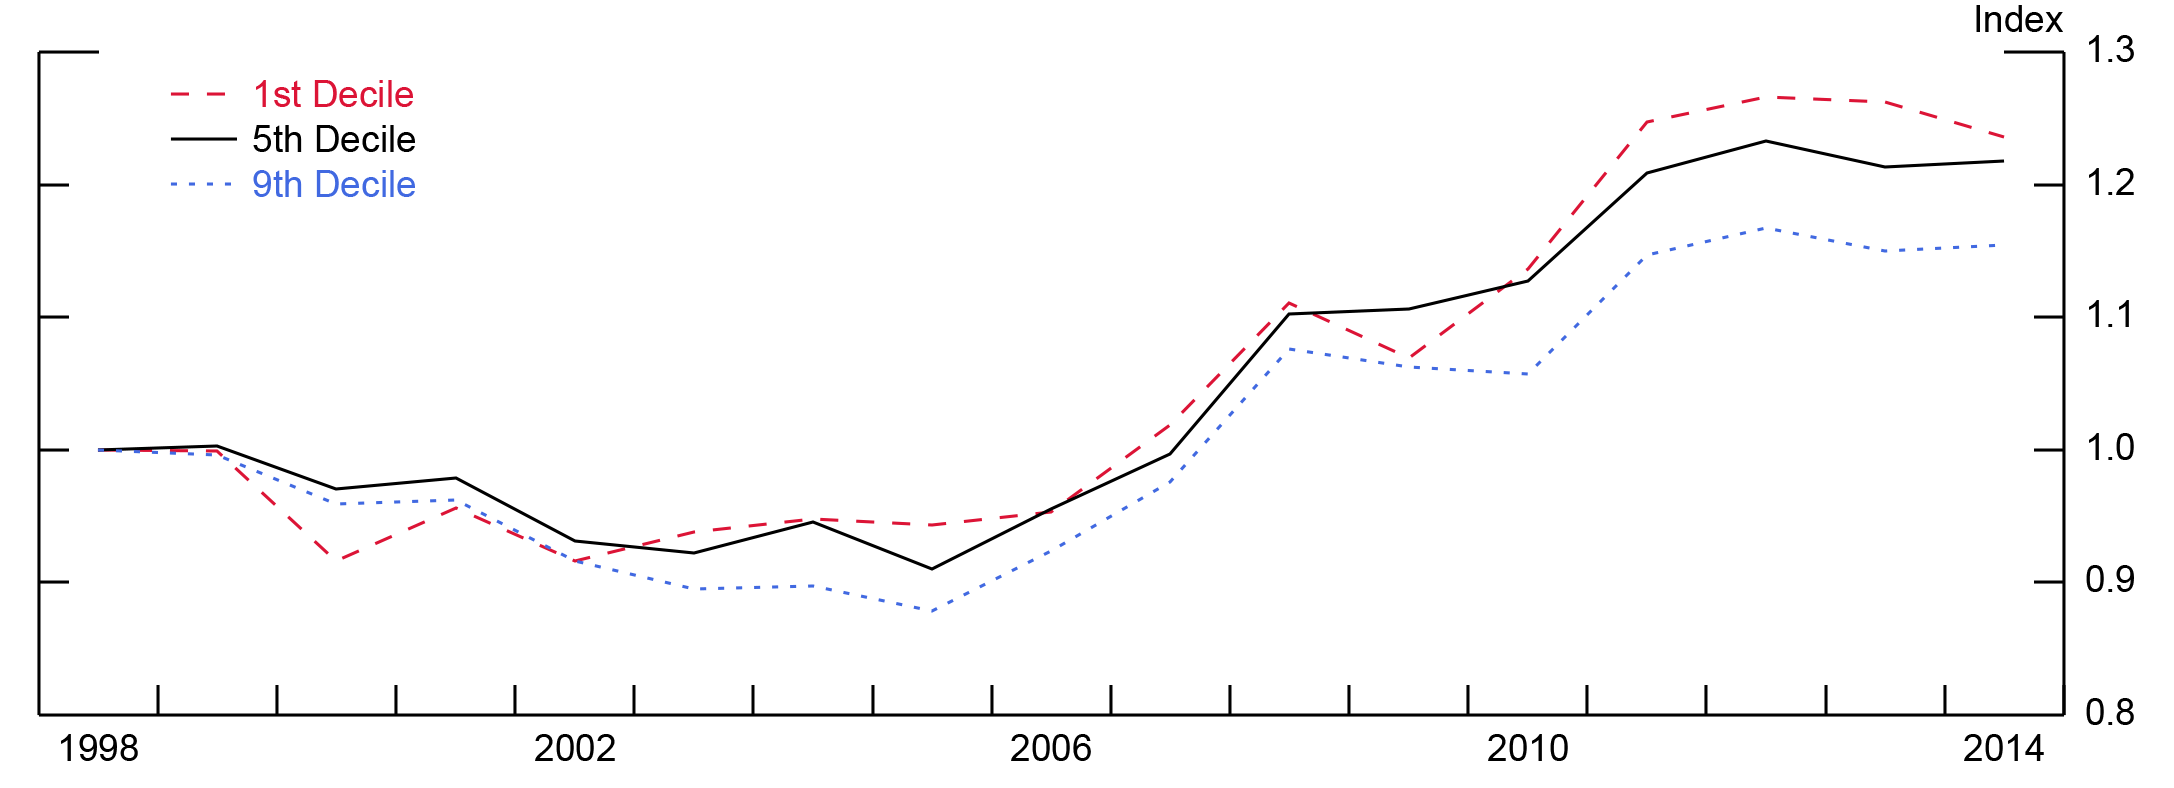
Finding 3: Import price indexes have evolved differently across income groups: On average, consumers in higher income deciles have faced lower import price inflation, while those in lower income deciles have faced higher import price inflation.
We construct import price indexes for the different income deciles, where each index covers 228 HS4 consumer goods sectors. The price index for each decile is normalized to 1 in the year 1998. We show the resulting time series for the first, fifth (median), and ninth income deciles in Figure 4. There are statistically-significant differences in the evolution of import price indexes across income groups.4 The import price index of the lowest income decile is higher than the price index of the median decile in almost every year after 2002, and the import price index of the ninth income decile is below the price index of the median decile in every year after 2002. The price indexes for 2014 show that the first income decile experienced import price inflation of about 24 percent from 1998 to 2014, while the ninth income decile only experienced import price inflation of about 15 percent.
We use these indexes to calculate import price inflation for each income decile. Table 2, row 1 shows average annual import price inflation rates over 1998 to 2014 for each income decile. We find that the lowest income decile experienced about 1.3 percent import price inflation per year, the median income decile experienced about 1.2 percent per year, and the ninth income decile had only about 0.9 percent import price inflation per year. Our results show that higher income consumers had the lowest import inflation over our time period, while lower income consumers had the highest import price inflation5.
Table 2: Annual Import Price Inflation by Decile, 1998-2014
| 1st Decile | 2nd Decile | 4th Decile | 5th Decile | 6th Decile | 8th Decile | 9th Decile | |
|---|---|---|---|---|---|---|---|
| Baseline | 1.3 | 1.2 | 1.2 | 1.2 | 0.7 | 1.0 | 0.9 |
| Without China | 1.9 | 1.7 | 1.7 | 1.8 | 1.2 | 1.5 | 1.4 |
We do not have data on annual income and expenditures for the 3rd, 7th, or 10th income decile, which, for all other deciles, come from the U.S. Census Bureau.
Finding 4: The rise in imports from China over this time period held back import price inflation significantly, but did so in a distributionally neutral way.
Given that the rise in U.S. imports from China in the early 2000s is one of the key changes in U.S. imports that occurred over the period 1998 to 2014, it is natural to ask how much our results are driven by this development. In order to isolate the direct effect of changes in imports from China, we additionally construct import price indexes without including any Chinese product varieties in our indexes6. Table 2, row 2 shows the resulting annual import price inflation by income decile for this exercise. By comparing rows 1 and 2, we find that the rise in Chinese imports over this time period held back import price inflation by about 0.5 percentage points per year, but did so in a distributionally neutral way, meaning its effect on import price inflation was about equal across income groups.
Finding 5: Differences in spending shares across sectors, rather than differences in spending patterns within sectors, are the main drivers of the variation in import price inflation across income groups.
Recall that our model allows for two-types of non-homotheticity: different income deciles can have different expenditure shares on the same sector, but even within a sector, different income deciles can have different expenditure shares across product varieties. Which matters more for our result of different import price inflation across income groups? The results presented in Table 3 address this issue. Shutting down non-homotheticity within sectors (shown in row 1) does little to change our results; the variation across income deciles in this row is about the same as the variation in row 1 of table 2 (our baseline results). On the other hand, shutting down cross-sector non-homotheticity (row 2) dramatically changes the results, resulting in the average annual import price inflation rates being nearly identical across income deciles, rather than varying. The results indicate that high-income consumers spent relatively more on those sectors that featured lower import price inflation.
Table 3: Annual Import Price Inflation by Decile, 1998-2014
| 1st Decile | 2nd Decile | 4th Decile | 5th Decile | 6th Decile | 8th Decile | 9th Decile | |
|---|---|---|---|---|---|---|---|
| No within-sector diff. | 1.4 | 1.2 | 1.2 | 1.3 | 0.7 | 1.1 | 1.0 |
| No across-sector diff. | 1.0 | 1.0 | 1.0 | 1.0 | 1.0 | 1.0 | 1.0 |
We do not have data on annual income and expenditures for the 3rd, 7th, or 10th income decile, which, for all other deciles, come from the U.S. Census Bureau.
Conclusion
In this note, we described the contours of a new methodology used to compute import price indexes for U.S. income deciles, using finely disaggregated data on all supplier-level prices of imported products. Looking across income deciles, we find that higher income consumers had lower import price inflation over the period 1998-2014, which we traced to higher income consumers spending more on those sectors which featured lower import price inflation. Our results suggest that any nominal income inequality that may have arisen in the United States due to trade over the past two decades has not been mitigated by movements in import prices across income groups.
References
Autor, D., D. Dorn, and G. Hanson, "The China Syndrome: Local Labor Market Effects of Import Competition in the United States", American Economic Review, Vol. 103, No. 6, 2013, pp. 2121-2168.
Broda, C., and D. Weinstein, "Globalization and the Gains from Variety", The Quarterly Journal of Economics, 2006, Vol. 121, No. 2, pp. 541-585.
Fajgelbaum, P., and A. Khandelwal, "Measuring the Unequal Gains from Trade", The Quarterly Journal of Economics, 2016, Vol. 131, No. 3, pp. 1113-1180.
Feenstra, R., "New Product Varieties and the Measurement of International Prices", American Economic Review, 1994, pp. 157-177.
Furman, J., K. Russ, and J. Shambaugh, "U.S. Tariffs are an Arbitrary and Regressive Tax", VoxEU.org, 2017, http://voxeu.org/article/us-tariffs-are-arbitrary-and-regressive-tax
Hottman, C., and R. Monarch, "Estimating Unequal Gains across U.S. Consumers with Supplier Trade Data", International Finance Discussion Papers 1220, 2018.
1. The authors are economists in the International Finance Division, Board of Governors of the Federal Reserve System, Washington DC 20551 U.S.A. and can be reached at [email protected] and [email protected]. Surabhi Ghai, Noah Matthews, and Michael Navarrete provided excellent research assistance. The views expressed are solely the responsibility of the authors and should not be interpreted as reflecting the views of the Board of Governors of the Federal Reserve System or of any other person associated with the Federal Reserve System. Return to text
2. Feenstra (1994) and Broda and Weinstein (2006) are two prominent examples. Return to text
3. We do not have data on annual income and expenditures for the 3rd, 7th, or 10th income decile, which, for all other deciles, come from the U.S. Census Bureau. Return to text
4. We construct standard error bands (not shown) by varying our estimated parameter which determines how substitutable the HS4 sectors are to consumers. Return to text
5. This same relative ranking holds when we use only core (ex. food and fuel) import price indexes instead of total import price indexes. Return to text
6. This partial equilibrium exercise will not account for the indirect effect of Chinese imports on the prices of other product varieties. Return to text
Hottman, Colin J. and Ryan Monarch (2018). “Distributional Consequences of Trade for U.S.
Consumers: Estimating Group-Specific Import Price Inflation.” IFDP Notes. Washington: Board
of Governors of the Federal Reserve System, April 3, 2018, https://doi.org/10.17016/2573-2129.43.
Disclaimer: IFDP Notes are articles in which Board economists offer their own views and present analysis on a range of topics in economics and finance. These articles are shorter and less technically oriented than IFDP Working Papers.