IFDP Notes
July 28, 2017
Does Automation Drive the Labor Market?
Colin Caines1, Florian Hoffmann2, and Gueorgui Kambourov3
Introduction
Extensive attention has been paid to the fact that middle-wage occupations in the United States have experienced lower mean wage and employment growth over the past few decades than both low and high wage jobs. A popular explanation for this phenomenon is that these occupations are particularly sensitive to the effects of automation4.
In this note we question the emerging view that automation is a primary driver of wage and employment outcomes in labor markets. While it is indeed the case that on average middle-wage occupations have experienced lower wage and employment growth in recent decades, we show that this fact masks substantial occupation-level variation. In fact, the difference in average wage and employment growth between middle-wage and high-wage occupations is small compared to the differences in wage and employment growth of occupations within wage brackets. The ability of automation to account for this occupation-level variation is limited. We then discuss evidence that occupation-level outcomes are best explained by the complexity of an occupation – the extent to which tasks performed on the job require higher-order skills such as the ability to abstract, solve problems, make decisions, or communicate effectively.
"Hollowing out of the middle"
We start by considering evidence of wage and employment polarization. Examining US Census data from 1980-2005 we find that occupations between the 10th and 20th percentile of the wage distribution experienced wage and employment growth similar to occupations between the 70th and 80th percentile (see figure 1)5. In contrast, occupations in the middle 10 to 15 percent of the wage distribution had the lowest average wage growth. Evidence of polarization has been documented extensively in US data, and similar evidence has been found in data for industrialized countries including the UK, Germany, and Australia.
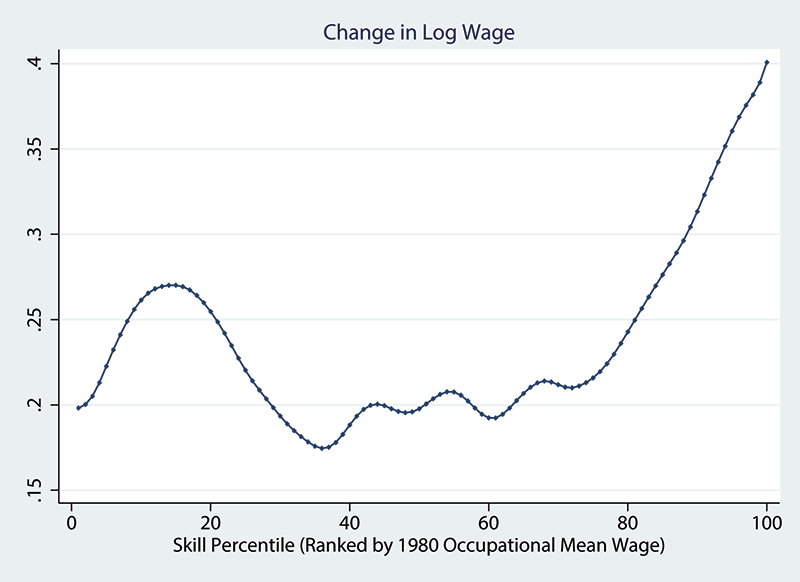
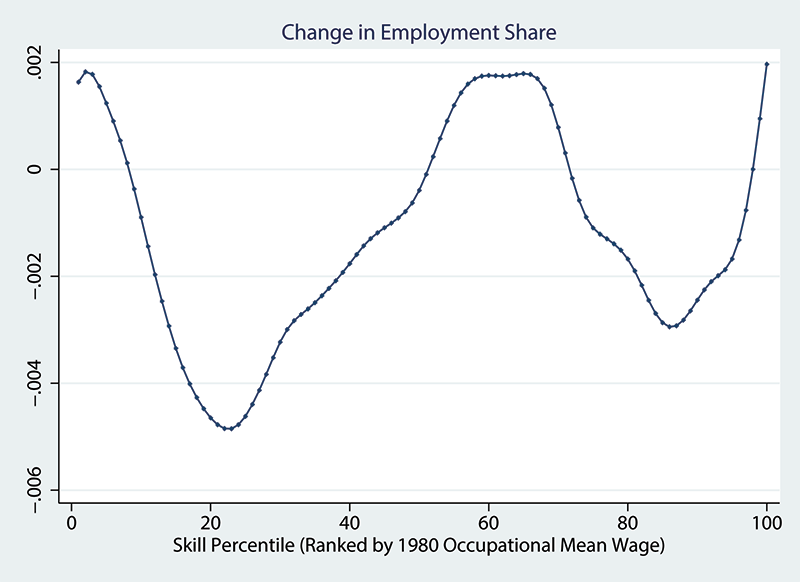
Notes: Data taken from the 1980 5% Sample of the US Census and the 2005 American Community Survey (ACS). Hourly wages constructed from total wage and salary data (adjusted using PCE deflator), number of weeks worked per year, and usual number of hours worked per year. Data is defined on the 3-digit occupation level.
A popular theory of these changes, commonly associated with the analysis in Autor et al. (2003), is that middle-wage occupations are intensive in routine tasks, leading them to decline in employment shares and relative wages in the face of automation. An implication is that occupations that cannot be easily automated are predicted to perform relatively well. In support, Autor and Dorn (2013) highlight the rise in low-skill services for explaining relatively large wage growth amongst occupations with relatively low wages in 1980. Consistent with this hypothesis we find that low-skill service occupations had wage growth of 21 percent from 1980-2015, compared to 11 percent growth amongst Craft & Repair occupations and 9 percent seen by Fabricators & Laborers over the same period.
One difficulty with this hypothesis is that middle-wage occupations are heterogeneous. One might reasonably ask whether Truck Drivers and Auto Body Repairers, both middle wage occupations in 1980, are necessarily subject to the same aggregate forces on wages given the different skill sets they require. Figure 2 plots the change in wages and the change in employment share of 3-digit occupations against their place in the 1980 wage distribution. The figure plots both raw data (the dots) as well as smoothed kernels (the blue lines) which show average outcomes. The plots in figure 2 reveal that changes in mean wage growth and employment growth over the wage distribution are small compared to the occupation-level variance. Indeed, the relatively low levels of average wage growth we saw between the 45th and 55th percentile of the 1980 wage distribution in figure 1 are imperceptible in figure 2 when overlayed with the raw data.
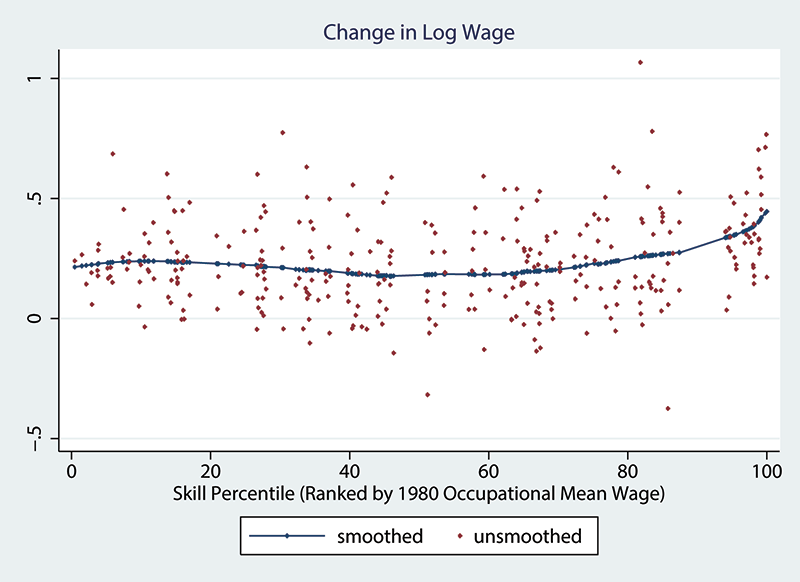
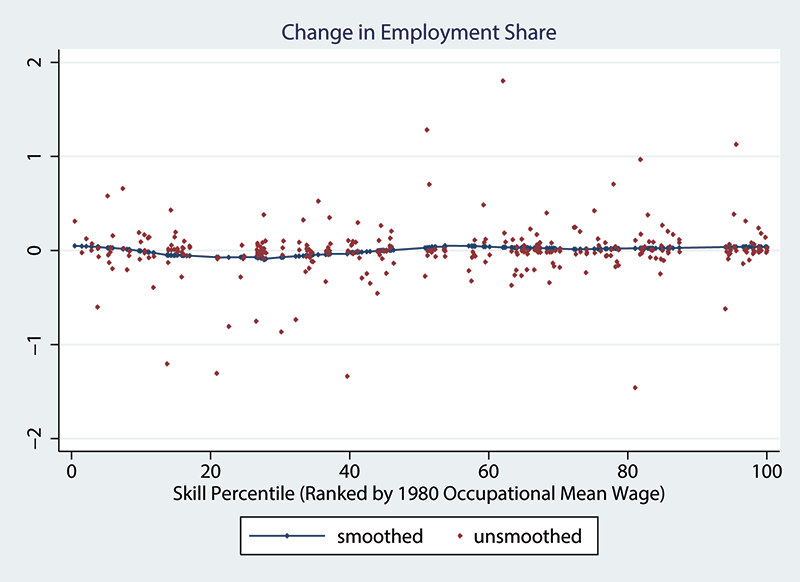
Notes: Data taken from the 1980 5% Sample of the US Census and the 2005 American Community Survey (ACS). Hourly wages constructed from total wage and salary data (adjusted using PCE deflator), number of weeks worked per year, and usual number of hours worked per year. Data is defined on the 3-digit occupation level.
At all wage levels one finds occupations with relatively high wage growth and occupations with relatively low wage growth. This suggests we should go beyond trying to explain mean outcomes by wage level. If aggregate trends in wages and employment are driven by technological change impacting upon different types of labor supply then these factors should be able to explain the occupation-level variance in outcomes.
What role for automation?
One method for capturing the vulnerability of labor to automation is to measure the extent to which it involves carrying out highly routine or replicable tasks. The seminal study of the substitutability between processing technology and labor inputs that are routine is Autor et al. (2003). Their approach of measuring routineness from the Dictionary of Occupational Titles (DOT) has been widely replicated. More recent studies by Autor et al. (2006) and Autor and Dorn (2013) have classified the routineness of occupations from dimensions measured by Autor et al. (2003) in the DOT. Here we take examine the routine task intensity index developed in Autor and Dorn (2013).
Figure 3 shows occupation-level plots of the change in log wage and the change in employment share against routine task intensity. Differences in routine task intensity across occupations do not appear to capture variation in wage and employment growth. In Caines et al. (2017) we subject this to more rigorous analysis. We find no significant relationship between routineness and either wage or employment growth at the occupation level once one controls for a standard set of demographic controls.
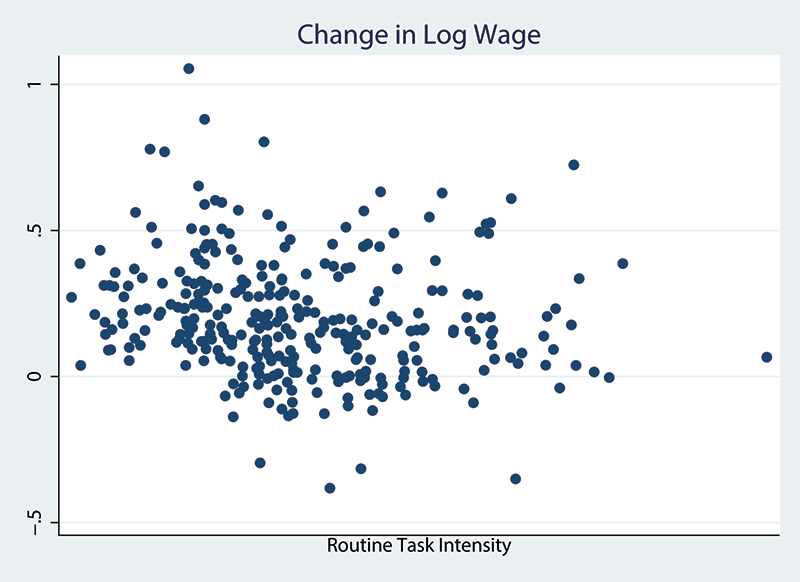
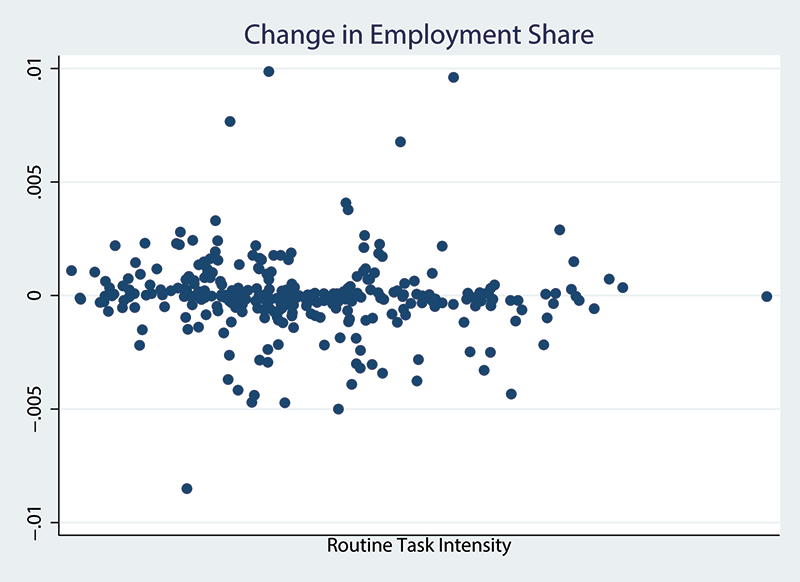
Notes: Data taken from the 1980 5% Sample of the US Census and the 2005 American Community Survey (ACS). Hourly wages constructed from total wage and salary data (adjusted using PCE deflator), number of weeks worked per year, and usual number of hours worked per year. Data is defined on the 3-digit occupation level.
An alternative measure of task content
One reason why routineness may do a poor job of capturing occupation-level outcomes is that a job which is relatively difficult to automate may nonetheless require skills which are fairly ubiquitous in the working population (ie. cleaning & janitorial work), exerting downward pressure on wages. Recent work in the literature stresses the role played by the returns to cognitive or learned skills in explaining occupational wage and employment trends (for example, see Beaudry et al. (2016), Caines et al. (2017), Deming (2015), and Yamaguchi (2012)).
We examine here the relationship between wage and employment growth at the occupation level and task complexity, which we view as the extent to which tasks performed on the job require higher-order skills such as the ability to abstract, solve problems, make decisions, or communicate effectively. We hypothesize that occupations with low levels of task complexity are comprised of tasks that primarily involve raw physical, cognitive, and interactive skills and abilities. Labor supply that can perform such tasks can be viewed as abundant, regardless of whether it is substitutable with capital or not. In contrast, complex tasks involve higher-order skills, either innate or acquired via post-secondary education or other forms of human capital investments, and are therefore relatively scarce. Technological change that is complementary with task complexity would then generate wage and employment growth at the occupation level.
Constructing a measure of task complexity
We construct a measure of an occupation's task complexity. In doing so we draw upon our own work in Caines et al. (2017) as well as in Yamaguchi (2012), Bacolod and Blum (2010) and Beaudry et al. (2016).
Two sources of data are commonly used for quantifying the task content of occupations, the Dictionary of Occupational Titles (DOT) and its successor the Occupational Information Network (O*NET) production database.6 The O*NET has the advantage of offering a much broader set of occupational descriptors, which allows for a more precise measurement of task complexity. Furthermore, task measures are derived from a survey of incumbent workers rather than occupational analysts, as is the case for the DOT. We therefore rely on O*NET data (O*NET 20.1, October 2015).7 The O*NET compiles information on 277 standardized measurable characteristics of occupations, referred to as descriptors. These cover features such as the activities/tasks involved in working in an occupation, the requirements and qualifications needed to work in an occupation, as well as the knowledge/interests of the typical worker in an occupation.
We construct a measure of task complexity in two steps. First, we identify 35 O*NET descriptors that relate to our definition of task complexity. Examples are "originality", "inductive reasoning", "complex problem solving", "critical thinking", "analyzing data or information", and "thinking creatively". In the O*NET each of the selected descriptors are evaluated with a consistent 0-7 scale that indicates the degree to which they are required to perform a given occupation. In our view each of these is positively correlated with task complexity.
As a second step we map the information contained in our selected occupational descriptors into a single measure. This mapping is performed using a principal components analysis (PCA)8. The complexity index for each of our 3-digit occupations, together with the full list of O*NET descriptors used, can be found in Caines et al. (2017)9. The occupations with the highest complexity measures largely comprise professional, scientific/medical, and senior management occupations. Conversely, the occupations at the bottom of the complexity ranking predominantly consist of service occupations, such as various cleaning occupations, as well as some manual occupations, primarily those involving machine operation. In the middle of the complexity distribution we find a wide range of both service and goods-producing occupations. The latter tend to consist of mechanics, technicians, and craftsmen. In order to simplify the exposition that follows we designate occupations as being either "simple" or "complex". Occupations are classified as simple if they are below the 66th percentile of our complexity measure and classified as complex if they are above it10.
Empirical Analysis
Table 1 provides aggregate statistics on groups of occupations defined by task content. We further separate all simple occupations into two groups: routine and non-routine. Following Autor and Dorn (2013), routine occupations are those with routine task intensity ranked in the top third amongst all occupations. The table shows mean wages as well as average wage and employment growth for the three occupational categories - simple routine, simple non-routine, and complex − and yields the following insights:11
- Wage levels and wage growth are higher in complex occupations than in simple occupations;
- Within the simple occupations, wage levels as well as wage growth are the same for routine occupations and non-routine occupations;
- There is reallocation from simple occupations to complex occupations over time;
- Within the simple occupations, the routine occupations experienced a larger percent decline in employment over time than the non-routine occupations.
Table 1: Complexity, Routineness, Wages, and Employment
| Mean Wages | Employment Share | Employment Change (%) | ||||
|---|---|---|---|---|---|---|
| log(wage1980) | log(wage2005) | Δlog(wage) | 1980 | 2005 | ||
| simple routine | 1.925 | 2.041 | 0.116 | 0.188 | 0.169 | 9.8 |
| simple nonroutine | 1.959 | 2.071 | 0.112 | 0.466 | 0.426 | 8.6 |
| complex | 2.304 | 2.663 | 0.357 | 0.346 | 0.405 | 17.0 |
Notes: Wage and employment data taken from 1980 5% sample of the US Census and the 2005 ACS. Sample restricted to non-institutionalized males aged 16-64 in the mainland United States. Complex occupations defined as those whose complexity index is above the 66th percentile in the occupation-level complexity distribution. All other occupations are defined as simple.
Figure 4 plots occupation-level data of 1980 wages against complexity and 1980-2005 wage growth growth against complexity. The plots indicate that complexity is associated with increases in both wage levels and wage growth at the occupation level. In Caines et al. (2017) we provide a detailed regression analysis of the relationship between wages, wage growth, and employment growth; and task complexity and routine task intensity at the occupation level. The salient results are discussed below.
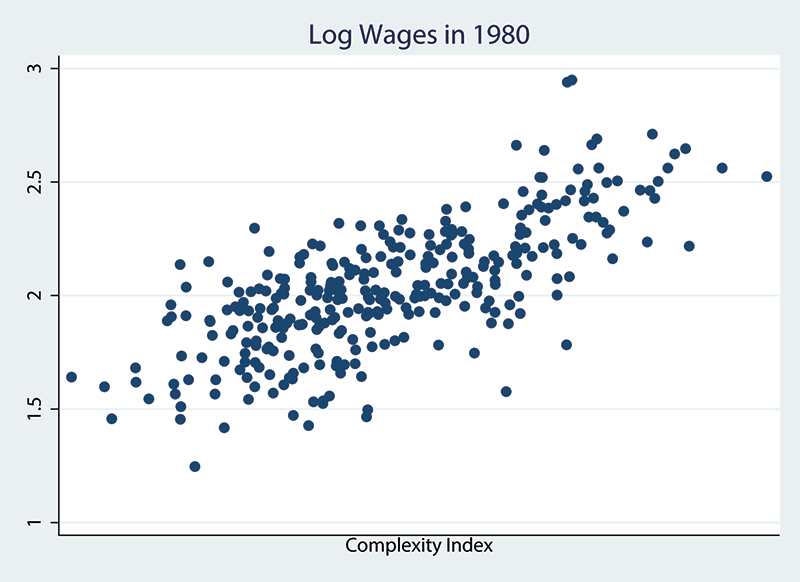
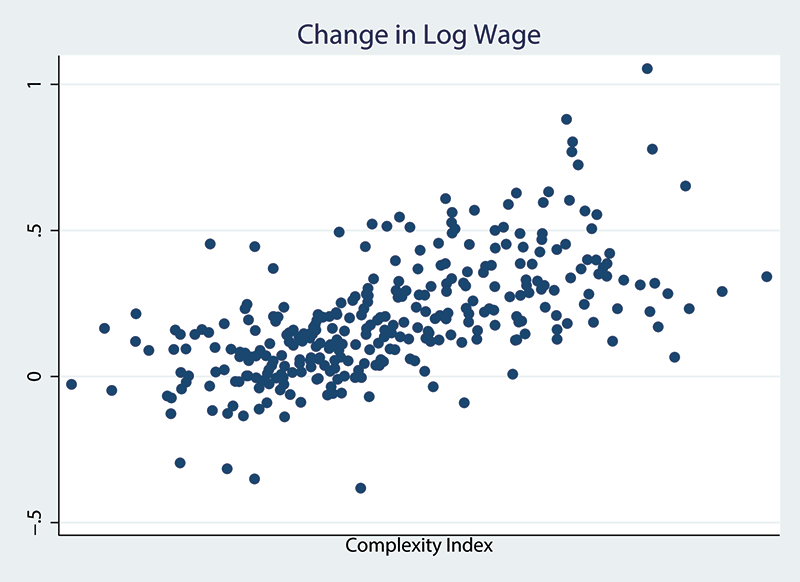
Notes: Data taken from the 1980 5% Sample of the US Census and the 2005 American Community Survey (ACS). Hourly wages constructed from total wage and salary data (adjusted using PCE deflator), number of weeks worked per year, and usual number of hours worked per year. Data is defined on the 3-digit occupation level.
We first consider the relationship between the task complexity of an occupation and its place in the wage distribution. At the individual level there is a large and significant relationship between the task complexity of the occupation in which an individual works and their wage level after control for the effects of age, education, gender, and race. Mean wages of individuals in the most complex occupations are 35 percent higher than the mean wages of individuals in the least complex occupations in 1980. In the 2005 cross-section this gap increases to 71 percent. For both years the routineness of an individual's occupation has no significant relationship with the mean wage after controlling for complexity. We also show that these results hold after data is aggregated to the occupation level.
Next, we show that complexity has a positive and highly significant relationship with wage growth at the occupation level. After including controls for an array of occupational demographic means, routine task intensity, as well as a polynomial in the 1980 wage level, average wage growth between 1980 and 2005 in the most complex occupations is 30-35 percent higher than in the least complex occupations. Routine task intensity has no significant relationship with wage growth. Notably, complexity has a significant relationship with wage growth even though the analysis includes controls for the share of workers in an occupation with a college degree. Repeating the exercise for the relationship between complexity and employment growth, we find the relationship to be considerably weaker. Neither task complexity, nor routineness are significantly related to employment growth at the occupation level.
Another empirical approach would be to rely on panel data that includes individuals of different cohorts in 1980 and 2005. This would enable us to estimate occupation-specific age- and time effects from worker-level data. Unfortunately, such data do not exist, at least not with an appropriate sample size. We approximate this type of data by disaggregating our repeated cross-sections to a much finer level, defined by occupations and demographic "groups"12. When we regress wage growth on our disaggregated data the relationship between complexity and wage growth identified thus far remains. The most complex occupations are predicted to have 26-35 percent higher wage growth than the least complex occupations. The relationship between routineness and wage growth remains insignificant. Conversely, complexity is found to have a positive and significant relationship with employment growth in the disaggregated data, while occupations with higher levels of routine intensity are now predicted to have significantly lower levels of employment growth.
Conclusion
In this note we have examined the determinates of labor market outcomes at the occupation level. Traditional narratives have focused on relatively low average wage and employment growth amongst middle-wage jobs, and argued that these trends are driven by the automation of routine labor tasks. We have argued here that these narratives ignore significant variation at the occupation level and that this variation does not appear to be strongly correlated with popular measures of routinization. Instead, we show that a measure of the task complexity of an occupation does a better job of explaining occupation-level outcomes. Complexity is strongly related with both the wage level and wage growth of an occupation, and weakly related with employment outcomes. These results are consistent with growth in the productivity of capital that complements labor inputs, and suggest a role for policy in promoting the acquisition of skills that underlie complex labour supply.
In Caines et al. (2017) we develop a theoretical framework that explains the data facts documented here. We show that the observed wage and employment changes can be explained by growth in the productivity of capital that complements complex labor supply, a phenomenon we call Complex-Task Biased Technological Change. This work yields distinct policy implications, particularly regarding the effectiveness of human capital interventions such as vocational training programs. In Caines et al. (2016) we examine whether such programs can be effective in driving individuals towards employment in more complex occupations.
References
Autor, D. H., Dorn, D., 2013. The Growth of Low-Skill Service Jobs and the Polarization of the US Labor Market. American Economic Review 103 (5), 1553–1597.
Autor, D. H., Katz, L. F., Kearney, M. S., May 2006. Measuring and Interpreting Trends in Economic Inequality. AEA Papers and Proceedings 96 (2), 189–194.
Autor, D. H., Katz, L. F., Kearney, M. S., May 2008. Trends in US Wage Inequality: Revising the Revisionists. The Review of Economics and Statistics 90 (2), 300–323.
Autor, D. H., Levy, F., Murnane, R. J., 2003. The Skill Content of Recent Technological Change: An Empirical Exploration. Quarterly Journal Economics 118 (4), 1279–1333.
Bacolod, M. P., Blum, B. S., 2010. Two Sides of the Same Coin: "Residual" Inequality and the Gender Gap. Journal of Human Resources 45 (1), 197–242.
Beaudry, P., Green, D. A., Sand, B. M., 2016. The Great Reversal in the Demand for Skill and Cognitive Tasks. Journal of Labor Economics 34 (1), S199–S247.
Caines, C., Hoffmann, F., Kambourov, G., 2016. Training Programs, Skills, and Human Capital: A Life-Cycle Approach, Working Paper.
Caines, C., Hoffmann, F., Kambourov, G., 2017. Complex-task biased technological change and the labor market. Review of Economic Dynamics 25.
Deming, D. J., 2015. The Growing Importance of Social Skills in the Labor Market, NBER Working Paper No. 21473.
Firpo, S., Fortin, N. M., Lemieux, T., 2011. Occupational Tasks and Changes in the Wage Structure, IZA Discussion Paper No. 5542.
Goos, M., Manning, A., Salomons, A., May 2009. Job Polarization in Europe. American Economic Review 99 (2), 58–63.
Ross, M. B., 2015. Skill Biased Technical Change: Panel Evidence of Task Orientation and Wage Effects, University of Connecticut Working Paper.
Yamaguchi, S., 2012. Tasks and Heterogeneous Human Capital. Journal of Labor Economics 30 (1), 1–53.
1. Division of International Finance, Board of Governors of the Federal Reserve System, Washington, D.C., 20551, U.S.A. E-mail: [email protected]. The views in this paper are solely the responsibility of the authors and should not be interpreted as reflecting the views of the Board of Governors of the Federal Reserve System or of any other person associated with the Federal Reserve Board. Return to text
2. Department of Economics, University of British Columbia, 6000 Iona Drive, Vancouver, BC, V6T 1Z4, Canada. E-mail: [email protected]. Return to text
3. University of Toronto, Department of Economics, 150 St. George St., Toronto, Ontario M5S 3G7, Canada. E-mail: [email protected]. Return to text
4. For example, see Autor and Dorn (2013). Return to text
5. We follow Autor and Dorn (2013) and take the sample of noninstitutionalized males in non-farm employment in the US mainland in the 1980 5% Sample of the US Census and the 2005 American Community Survey (ACS). Hourly wages constructed from total wage and salary data (adjusted using PCE deflator), number of weeks worked per year, and usual number of hours worked per year. All the analysis that follows is robust to the inclusion of females in the sample, see Caines et al. (2017). Return to text
6. See Autor and Dorn (2013), Autor et al. (2003), Autor et al. (2008), Firpo et al. (2011), Goos et al. (2009), and Ross (2015). Return to text
7. However, we have also carried out our analysis using the DOT, with similar results. They are available upon request. Return to text
8. See Bacolod and Blum (2010), Caines et al. (2017), or Yamaguchi (2012) for discussion. Return to text
9. The paper also reports factor loadings for each of the descriptors in the PCA. Return to text
10. The findings are quantitatively robust to the choice of this cutoff. Return to text
11. We compute data on the occupational wage and employment structure over time from the 1980 Census Integrated Public Use Microdata and the 2005 American Community Survey (ACS), imposing similar sample restrictions to Autor and Dorn (2013). Our working sample consists of non-farm workers in the mainland United States between the ages of 16 and 64 (inclusive). The main part of our empirical analysis focuses on males (results are robust to performing analysis on female-only sample, as shown in Caines et al. (2017)). We also omit from our sample individuals who are institutionalized. Wage data refers to hourly wages, constructed from the census data for total wage and salary income (adjusted using the PCE deflator), number of weeks worked per year, and usual number of hours worked per week. The employment share of an occupation is given by the total number of hours worked in an occupation in a year as a fraction of the total number of hours worked in the economy. Return to text
12. Groups are defined by gender, education, race, and age. We define four categories for education: (i) individuals with less than a high school diploma, (ii) individuals with a high school diploma only, (iii) individuals with some college education, but no degree; and (iv) individuals with a college degree. We also define four categories for age: (i) 16 to 28, (ii) 29 to 40, (iii) 41 to 52, and (iv) 52 to 64. Finally, we use two categories for race: white and non-white. For each occupation-demographic cell we compute average wage and total employment changes from 1980 to 2005 using the 1980 5% Census and the 2005 ACS. We use the same sample restrictions as before. However, in order to have enough number of observations in each cell we use both men and women in this analysis. This yields a total of 15142 cells. Return to text
Caines, Colin, Florian Hoffmann, and Gueorgui Kambourov (2017). "Does Automation Drive the Labor Market?," IFDP Notes. Washington: Board of Governors of the Federal Reserve System, July 2017, https://doi.org/10.17016/2573-2129.35.
Disclaimer: IFDP Notes are articles in which Board economists offer their own views and present analysis on a range of topics in economics and finance. These articles are shorter and less technically oriented than IFDP Working Papers.