May 24, 2024
Some Thoughts on r*: Why Did It Fall and Will It Rise?
Governor Christopher J. Waller
At the Reykjavik Economic Conference, Reykjavik, Iceland
Thank you for the invitation to be here and speak to you today.1
I want to step away from shorter-term questions about the economic outlook and monetary policy to delve into a subject of longer-term significance—r*. While there are many concepts of r*, I interpret it to be the real policy interest rate that is neither stimulating nor restricting economic activity with inflation anchored at the central bank's inflation target. In the short term, policymakers must judge whether a given policy setting is restrictive or otherwise, and while this judgment is made with some idea of r*, a number of factors can influence the economy in the near term so that the current setting of policy usually differs from the value of r*. At the same time, policymakers continually update their view of the appropriate value of r*. Recently, for example, discussions have focused on whether or not r* has risen, which has important implications for the conduct of monetary policy.
For the purposes of this discussion, I am going to be talking about the long-run, real value of r*, when inflation and employment have reached the Federal Open Market Committee's (FOMC) goals. Because of that, an estimate of r* points toward where monetary policy is headed over the longer run. This is important for policymakers deciding the best way to get there and also for investors and other members of the public who make decisions in the near term based on their expectations of future economic conditions.
Much has been written on this topic, and different methods have been developed to estimate r*. My goal today is not to debate which statistical estimate of r* is best but rather describe what I believe are the economic factors behind the secular behavior of r*. In particular, I want to address two questions. First, what drove the decline in r* over the past 40 years? Second, what are the factors that may cause it to rise? I am certain some of you will disagree with my answers to these two questions, but that is the nature of good intellectual debate and how we advance our understanding of the world around us.
One vital fact about r* is that it is a theoretical concept without any reliable and straightforward way to determine its value. There are economic models that are used to estimate the value of r* and also surveys of market participants or policymakers such as the FOMC's Summary of Economic Projections. But r* is not a precise number, unlike the unemployment rate, which can be measured directly. For these reasons, all of the model and survey estimates come with large degrees of uncertainty.2 That's why we always need to be humble in citing a numerical value for r*.
One thing that is evident from these different estimates, and additionally clear based on the performance of the economy at different policy settings over the past couple of decades, is that the value of r* changes over time.3 The change is slow moving, and I tend to think of it as related to the movement in factors that we can see affecting the economy over time. Though hard to precisely measure, having some understanding of the current level of r* is a matter of obvious importance for monetary policy, so I will focus today on factors that have contributed to the apparent decline in r* over the past several decades and look at how they may influence its value going forward.
To get some indication of how r* has evolved over time, it is helpful to look at the real, or inflation-adjusted, yield of the 10-year Treasury security, the most widely held safe and liquid asset. Let me pause here and explain why this is a good real-world proxy for the theoretical value of r*.
Think of r* as the level of the real federal funds rate once all the cyclical ups and downs of the economy have been factored out, including near-term policy tightening or loosening that sometimes is necessary to move employment and inflation back to the FOMC's goals. Someone buying or selling a 10-year Treasury security must determine the appropriate price (or yield) by thinking about not only the near-term policy rate, but also how the policy rate will evolve over the next 10 years. Thinking about the evolution of the policy rate, most forecasts expect near-term shocks to die out and the economy to move toward the FOMC's goals, so the policy rate—absent future shocks—will move toward and eventually reach r*. This means the 10-year Treasury yield embeds a value of r*. Since 10-year Treasury securities are widely traded, their price (and yield) is reflective of current market views of the value of r*.4
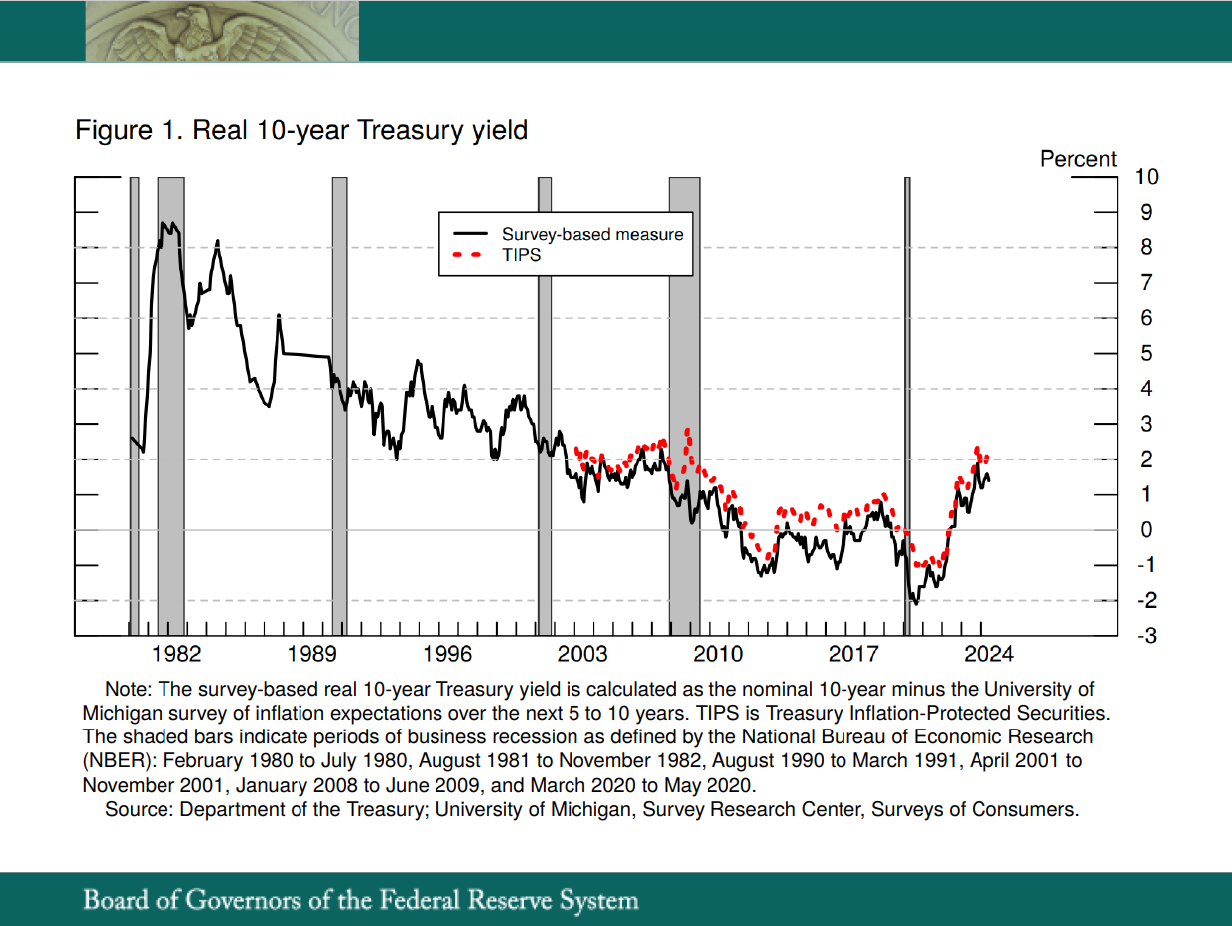
With that stipulated, let's look at how the real yield on the 10-year Treasury security has evolved. In figure 1, I plot two measures. One is a series starting in the 1980s using the nominal 10-year Treasury yield and subtracting out the Michigan survey's view of expected inflation over the next 5 to 10 years (the solid black line). The second measure is a market-based measure, Treasury Inflation-Protected Securities, or TIPS, which started trading in the late 1990s (the red dashed line).
These series clearly show a downward trend in the real yield of the 10-year Treasury over most of the period, supporting the idea that r* declined over the past 30 to 40 years. Looking at the past few years, the two series show a recent increase. This is the source of recent questions about whether r* has risen, which I will address later.
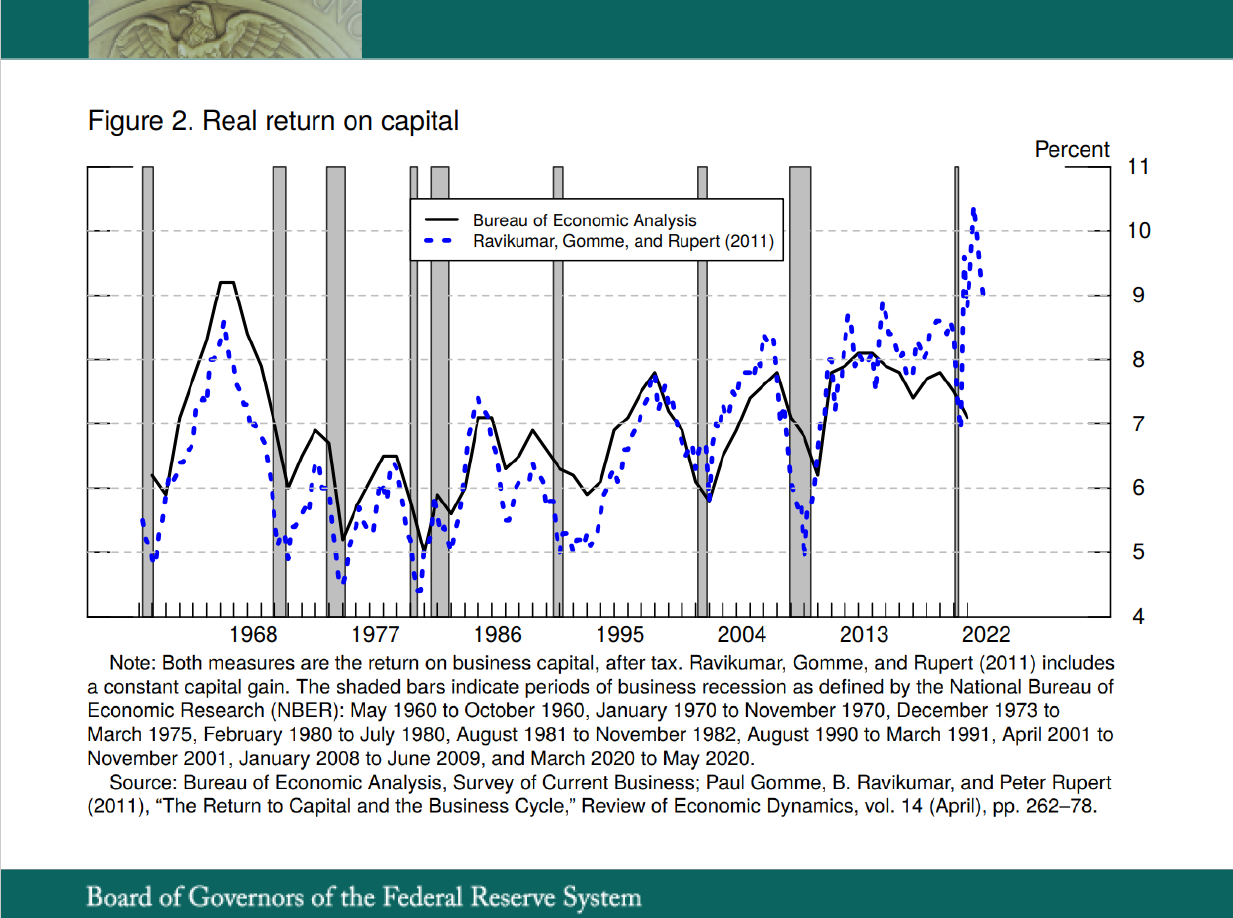
I want to pause here and show another measure of longer-term interest rates that some people use to gauge the value of r*—the real return on capital. In my view, this is not the appropriate interest rate to use for discussing r* because it includes some measure of riskiness of business activity and is not directly related to the stance of monetary policy. As you can see in figure 2, these accounting-based measures of the realized real return on capital, as measured by the Bureau of Economic Analysis (the black line) or researchers (the blue dashed line), do not show the longer-term downward trend that we saw in the real 10-year Treasury yield. Also, these values have not necessarily moved up in the recent past either. I look at these measures of the return on capital and conclude that, unlike the 10-year Treasury, there is no secular decline in the real return to capital. One could argue about how this private return is measured, but recent work, accounting for a myriad of factors, finds only modest changes in this return.5
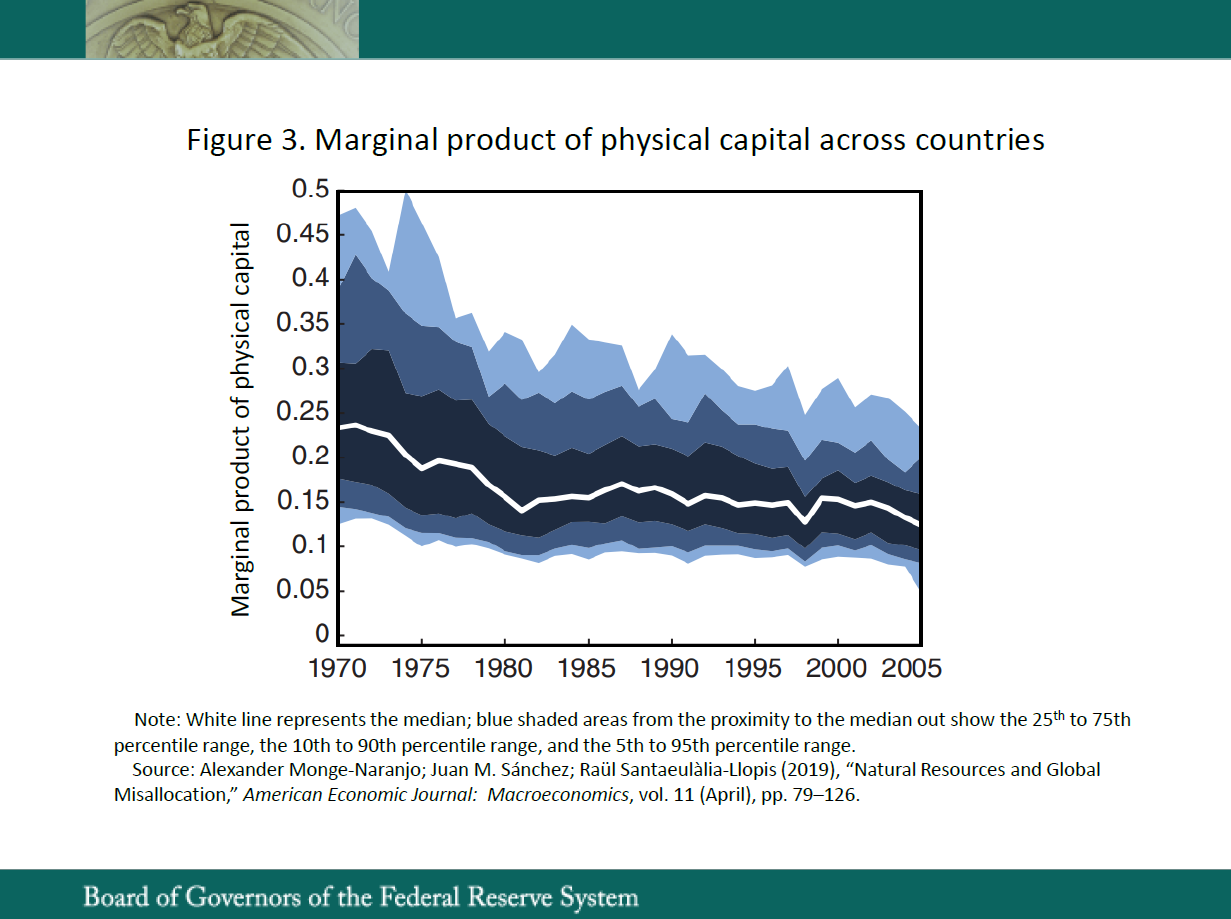
This divergence—the longer-term decline in the real 10-year government yield until recently and the relatively flat real return on capital—holds across countries. Many researchers have documented the decline in government yields around the world, so I will not here. Meanwhile, figure 3 shows a chart from a paper by Monge-Naranjo and others where the median real return on capital (the white line) across countries has been roughly steady since 1980.6 And, in fact, the blue region, which represents the dispersion of this return across countries, has narrowed over the years.
To me, these data raise a very clear question: What are the factors or events that have driven a wedge between these two rates of return, causing the real 10-year yield to decline but the return on capital to be relatively constant? And what does this say about r*?
Let me start by discussing what is not responsible for this difference in yields.7 First, it cannot be caused by longer-run trends in productivity. Trend productivity affects the real return on capital first and foremost. So even if trend productivity growth was falling over time, both rates of return would have fallen. But, clearly, the real return to capital has not fallen over time. So falling productivity growth cannot be an explanation.
Second, this difference in yields cannot be the result of declining population growth. Again, this would also lower the real return to capital since there are fewer workers to use productive capital, which means the existing capital stock is underutilized, thereby lowering its real return.
So, what drove the decline of the real return on government debt? It is obvious that what makes U.S. government debt different from the real return on capital and other interest rates is its safety and global liquidity. I will briefly discuss several factors that have influenced the supply and demand for safe, liquid assets. I will try to make the case that the demand for safe, liquid assets outgrew the supply over the past 40 years, which drove a secular increase in the price of U.S. Treasury securities and, thus, a secular decline in their real yield. At the same time, the safety and liquidity of U.S. Treasury securities was actually increasing, which made them even more attractive to global investors.
To be clear, I am not focusing on day-to-day movements in interest rates from idiosyncratic events that will ultimately unwind. Instead, I am thinking about factors that have long-term consequences for short-term market interest rates and, hence, r*. I will also consider how these factors may be influencing r*'s value today and in the future.
Let me first explain why I believe the safety of U.S. Treasury securities increased over the past 40 years. By this I am not referring to default risk, which has been and will be zero. By "safer" I mean greater stability in the real return from holding U.S. Treasuries. I believe this occurred for two reasons. First, from 1980 to 2020 there was a significant decline in the level and volatility of U.S. inflation. Second, the Great Moderation during this period meant economic performance in the United States was less volatile, which meant less variability in the monetary policy rate. This lowered the interest rate risk from holding Treasuries. As a result, the opportunity to hold a default-free asset with less risk of inflation and economic volatility made U.S. Treasuries more attractive.
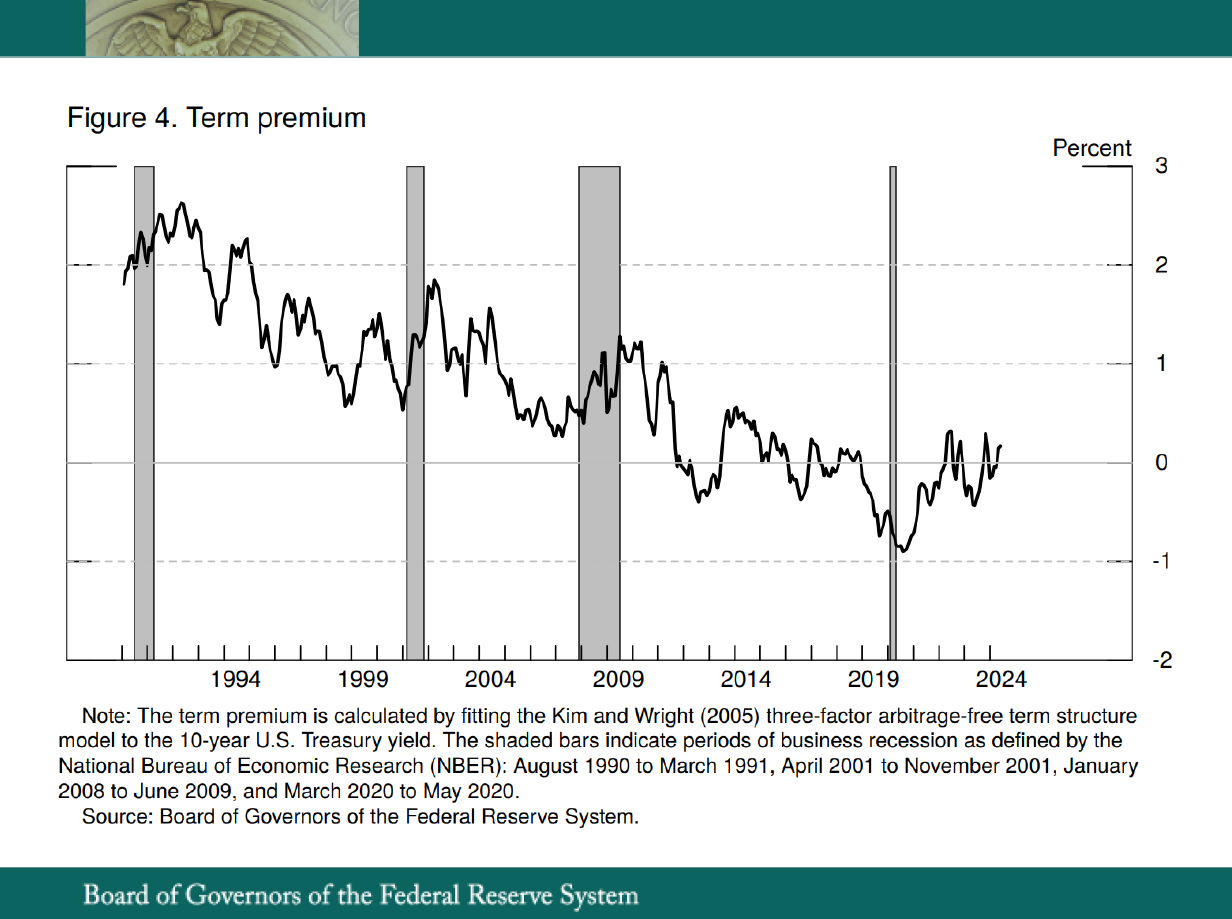
Support for this proposition comes from looking at the term premium on 10-year Treasuries over the past 40 years, as is shown in figure 4. The term premium measures the compensation investors must receive to accept risk from holding Treasuries. As you can see, there is a clear secular decline in the term premium on 10-year Treasuries. I interpret this to mean that the inflation risk and real risk of holding Treasury securities made them safer to hold as time went on.
Now let me turn to five factors that I believe played a role in causing the demand for safe, liquid assets to grow faster than the supply of these assets, pushing down Treasury yields and r*. Some of these factors are contributing to the downward trend in U.S. longer-term rates, while others affect global longer-term interest rates more broadly.
The first factor is the liberalization and globalization of capital markets starting in the 1990's. This increased the global demand for safe liquid assets to investors around the world who previously did not have access to U.S. Treasuries. Financial and capital markets and trade around the world were liberalized, and information technology saw advances that aided the global movement of capital, which resulted in an explosion of cross-border finance. For example, the share of external financial claims and external financial liabilities as a share of annual global gross domestic product grew from around 100 percent in 1990 to over 400 percent today. That change reflects the fact that an increasingly large share of the world's wealth is invested abroad, much of it in U.S. debt, including Treasury securities. The rise in foreign official and private purchases of Treasury securities resulted in an increase in the price of U.S. Treasury securities, driving down yields.
The second factor causing demand for Treasury securities to grow more than supply was the large buildup of official reserves that started after the reforms that followed the 1998 financial crisis in Asia. One consequence of removing capital controls and other financial market liberalization in other countries over the past 30 years has been to make foreign governments more vulnerable to sudden capital outflows and financial crises. Many countries have responded by building up their foreign exchange reserves to help weather such stress. Global foreign exchange reserves have increased from around $1 trillion in the early 1990s to $12 trillion today.
Notwithstanding the drumbeat of warnings from some that the U.S. dollar is in danger of losing its primacy in global trade and finance, it remains by a very large margin the world's reserve currency. U.S. government debt, likewise, remains the primary form of low-risk asset, which is reflected in the huge stock of Treasury securities held as foreign exchange reserves around the world. The resulting demand for Treasury securities has contributed to pushing down yields and, thus, lowering r*.
The third factor driving prices up and yields down for Treasuries and similarly affecting r* is sovereign wealth funds. In addition to foreign exchange reserve holdings, sovereign wealth funds from some economies, especially those rich in natural resources, have become an increasingly important way for governments to invest abroad and diversify their national wealth. They are an increasingly significant force in global financial markets. Although sovereign wealth funds are diverse in their holdings, U.S. government debt is typically a sizable share of these funds. Sovereign wealth funds have grown from $1 trillion in assets in 2000 to $11 trillion last year, and a lot of those assets are presumably in U.S. Treasuries. For example, Norway's sovereign wealth fund holdings of Treasuries grew from $5.6 billion to $132.4 billion over this period.8 The growth in Treasury holdings by sovereign wealth funds has clearly contributed to the decline in Treasury yields.
The fourth factor that is thought to have influenced Treasury yields and r* over the past couple of decades is the aging of the population in the United States and around the world. The argument here is that as people move past their prime working years, their demand increases for safe, liquid investments that ensure their principal is preserved for their needs in retirement. U.S. Treasuries fill this need. Aging has been driven by the fact that Americans are living longer, and another big factor has been the aging of the large baby-boom generation, born between 1946 and 1964. The share of the U.S. population aged 65 or older has increased from 12 percent in 1990 to 17 percent today, which is 1 in 6 people. There is evidence that the large number of baby boomers who are retired or planning to do so soon has boosted demand for Treasury securities.9 Outside the United States, population aging is accelerating even faster.
The fifth factor that increased the demand for Treasuries came from many new financial regulations implemented after the 2008 global financial crisis. Regulators in the United States and abroad increasingly wanted banks to hold safer and more liquid assets as part of their balance sheets. For example, the implementation of the Liquidity Coverage Ratio requirement for larger financial institutions in the United States considers Treasury securities preferable to other liquid assets such as mortgage agency debt and mortgage-backed securities. This rule has boosted demand for Treasuries. In the years leading up to the deadline for compliance with the rule, Treasury holdings by large banks increased notably.10 Regulators have also focused on the safety and liquidity of U.S. money market mutual funds, and there has been a dramatic shift in this industry away from prime money funds, which hold private debt instruments, to government money funds that hold U.S. Treasury debt obligations. Thus, we saw a significant increase in regulatory-driven demand for safe, liquid U.S. Treasuries over the past 15 years. On top of this, the Federal Reserve shifted from a limited- to ample-reserves regime to implement monetary policy effectively at the onset of the Global Financial Crisis.11 This regime shift resulted in more Treasury securities permanently held by the Federal Reserve. These policy choices have resulted in higher demand from the public and the Federal Reserve and put downward pressure on yields and r*.
As I mentioned earlier, there has been a lot of debate during the past year as to whether or not r* has increased. If you believe the narrative I have just provided as to what drove down r* over the past 40 years, one must ask which of those factors have reversed. I do not believe any of these factors can explain the possible recent increase in r*, but some may conceivably be a contributing factor to an increase in r* in the future.
Let's consider each factor. First, demographics are such that between 2015 and 2050 the proportion of the world's population over 60 will nearly double from 12 percent to 22 percent. This will continue to put downward, not upward, pressure on r*.
Second, is it possible for liberalization of capital markets to reverse due to increased geopolitical frictions? Possibly, but not yet to any significant degree.
Third, is it likely that central banks and sovereign wealth funds around the world will dramatically decrease their holdings of U.S. Treasuries? Not likely, although the growth in their demand may slow. As I have argued more extensively elsewhere, I do not expect the dollar to lose its status or influence anytime soon, and recent developments, if anything, point more to increased influence for the dollar than to any significant decline.12 On top of this, I don't expect other countries to emerge as substantive issuers of safe and liquid assets to rival Treasuries as an investment, nor any change in the approach of the countries with sovereign wealth funds that would lead them to pull back from their foreign investments.
Finally, is it possible that regulatory pressures forcing financial institutions to hold more safe and liquid government debt will recede and raise r*? The current regulations are likely here to stay, and banks are compliant with the rules. So the growth in regulatory demand for Treasury securities could slow (not increase) substantially. Of course, as financial innovation occurs regulations evolve, so we should watch how this factor as well as all the others can affect r* in the future.
Let's now turn our attention to the supply of Treasury securities and ask if this can possibly explain why r* may be increasing now or in the future. The U.S. government issues Treasuries to finance deficit spending, which obviously impacts Treasury supply. Deficit spending and the federal debt have been increasing since the 1990s. I believe the factors increasing demand that I just reviewed have outstripped the increase in supply over the past few decades, leaving r* lower. But if the growth in the supply of U.S. Treasuries begins to outstrip demand, this will mean lower prices and higher yields, which will put upward pressure on r*.
It is probably not news to many people that the U.S. is on an unsustainable fiscal path.13 The latest outlook from the Congressional Budget Office paints a challenging picture of the future, with debt expected to grow at an unprecedentedly high rate for an economy at full employment and not involved in a major war.14
All of these financing pressures may contribute to a rise in r* in coming years, but only time will tell how large a factor the U.S. fiscal position will be in affecting r*.
Looking ahead, as a policymaker, it is important to understand what is driving any movement in r* to justify using it to guide my policy deliberations. One cannot simply claim r* has risen based on gut feelings—there must be a reasonable economic explanation for why it has risen or fallen. My objective here today was to provide some arguments for what has moved r* over the past several decades and what could move it in the future.
1. The views expressed here are my own and are not necessarily those of my colleagues on the Federal Open Market Committee. Return to text
2. Estimates from econometric models, whether using macroeconomic data, financial market data, or both, typically exhibit large uncertainty bands for any given study. And even these estimates are sensitive to model specification, sample period, data revisions, and more. Approaches that emphasize the underlying determinants of r* also have difficulty in identifying shifts in r* because the important movements in these factors typically occur only at very low frequencies. Information from surveys (at least partially) reflects the estimates from all of these approaches and so cannot speak definitively to movements in r*. Return to text
3. One can see the movement in estimates of r* from the models of Laubach-Williams and Holston-Laubach-Williams reported on the Federal Reserve Bank of New York's website at https://www.newyorkfed.org/research/policy/rstar. Return to text
4. The 10-year real Treasury yield is the sum of current and expected real short-term Treasury yields and a term premium. Both near-term real short rates and term premiums that are affected by current economic conditions must be taken into consideration when teasing out a value of r* from the 10-year Treasury yield. Return to text
5. See, for example, Ricardo Reis (2023), "The Future Long-Run Level of Interest Rates (PDF)," presentation at the SUERF Conference, Vienna, Austria, December; and Emmanuel Farhi and Francois Gourio (2018), "Accounting for Macro-Finance Trends: Market Power, Intangibles, and Risk Premia (PDF)," Brookings Papers on Economic Activity, Fall, 147–223. Return to text
6. See Alexander Monge-Naranjo, Juan M. Sánchez, and Raül Santaeulàlia-Llopis (2019), "Natural Resources and Global Misallocation," American Economic Journal: Macroeconomics, vol. 11 (April), pp. 79–126. Return to text
7. For further review of how different factors are at play, see Ricardo J. Caballero, Emmanuel Farhi, and Pierre-Olivier Gourinchas (2017), "Rents, Technical Change, and Risk Premia Accounting for Secular Trends in Interest Rates, Returns on Capital, Earning Yields, and Factor Shares," American Economic Review, vol. 107 (May). Return to text
8. See Global SWF's website at https://globalswf.com. Return to text
9. For a model that shows how the evolution of the baby boomer generation has affected r* over the past few decades, see Etienne Gagnon, Benjamin K. Johannsen, and David Lopez-Salido (2016), "Understanding the New Normal: The Role of Demographics," Finance and Economics Discussion Series 2016-080 (Washington: Board of Governors of the Federal Reserve System, October). Return to text
10. See figure 1 in Jane Ihrig, Edward Kim, Cindy M. Vojtech, and Gretchen C. Weinbach (2019), "How Have Banks Been Managing the Composition of High-Quality Liquid Assets? (PDF)" Federal Reserve Bank of St. Louis, Review, vol. 101 (Third Quarter), pp. 177–201. Return to text
11. Policy actions taken at the onset of the Global Financial Crisis caused the Federal Reserve to implement policy with an abundant level of reserve balances in the banking system. It was not until 2019 that the FOMC formally announced its plan to implement policy with ample reserves over the longer run. Return to text
12. See Christopher J. Waller (2024), "The Dollar's International Role," speech delivered at "Climate, Currency, and Central Banking," a conference sponsored by the Global Interdependence Center and the University of the Bahamas, Nassau, Bahamas, February 15. Return to text
13. Discussion of growing U.S. deficits is not new. For a discussion of the growing deficit at that time, see, for example, Ben S. Bernanke (2005), "The Global Saving Glut and the U.S. Current Account Deficit," speech delivered at the Sandridge Lecture, Virginia Association of Economists, Richmond, Virginia, March 10. Return to text
14. As reported in February, the Congressional Budget Office projects debt as a share of GDP to reach 116 percent by 2034, which is an amount greater than at any point in the nation's history; see Congressional Budget Office (2024), The Budget and Economic Outlook: 2024 to 2034 (PDF) (Washington: CBO, February). Return to text