September 26, 2017
Inflation, Uncertainty, and Monetary Policy
Chair Janet L. Yellen
At the "Prospects for Growth: Reassessing the Fundamentals" 59th Annual Meeting of the National Association for Business Economics, Cleveland, Ohio
I would like to thank the National Association for Business Economics for inviting me to speak today and for the vital role the association plays in fostering debate on important economic policy questions.
Today I will discuss uncertainty and monetary policy, particularly as it relates to recent inflation developments. Because changes in interest rates influence economic activity and inflation with a substantial lag, the Federal Open Market Committee (FOMC) sets monetary policy with an eye to its effects on the outlook for the economy. But the outlook is subject to considerable uncertainty from multiple sources, and dealing with these uncertainties is an important feature of policymaking. Key among current uncertainties are the forces driving inflation, which has remained low in recent years despite substantial improvement in labor market conditions. As I will discuss, this low inflation likely reflects factors whose influence should fade over time. But as I will also discuss, many uncertainties attend this assessment, and downward pressures on inflation could prove to be unexpectedly persistent. My colleagues and I may have misjudged the strength of the labor market, the degree to which longer-run inflation expectations are consistent with our inflation objective, or even the fundamental forces driving inflation. In interpreting incoming data, we will need to stay alert to these possibilities and, in light of incoming information, adjust our views about inflation, the overall economy, and the stance of monetary policy best suited to promoting maximum employment and price stability.
Recent Inflation Developments and the Outlook
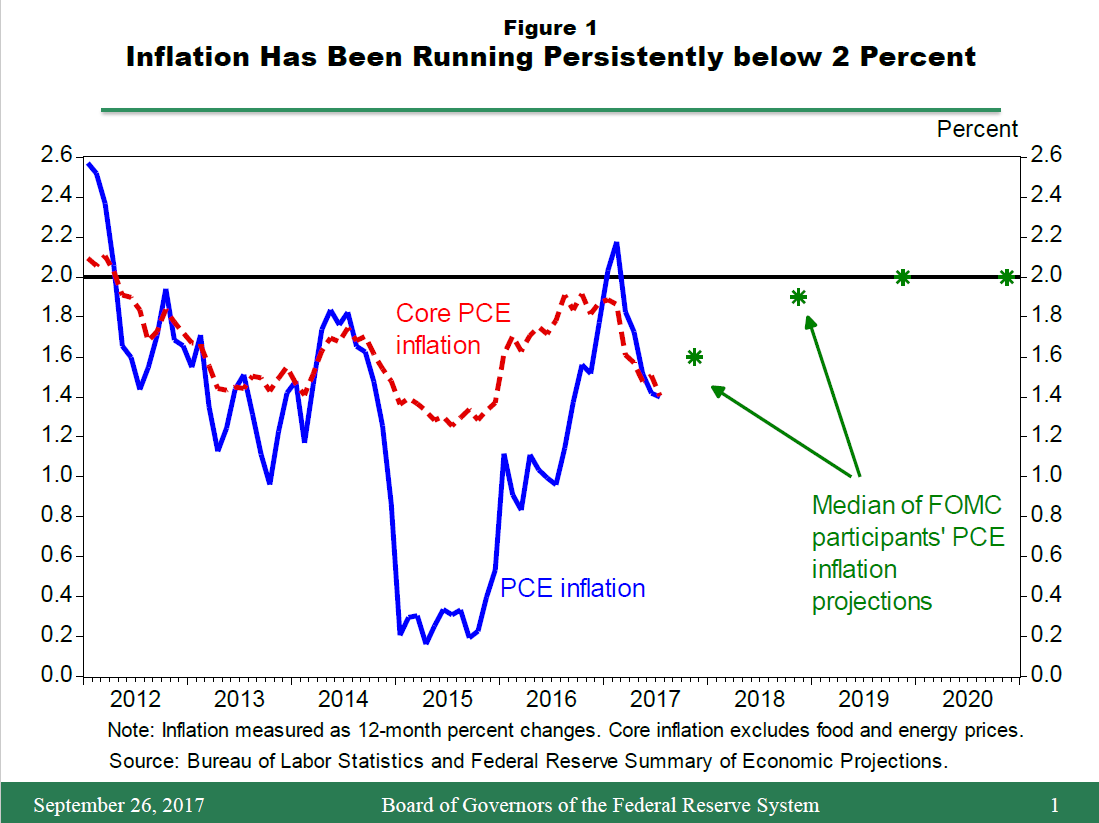
Let me begin by reviewing recent inflation developments and the economic outlook. As the solid blue line in figure 1 indicates, inflation as measured by the price index for personal consumption expenditures (PCE) has generally run below the FOMC's 2 percent longer-run objective since that goal was announced in January 2012.1 Core inflation, which strips out volatile food and energy prices, has also fallen persistently short of 2 percent (the red dashed line). Furthermore, both overall and core inflation, after moving up appreciably last year, have slipped again in recent months. Sustained low inflation such as this is undesirable because, among other things, it generally leads to low settings of the federal funds rate in normal times, thereby providing less scope to ease monetary policy to fight recessions. In addition, a persistent undershoot of our stated 2 percent goal could undermine the FOMC's credibility, causing inflation expectations to drift and actual inflation and economic activity to become more volatile.
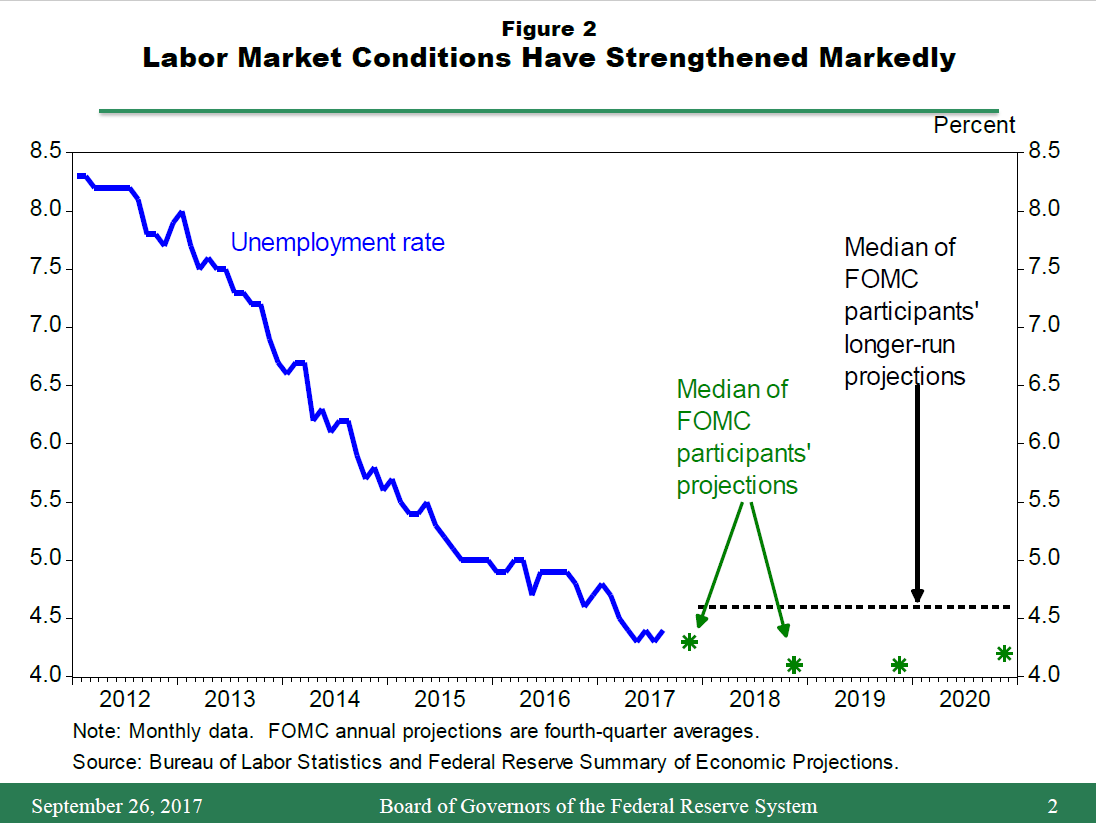
As noted in its recent statement, the FOMC continues to anticipate that, with gradual adjustments in the stance of monetary policy, inflation will rise and stabilize at around 2 percent over the medium term. This expectation is illustrated by the green stars, which represent the medians of the inflation projections submitted by FOMC participants at our meeting last week. In part, this expectation reflects the significant improvement in labor market conditions over the past few years. As shown in figure 2, the unemployment rate (the blue line) now stands at 4.4 percent, somewhat below the median of FOMC participants' estimates of its longer-run sustainable level (the black line). As the green stars indicate, labor market conditions are expected to strengthen a bit further. The inflation outlook also reflects the Committee's judgment that inflation expectations will remain reasonably well anchored at a level consistent with PCE price inflation of 2 percent in the long run, and that the restraint imposed in recent years by a variety of special factors, including movements in the relative prices of food, energy, and imports, will wane in coming quarters.
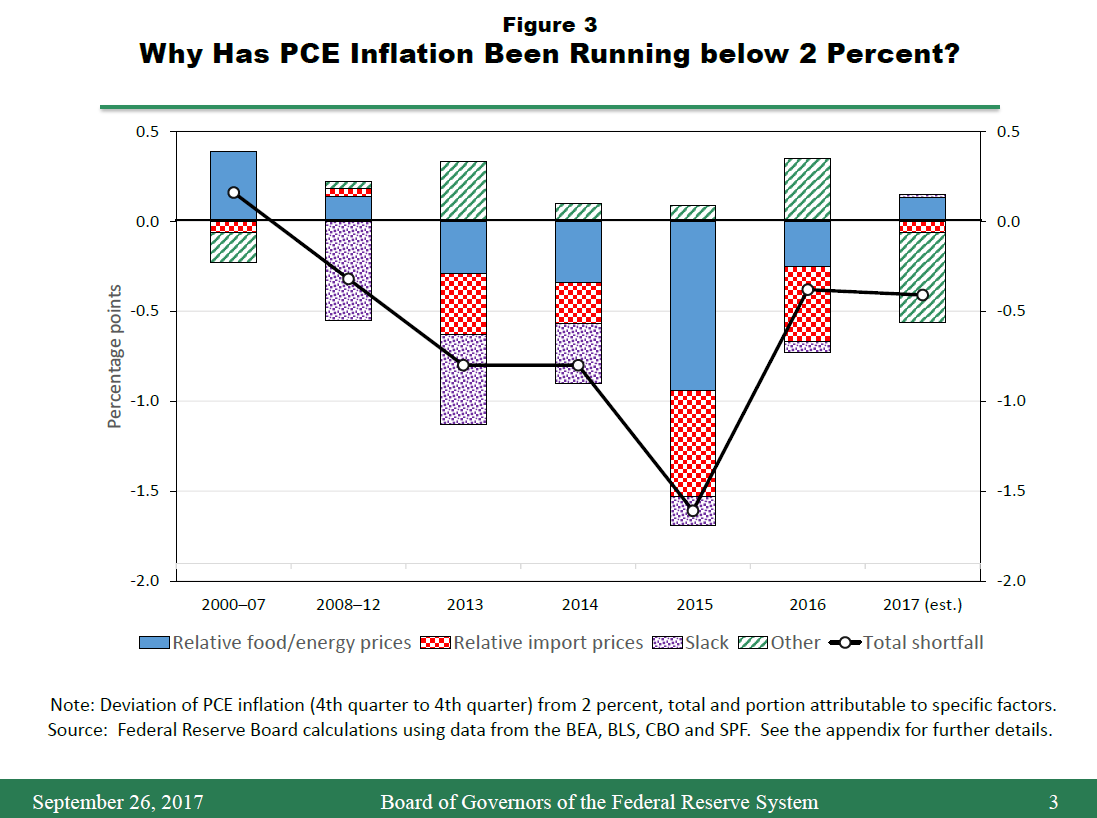
To understand this assessment, it is useful to decompose the forces driving movements in inflation since the financial crisis, as estimated using a simple model of inflation that I presented in a speech two years ago.2 Figure 3 reports this decomposition as the contributions made by various factors to the shortfall of PCE price inflation from 2 percent, year by year. As illustrated by the purple dotted portion of the bars, labor underutilization, or "slack," accounts for a shrinking share of the shortfall since 2012 and is now having a negligible effect. By comparison, the influence of changes in relative food, energy, and import prices--the solid blue and checkered red portions--has been more substantial in the past few years, although their contribution is estimated to have greatly diminished this year.3
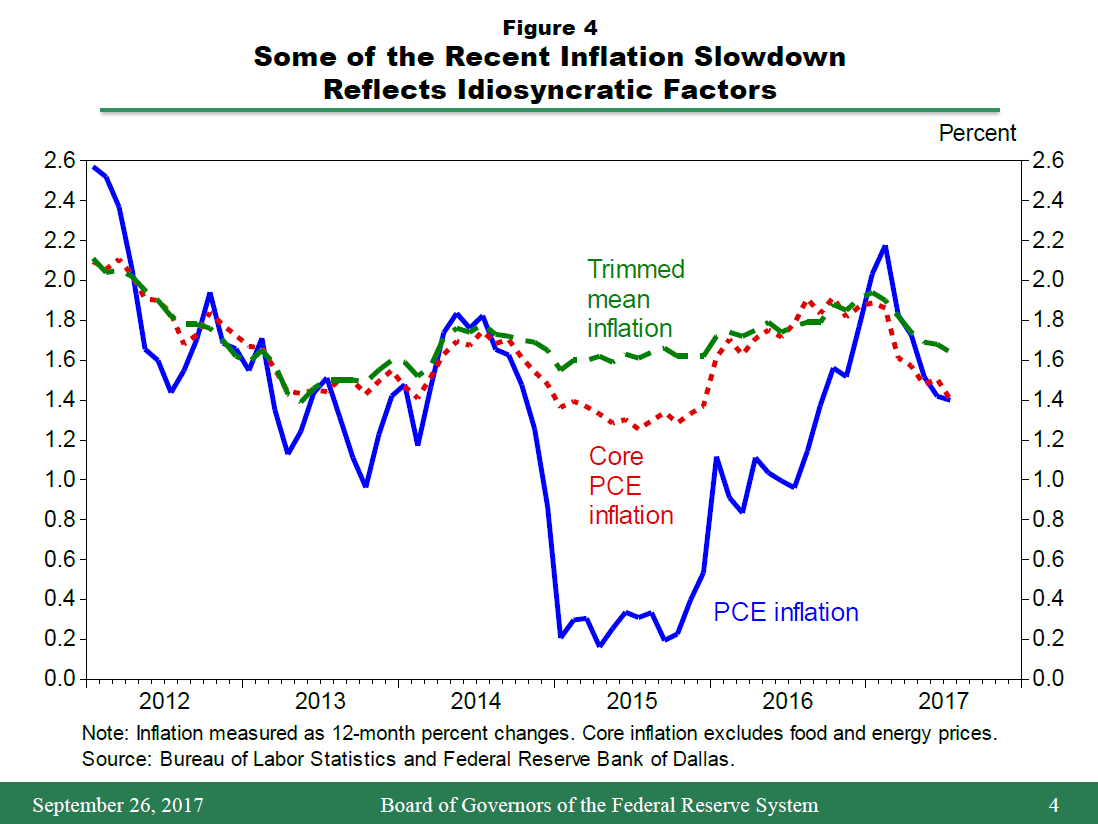
Not surprisingly, the simple model does not account for all of the year-to-year movements in inflation. As indicated by the green striped portion of the bars, the residual component of the shortfall was modestly positive on average from 2008 through last year. This year, however, inflation has been unexpectedly weak from the model's perspective. This unusually large error does not necessarily imply that inflation is more likely to continue to come in on the low side in coming years.4 Some of the recent decline in inflation, although not all, reflects idiosyncratic shifts in the prices of some items, such as the large decline in telecommunication service prices seen earlier in the year, that are unlikely to be repeated. As the green dashed line in figure 4 illustrates, if the average change in consumer prices each month is calculated excluding items whose price changes are outliers on both the high and low side, the resulting "trimmed mean" measure of inflation shows less of a slowdown this year.5
Based on analyses of this sort, my colleagues and I currently think that this year's low inflation is probably temporary, so we continue to anticipate that inflation is likely to stabilize around 2 percent over the next few years. But our understanding of the forces driving inflation is imperfect, and we recognize that something more persistent may be responsible for the current undershooting of our longer-run objective. Accordingly, we will monitor incoming data closely and stand ready to modify our views based on what we learn.
Uncertainty about the Inflation Outlook
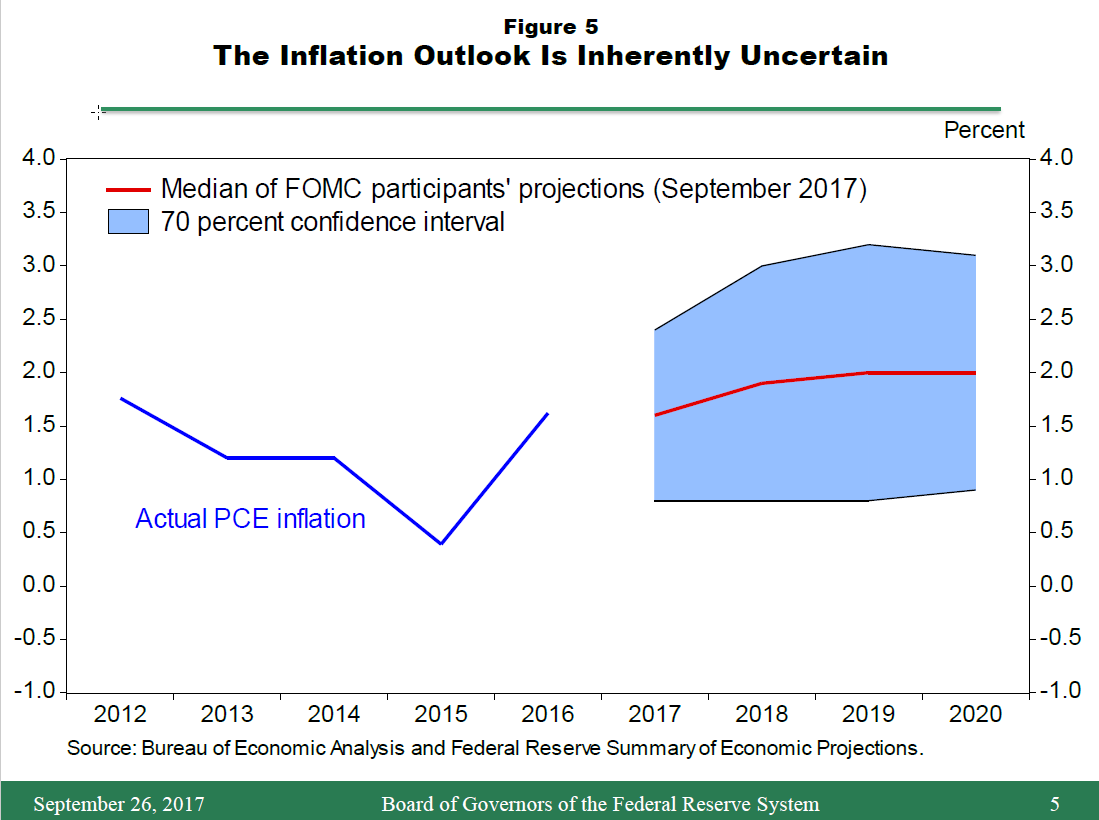
Although we judge that inflation will most likely stabilize around 2 percent over the next few years, the odds that it could turn out to be noticeably different are considerable. This point is illustrated by figure 5. Here the red line indicates the median of the latest inflation projections submitted by FOMC participants that I showed previously. The pertinent feature of this figure is the blue shaded region around the red line, which shows a 70 percent confidence interval around FOMC participants' median outlook. The width of this region reflects the average accuracy of inflation projections made by private and government forecasters over the past 20 years. As the figure shows, based on that history, there is a 30 percent probability that inflation could be greater than 3 percent or less than 1 percent next year.6
Most of this uncertainty reflects the influence of unexpected movements in oil prices and the foreign exchange value of the dollar, as well as that of idiosyncratic developments unrelated to broader economic conditions. These factors could easily push overall inflation noticeably above or below 2 percent for a time. But such disturbances are not a great concern from a policy perspective because their effects fade away as long as inflation expectations remain anchored.7 For this reason, the FOMC strives to look through these transitory inflation effects when setting monetary policy. Such was the case when rising oil prices pushed headline inflation noticeably above 2 percent for several years prior to the financial crisis. Similarly, the Committee substantially discounted the reductions in inflation that occurred from 2014 through 2016 as a result of the decline in oil prices and the effects of the dollar's appreciation on import prices.
A more important issue from a policy standpoint is that some key assumptions underlying the baseline outlook could be wrong in ways that imply that inflation will remain low for longer than currently projected. For example, labor market conditions may not be as tight as they appear to be, and thus they may exert less upward pressure on inflation than anticipated. Alternatively, long-run inflation expectations, which have an important influence on actual inflation, may not be consistent with the FOMC's 2 percent goal. More broadly, the conventional framework for understanding inflation dynamics could be misspecified in some fundamental way. Let's now consider each of these possibilities in turn.
Resource Utilization
The unemployment rate consistent with long-run price stability at any time is not known with certainty; we can only estimate it. The median of the longer-run unemployment rate projections submitted by FOMC participants last week is around 4‑1/2 percent. But the long-run sustainable unemployment rate can drift over time because of demographic changes and other factors, some of which can be difficult to quantify--or even identify--in real time.8 For these and other reasons, the statistical precision of such estimates is limited, and the actual value of the sustainable rate could well be noticeably lower than currently projected.9 Thus, although FOMC participants generally view current labor utilization as probably somewhat greater than what can be sustained in the longer run, the statistical evidence from past experience does not rule out the possibility that some slack still remains in the labor market. If so, the economy could sustain a higher level of employment and output in the longer run than now anticipated--a very beneficial outcome, albeit one that would require recalibrating monetary policy over time in order to reap those benefits and compensate for the accompanying reduction in inflationary pressures.
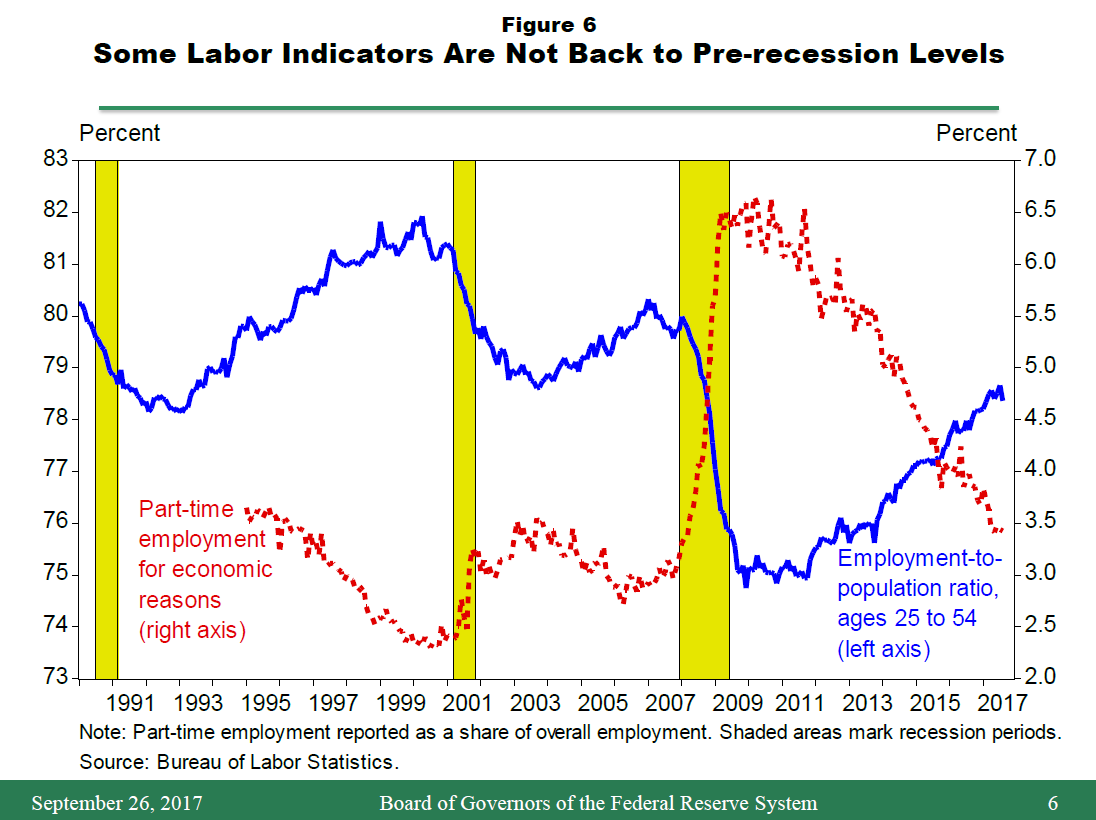
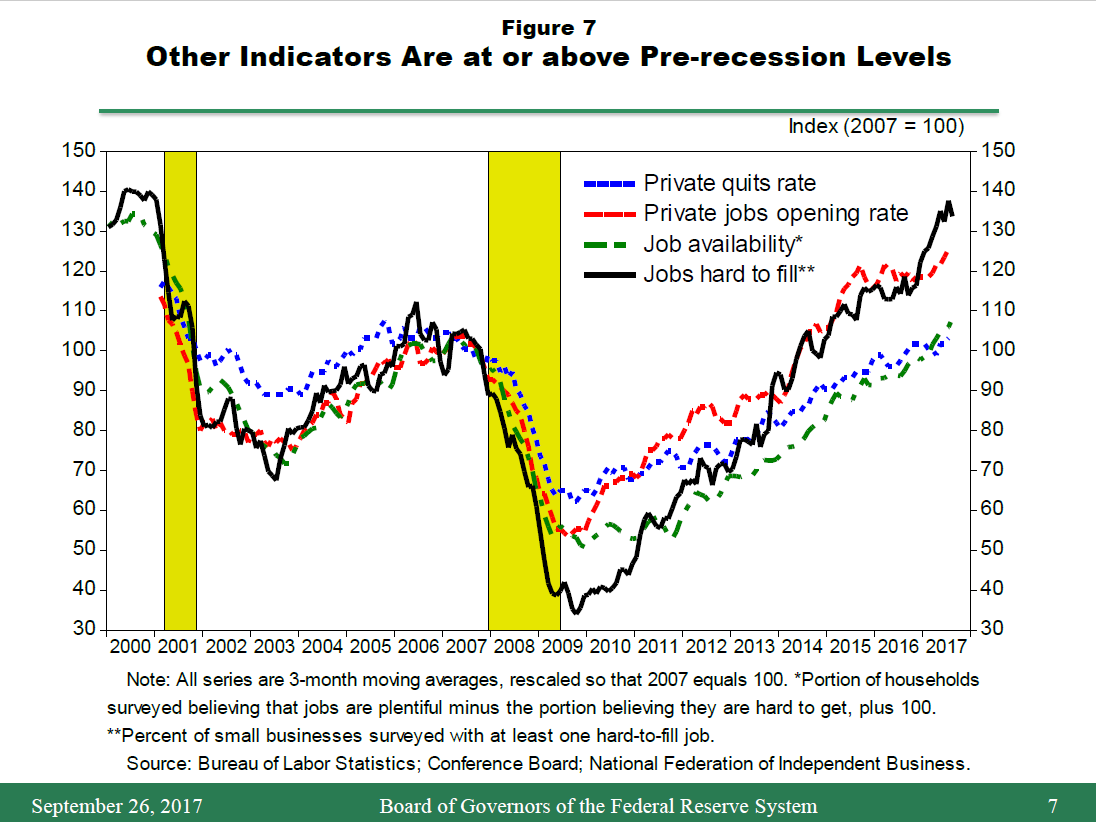
A related question is whether the unemployment rate alone is an adequate gauge of economic slack for the purposes of explaining inflation. Although the unemployment rate is probably the best single summary measure of labor utilization, some indicators have shown less improvement since the financial crisis.10 As the solid blue line in figure 6 illustrates, the employed share of the "prime-age worker" population--that is, persons from ages 25 to 54--remains noticeably below the 2007 level.11 But employment rates for this group may now be permanently lower than in the past as a result of declining employment opportunities for less-skilled workers, a rising number of people receiving disability insurance, and other worrisome trends.12 Similarly, although the share of part-time workers who would like a full-time job is still somewhat above where it stood before the last two recessions (the dashed red line), it could reflect a structural change in firms' reliance on part-time labor.13 In addition, these two measures have to be weighed against other labor indicators that have either returned to, or are currently above, their pre-recession levels. As shown in figure 7, those indicators include the quits rate (the short-dashed blue line), household perceptions of job availability (the short-and-long-dashed green line), the jobs opening rate (the long-dashed red line), and the percentage of small firms finding it hard to fill jobs (the solid black line).
On balance, the unemployment rate probably is correct in signaling that overall labor market conditions have returned to pre-crisis levels. But that return does not necessarily demonstrate that the economy is now at maximum employment because, due to demographic and other structural changes, the unemployment rate that is sustainable today may be lower than the rate that was sustainable in the past.
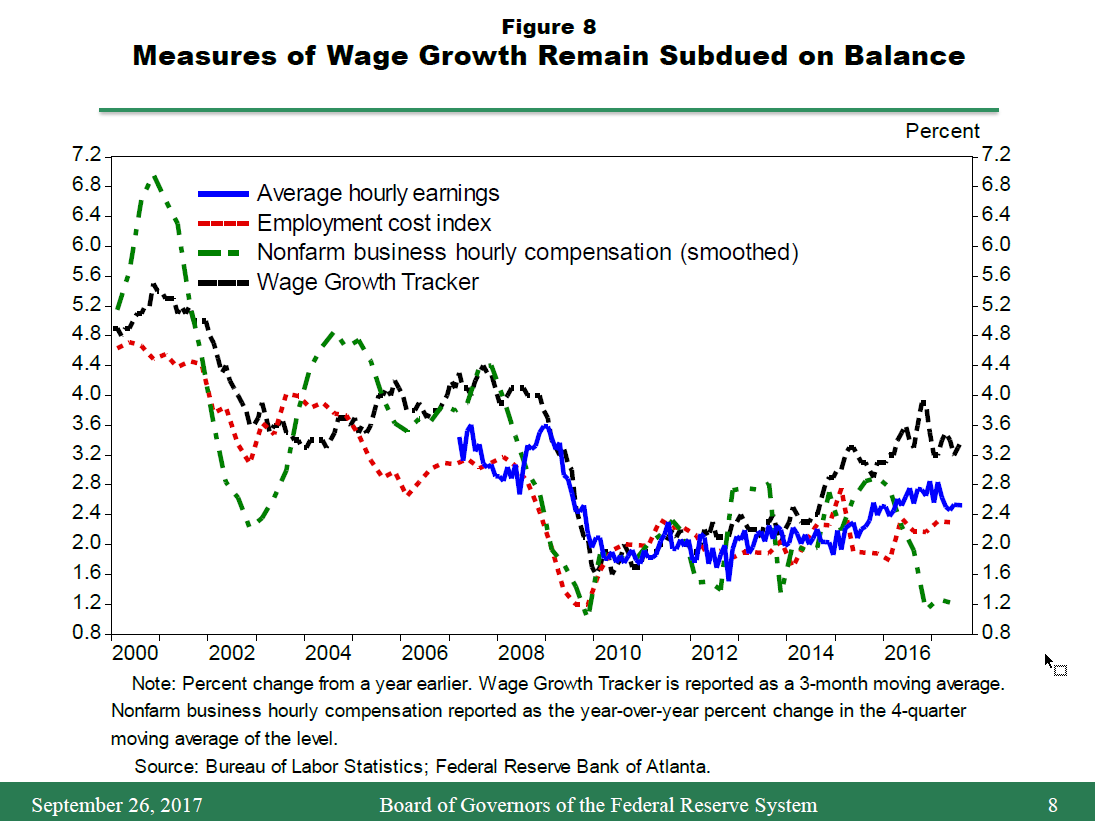
In that regard, some observers have pointed to the continued subdued pace of wage growth as evidence that the economy is not yet back to full employment. As shown in figure 8, labor compensation as measured by the employment cost index (the short-dashed red line) has been growing at more or less the same rate since 2014, and hourly compensation in the nonfarm business sector (the short-and-long-dashed green line)--a quite noisy measure, even after smoothing--is actually growing more slowly. But growth in average hourly earnings (the solid blue line) and the Atlanta Fed's Wage Growth Tracker (the long-dashed black line) have clearly picked up.14 In addition, productivity growth has been quite weak in recent years, and empirical analysis suggests that it is has been holding down aggregate growth in labor compensation independent of labor utilization in recent years.15 An analysis of the pattern of wage growth at the U.S. state level also suggests that subdued growth for the country as a whole probably reflects sluggish productivity or some other factor common to all states, because cross-state differences in wage growth are about what one would expect given cross-state differences in unemployment rates.16 Finally, I would note that the percentage of firms planning wage increases has moved back up to its pre-recession level, many firms report difficulties in finding qualified workers, and some have responded by expanding training programs and offering signing bonuses--possible harbingers of stronger wage gains to come.
Overall, I view the data we have in hand as suggesting a generally healthy labor market, not one in which substantial slack remains or one that is overheated. That said, the evidence does not allow for any definitive assessment, so policymakers must remain open minded on this question and its implications for reaching our inflation goal.
Inflation Expectations
Another source of uncertainty concerns inflation expectations. In standard economic models, inflation expectations are an important determinant of actual inflation because, in deciding how much to adjust wages for individual jobs and prices of goods and services at a particular time, firms take into account the rate of overall inflation they expect to prevail in the future. Monetary policy presumably plays a key role in shaping these expectations by influencing the average rate of inflation experienced in the past over long periods of time, as well as by providing guidance about the FOMC's objectives for inflation in the future. Even so, economists' understanding of exactly how and why inflation expectations change over time is limited.17 Moreover, we have to contend with the fact that we do not directly observe the inflation expectations relevant to wage and price setting. Instead, we can only imperfectly infer how they might have changed based on survey responses and other data.
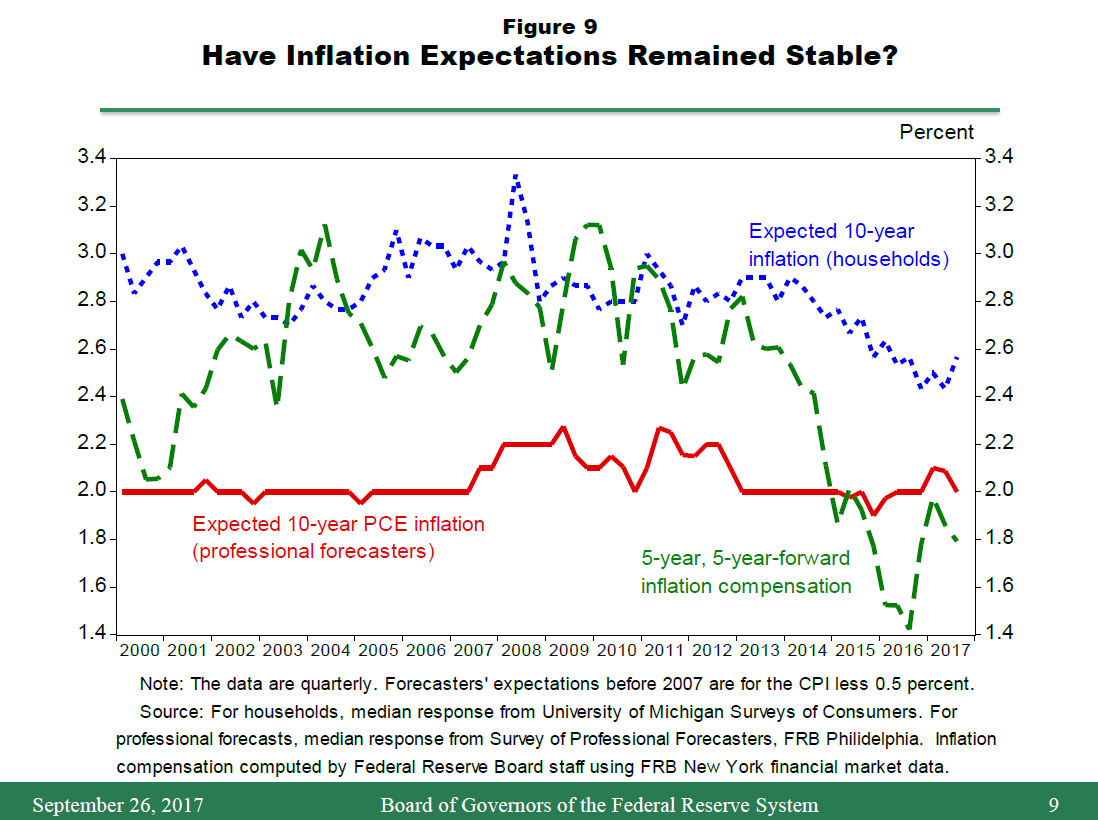
The FOMC's outlook depends importantly on the view that longer-run inflation expectations have been stable for many years at a level consistent with PCE price inflation that will average around 2 percent in the longer run. Provided this stability continues, standard models suggest that actual inflation should stabilize at about 2 percent over the next two or three years in an environment of roughly full employment, absent any future shocks. However, there is a risk that inflation expectations may not be as well anchored as they appear and perhaps are not consistent with our 2 percent goal. To assess this risk, the FOMC considers a variety of survey measures of expected longer-run inflation, some of which are shown in figure 9. Long-range projections of PCE price inflation made by private forecasters, the solid red line, have been remarkably stable for many years, as have been the longer-run inflation expectations reported in surveys of financial market participants (not shown).18 Households' longer-term expectations as reported in the University of Michigan Surveys of Consumers, the short-dashed blue line, have also been fairly stable overall since the late 1990s.19 That said, results from this survey, as well as a survey of consumers carried out by the Federal Reserve Bank of New York, do hint that expectations may have slipped a bit over the past two or three years. If so, stabilizing inflation at around 2 percent could prove to be more difficult than expected.20
In theory, differences between yields on conventional Treasury securities and those on Treasury Inflation-Protected Securities (TIPS) are also informative about inflation expectations in that they measure the compensation received by investors for exposing themselves to future changes in consumer prices. As indicated by the long-dashed green line, TIPS inflation compensation for the five-year period starting five years from now has fallen roughly 1 percentage point over the past three years. This decline could be interpreted as a significant drop in market participants' expectations for the most likely outcome for inflation in the longer run. However, research suggests that the fall in TIPS inflation compensation instead primarily reflects a decline in inflation risk premiums and differences in the liquidity of nominal and indexed Treasury securities.21 This research notwithstanding, the notable decline in inflation compensation may be a sign that longer-term inflation expectations have slipped recently.
Misspecified Inflation Dynamics
Another risk is that our framework for understanding inflation dynamics could be misspecified in some fundamental way, perhaps because our econometric models overlook some factor that will restrain inflation in coming years despite solid labor market conditions. One possibility in this vein is a continuation of the subdued growth in health-care prices that we have seen in recent years--a sector-specific factor not controlled for in standard models. Because health care accounts for a large share of total consumer spending, this slow growth has restrained overall inflation materially and may continue to do so for some time.22 A similar situation occurred during the 1990s, when a significant shift in health insurance enrollment away from fee-for-service and toward HMO (that is, Health Maintenance Organization) plans reduced cost pressures and held down overall inflation for several years. If these sorts of favorable supply-type shocks continue, achieving our 2 percent inflation goal over the medium term may require a more accommodative stance of monetary policy than might otherwise be appropriate.
Some commentators have conjectured that, because of rising trade volumes and the integration of production chains across countries, U.S. inflation now depends on global resource utilization, not just on conditions here at home and those effects arising through movements in energy and import prices. However, studies of this issue do not, on balance, provide much empirical support for this possibility.23 Moreover, foreign economic growth has firmed this year and the global economy appears to have largely recovered, so any influence that global resource utilization might have on U.S. inflation would presumably be small. Nevertheless, increased competition from the integration of China and other emerging market countries into the world economy may have materially restrained price margins and labor compensation in the United States and other advanced economies. In fact, one study concludes that most of the decline in the labor share of national income in the United States since the late 1980s can be attributed to offshoring of labor-intensive production.24 If this restraint on the labor share continues to build over the next few years (and not merely holds steady), then it could indirectly hold down the growth of domestic wages and prices in ways not captured by conventional models.
More speculatively, changes in the structure of the domestic economy may also be altering inflation dynamics in ways not captured by conventional models. The growing importance of online shopping, by increasing the competitiveness of the U.S. retail sector, may have reduced price margins and restrained the ability of firms to raise prices in response to rising demand.25 That said, the economy overall appears to have become more concentrated and less dynamic in recent years, which may tend to increase firms' pricing power.26 Because these changes occur slowly, determining their complex effects on the economy will, as a practical matter, require studying data over a considerable time.
Finally, I would note the possibility that inflation may rise more sharply in response to robust labor market conditions than anticipated. The influence of labor utilization on inflation has become quite modest over the past 20 years, implying that the inflationary consequences of misjudging the sustainable rate of unemployment are low. But we cannot be sure that this modest sensitivity will persist in the face of strong labor market conditions, given that we do not fully understand how it came to be so modest in the first place. Although the evidence is weak that inflation responds in a nonlinear manner to resource utilization, this risk is one that we cannot entirely dismiss.
Policy Implications
What are the policy implications of these uncertainties? For one, my colleagues and I must be ready to adjust our assessments of economic conditions and the outlook when new data warrant it. In this spirit, FOMC participants--like private forecasters--have reduced their estimates of the sustainable unemployment rate appreciably over the past few years in response to the continual flow of information about the always changing economy.27 To the extent these assessments change over time, so too will the outlook and judgments about the appropriate stance of monetary policy. Importantly, even if resource utilization is currently lower than we estimate or if longer-run inflation expectations are running at levels consistent with longer-run PCE price inflation somewhat below 2 percent, the FOMC can still achieve its inflation goal. Under those conditions, continuing to revise our assessments in response to incoming data would naturally result in a policy path that is somewhat easier than that now anticipated--an appropriate course correction that would reflect our commitment to maximum employment and price stability.
Similar considerations apply to other important sources of uncertainty, such as the value of the neutral real interest rate--that is, the inflation-adjusted level of the federal funds rate consistent with keeping the economy operating on an even keel. Estimates of this rate have declined considerably in recent years, and, by some estimates, the real neutral rate is currently close to zero. But the neutral rate changes over time as a result of the interaction of many forces, including demographics, productivity growth, fiscal policy, and the strength of global demand, so its value at any point in time cannot be estimated or projected with much precision. My FOMC colleagues and I will therefore need to continue to reassess and revise our assessments of the neutral rate in response to incoming data and adjust monetary policy accordingly.
How should policy be formulated in the face of such significant uncertainties? In my view, it strengthens the case for a gradual pace of adjustments. Moving too quickly risks overadjusting policy to head off projected developments that may not come to pass. A gradual approach is particularly appropriate in light of subdued inflation and a low neutral real interest rate, which imply that the FOMC will have only limited scope to cut the federal funds rate should the economy be hit with an adverse shock.28 But we should also be wary of moving too gradually. Job gains continue to run well ahead of the longer-run pace we estimate would be sufficient, on average, to provide jobs for new entrants to the labor force. Thus, without further modest increases in the federal funds rate over time, there is a risk that the labor market could eventually become overheated, potentially creating an inflationary problem down the road that might be difficult to overcome without triggering a recession. Persistently easy monetary policy might also eventually lead to increased leverage and other developments, with adverse implications for financial stability. For these reasons, and given that monetary policy affects economic activity and inflation with a substantial lag, it would be imprudent to keep monetary policy on hold until inflation is back to 2 percent.
Conclusion
To conclude, standard empirical analyses support the FOMC's outlook that, with gradual adjustments in monetary policy, inflation will stabilize at around the FOMC's 2 percent objective over the next few years, accompanied by some further strengthening in labor market conditions. But the outlook is uncertain, reflecting, among other things, the inherent imprecision in our estimates of labor utilization, inflation expectations, and other factors. As a result, we will need to carefully monitor the incoming data and, as warranted, adjust our assessments of the outlook and the appropriate stance of monetary policy. But in making these adjustments, our longer-run objectives will remain unchanged--to promote maximum employment and 2 percent inflation.
Appendix: PCE Inflation Model, Inflation Decomposition Procedure, and the ECI Growth Equation
PCE Inflation Model
The inflation model used in the decomposition procedure includes two equations: an identity for the change in the price index for total personal consumption expenditures (PCE) and a simple reduced-form forecasting equation for core PCE price inflation. The identity is
$$$$ \pi_t=\pi_t^c+\omega_t^e{RPIE}_t+\omega_t^f{RPIF}_t,$$$$
where $$ \pi_t$$ and $$ \pi_t^c$$ denote growth rates (expressed as annualized log differences) of total and core PCE prices, respectively. $$ {RPIE}_t$$ and $$ {RPIF}_t$$ are annualized growth rates for prices of consumer energy goods and services and prices of food and beverages, both expressed relative to core PCE prices, and $$ \omega_t^e$$ and $$ \omega_t^f$$ are the weights of energy and food in total consumption. The core inflation forecasting equation is
$$$$ \pi_t^c=.41\pi_t^e+.36\pi_{t-1}^c+.23\pi_{t-2}^c-.08{SLACK}_t+.56{RPIM}_t+\epsilon_t,$$$$
where $$ \pi_t^e$$ is expected long-run inflation; $$ {SLACK}_t$$ denotes the level of resource utilization, $$ {RPIM}_t$$ controls for the effect of changes in the relative price of core imported goods, $$ \epsilon_t$$ is a white-noise error term, and the coefficients are ordinary least squares estimates obtained using data from 1990:Q1 to 2014:Q4. 29
For estimation purposes, $$ {SLACK}_t$$ is approximated using the unemployment rate less the Congressional Budget Office's (CBO) historical series for the long-run natural rate. From 2007 to the present, $$ \pi_t^e$$ is approximated using the median forecasts of long-run PCE price inflation reported in the Survey of Professional Forecasters; from 1991:Q4 to 2006:Q4, the series is based on the median long-run forecasts of inflation as measured by the consumer price index (CPI), less a constant adjustment of 40 basis points to put the CPI forecasts on a PCE basis; before 1991:Q4, $$ \pi_t^e$$ is approximated by the long-run inflation expectations reported in the Hoey survey. The relative import price term, $$ {RPIM}_t$$, is defined as the annualized growth rate of the price index for core imported goods (defined to exclude petroleum, natural gas, computers, and semiconductors) less the lagged four-quarter change in core PCE inflation, all multiplied by the share of nominal core imported goods in nominal GDP.30
Inflation Decomposition Procedure
To decompose recent movements in inflation into its various components, the series used in the inflation model--for which complete quarterly data are available only through 2017:Q2 in most cases--are first extended through the end of 2017. In the case of inflation, the extensions are consistent with the medians of Federal Open Market Committee (FOMC) participants' projections for total and core PCE inflation in 2017 that were reported at the press conference following the September 2017 FOMC meeting.31 Similarly, $$ {SLACK}_t$$ over the second half of 2017 is defined to be consistent with the median of FOMC projections for the 2017:Q4 unemployment rate less the CBO's estimates of the historical path of the long-run natural rate. The CBO's 2017 estimate is slightly higher than the median of FOMC participants' most recent projections of the normal longer-run level of the unemployment rate. For changes in the price of core imports, the 2017:H2 extrapolations are based on a regression of this series on current and lagged changes in exchange rates. This approach predicts that core import prices should rise about 4-1/2 percent at an annual rate in the second half of this year.32 Energy and food prices over the second half of 2017 are assumed to rise at annual rates of 10 percent and 1.6 percent, respectively; these assumptions (which take into account published monthly PCE data through July and published CPI data through August, as well as recent movements in gasoline prices in the wake of Hurricanes Harvey and Irma) ensure that the combined contribution of food and energy prices to inflation in 2017 is consistent with the median difference between FOMC participants' projections for total and core inflation. Finally, nominal spending shares for food, energy, and core imports are assumed to remain unchanged at their 2017:Q2 levels, and long-run inflation expectations are assumed to remain constant at 2 percent.
After computing historical $$ \epsilon_t$$ tracking errors for the two equations of the model, the final step in the decomposition procedure is to run a sequence of counterfactual simulations of the model from 1990:Q1 through 2017:Q4. One by one, each explanatory variable of the model is set to zero, and the model is simulated; the resulting difference between actual inflation and its simulated value equals the historical contribution of that particular factor. Importantly, the simulations are all dynamic in that the lagged inflation term in the core inflation equation is set equal to its simulated value in the preceding period rather than its actual value. As a result, the decompositions incorporate the effects of changes in lagged inflation that are attributable to previous movements in the explanatory variables.
ECI Growth Equation
The estimated equation for the employment cost index (ECI) is:
$$$$ \pi_t^w=-0.72+.58\pi_{t-1}^e+.10\pi_{t-1}^w+.12\pi_{t-2}^w+.10\pi_{t-3}^w+.11\pi_{t-4}^w-.19{SLACK}_t-.57\Delta{SLACK}_t+.58{MA\_PROD}_t+\varepsilon_t,$$$$
where $$ \pi_t^w$$ is the annualized log difference of the ECI for hourly compensation of private industry workers, $$ \pi_t^e$$ and $$ {SLACK}_t$$ have the same definition as the corresponding variables from the PCE price inflation model, $$ \Delta{SLACK}_t$$ denotes the first difference of $$ {SLACK}_t$$, $$ {MA\_PROD}_t$$ is a moving average of an estimate of trend productivity growth for the business sector, and $$ \varepsilon_t$$ is an error term.33 The coefficients are obtained from a restricted least squares regression using quarterly data from 1988:Q1 to 2017:Q2.34 Trend productivity growth is estimated as the low-frequency component of the annualized log difference of business-sector output per hour from the Bureau of Labor Statistics Productivity and Costs report.35 The moving average of trend productivity growth (which is used in the estimation) is computed as a geometrically declining weighted average,
$$$$ {MA\_PROD}_t=0.95{MA\_PROD}_{t-1}+0.05{PROD}_t,$$$$
where $$ {PROD}_t$$ denotes trend productivity growth and where the moving average is initialized in 1955:Q1 with that quarter's estimate of the trend growth rate.
The model is used to compute a decomposition of ECI growth following a procedure similar to that used to construct the decomposition for core PCE price inflation. The table summarizes the results of this decomposition over various periods; note that the column labeled "Slack" combines the effects of $$ \Delta{SLACK}_t$$ and $$ {SLACK}_t$$, the effect of the model's constant term is included in the column labeled "Trend productivity," and the column labeled "Other" gives the contributions of the model's tracking errors.
Model-Based Decomposition of ECI Hourly Compensation Growth
| ECI growth | Contributions of: | ||||
|---|---|---|---|---|---|
| Expected inflation |
Trend productivity |
Slack | Other | ||
| 2002-07 | 3.28 | 2.09 | 1.44 | -0.08 | -0.17 |
| 2008-09 | 1.80 | 2.16 | 1.18 | -0.97 | -0.56 |
| 2010-11 | 2.08 | 2.14 | 0.82 | -1.09 | 0.22 |
| 2012-13 | 1.92 | 2.12 | 0.44 | -0.67 | 0.02 |
| 2014-15 | 2.05 | 2.01 | 0.15 | -0.20 | 0.09 |
| 2016-17:Q2 | 2.31 | 1.99 | 0.01 | 0.03 | 0.28 |
Note: ECI growth is reported as average percent changes at an annual rate for the periods shown; contributions are expressed in percentage points. The contribution of the model's constant term is included in the contribution for trend productivity. Contributions may not sum to total growth because of rounding.
References
Aaronson, Daniel, Luojia Hu, Arian Seifoddini, and Daniel G. Sullivan (2015). "Changing Labor Force Composition and the Natural Rate of Unemployment," Chicago Fed Letter 338. Chicago: Federal Reserve Bank of Chicago, May.
Aaronson, Stephanie, Tomaz Cajner, Bruce Fallick, Felix Galbis-Reig, Christopher Smith, and William Wascher (2014). "Labor Force Participation: Recent Developments and Future Prospects," Brookings Papers on Economic Activity, Fall, pp. 197-255.
Acemoglu, Daron, and David Autor (2011). "Skills, Tasks and Technologies: Implications for Employment and Earnings," in David Card and Orley Ashenfelter, eds., Handbook of Labor Economics, vol. 4B (Amsterdam: North Holland), pp. 1043-171.
Andreasen, Martin M., and Jens H.E. Christensen (2016). "TIPS Liquidity and the Outlook for Inflation," FRBSF Economic Letter 2016-35. San Francisco: Federal Reserve Bank of San Francisco, November 21.
Autor, David, David Dorn, and Gordon Hanson (2013). "The China Syndrome: Local Labor Market Effects of Import Competition in the United States," American Economic Review, vol. 103 (October), pp. 2121-68.
Autor, David H., and Mark G. Duggan (2003). "The Rise in the Disability Rolls and the Decline in Unemployment," Quarterly Journal of Economics, vol. 118 (February), pp. 157-205.
Barnichon, Regis, and Christian Matthes (2017). "The Natural Rate of Unemployment over the Past 100 Years," FRBSF Economic Letter 2017-23. San Francisco: Federal Reserve Bank of San Francisco, August 14.
Barnichon, Regis, and Geert Mesters (2017). "How Tight Is the U.S. Labor Market?" FRBSF Economic Letter 2017-07. San Francisco: Federal Reserve Bank of San Francisco, March 20.
Borio, Claudio, and Andrew Filardo (2007). "Globalization and Inflation: New Cross-Country Evidence on the Global Determinants of Domestic Inflation (PDF)," BIS Working Paper 227. Basel, Switzerland: Bank for International Settlements, May.
Case, Anne, and Angus Deaton (2017). "Mortality and Morbidity in the 21st Century (PDF)," Brookings Papers on Economic Activity, Spring, pp. 397-476.
Clemens, Jeffery, Joshua D. Gottlieb, and Adam Hale Shapiro (2016). "Medicare Payment Cuts Continue to Restrain Inflation," FRBSF Economic Letter 2016-15. San Francisco: Federal Reserve Bank of San Francisco, May 9.
Council of Economic Advisers (2016). "Benefits of Competition and Indicators of Market Power (PDF)," Council of Economic Advisers Issue Brief. Washington: CEA, April.
Curran, Enda, and Michelle Jamrisko (2017). "Expect a Return to Inflation--But Not as We Once Knew It," Bloomberg, May 16, www.bloomberg.com/news/articles/2017-05-16/amazon-effect-means-global-inflation-just-ain-t-what-it-once-was.
Daly, Mary C., and Bart Hobijn (2017). "Composition and Aggregate Real Wage Growth," American Economic Review, vol. 107 (May), pp. 349-52.
Daly, Mary C., Bart Hobijn, and Benjamin Pyle (2016). "What's Up with Wage Growth?" FRBSF Economic Letter 2016-07. San Francisco: Federal Reserve Bank of San Francisco, March 7.
Decker, Ryan A., John Haltiwanger, Ron S. Jarmin, and Javier Miranda (2016). "Declining Business Dynamism: Implications for Productivity?" Hutchins Center Working Paper 23. Washington: Hutchins Center on Fiscal and Monetary Policy, Brookings Institution, September.
Deming, David J. (forthcoming). "The Growing Importance of Social Skills in the Labor Market," Quarterly Journal of Economics.
Elsby, Michael W., Bart Hobijn, and Aysegul Sahin (2013). "The Decline of the U.S. Labor Share (PDF)," Brookings Papers on Economic Activity, Fall, pp. 1-52.
Feenstra, Robert C., and David E. Weinstein (2017). "Globalization, Markups, and U.S. Welfare," Journal of Political Economy, vol. 125 (August), pp. 1040-74.
French, Eric, and Jae Song (2014). "The Effect of Disability Insurance Receipt on Labor Supply," American Economic Journal: Economic Policy, vol. 6 (May), pp. 291-337.
Hathaway, Ian, and Robert E. Litan (2014). Declining Business Dynamism in the United States: A Look at States and Metros. Washington: Brookings Institution, May.
Ihrig, Jane, Steven B. Kamin, Deborah Lindner, and Jaime Marquez (2010). "Some Simple Tests of the Globalization and Inflation Hypotheses," International Finance, vol. 13 (Winter), pp. 343-75.
J.P. Morgan (2017). "U.S.: Tight State Labor Markets Show Effects on Wage Growth," Economic Research Note. New York: J.P. Morgan, August 3.
Juselius, Mikael, and Elod Takats (2015). "Can Demography Affect Inflation and Monetary Policy?" BIS Working Paper 485. Basel, Switzerland: Bank for International Settlements, February.
Peneva, Ekaterina (2014). "Residual Seasonality in Core Consumer Price Inflation," FEDS Notes. Washington: Board of Governors of the Federal Reserve System, October 14.
Pierce, Justin R., and Peter K. Schott (2016). "The Surprisingly Swift Decline of US Manufacturing Employment," American Economic Review, vol. 106 (July), pp. 1632-62.
Reifschneider, David, and Peter Tulip (2017). "Gauging the Uncertainty of the Economic Outlook Using Historical Forecasting Errors: The Federal Reserve's Approach (PDF)," Finance and Economics Discussion Series 2017-020. Washington: Board of Governors of the Federal Reserve System, February.
Reifschneider, Dave, William Wascher, and David Wilcox (2015). "Aggregate Supply in the United States: Recent Developments and Implications for the Conduct of Monetary Policy," IMF Economic Review, vol. 63 (May), pp. 71-109.
Schanzenbach, Diane Whitmore, Ryan Nunn, Lauren Bauer, and Audrey Breitwieser (2017). The Closing of the Jobs Gap: A Decade of Recession and Recovery. Washington: Hamilton Project, Brookings Institution, August 4.
Trainer, David (2016). "How the Internet Economy Killed Inflation," Forbes, September 28.
Valletta, Rob, and Catherine van der List (2015). "Involuntary Part-Time Work: Here to Stay?" FRBSF Economic Letter 2015-19. San Francisco: Federal Reserve Bank of San Francisco, June 8.
Yellen, Janet L. (2014). "Labor Market Dynamics and Monetary Policy," speech delivered at "Re-evaluating Labor Market Dynamics," a symposium sponsored by the Federal Reserve Bank of Kansas City, held in Jackson Hole, Wyo., August 21-23.
-------- (2015). "Inflation Dynamics and Monetary Policy," speech delivered at the Philip Gamble Memorial Lecture, University of Massachusetts, Amherst, Amherst, Mass., September 24.
-------- (2016). "Macroeconomic Research after the Crisis," speech delivered at "The Elusive 'Great' Recovery: Causes and Implications for Future Business Cycle Dynamics," 60th annual economic conference sponsored by the Federal Reserve Bank of Boston, Boston, Mass., October 14.
Yoon, Jong-Won, Janill Kim, and Jungjin Lee (2014). "Impact of Demographic Changes on Inflation and the Macroeconomy (PDF)," IMF Working Paper WP/14/210. Washington: International Monetary Fund, November.
1. The Statement on Longer-Run Goals and Monetary Policy Strategy is available on the Board's website at www.federalreserve.gov/monetarypolicy/files/FOMC_LongerRunGoals.pdf. Return to text
2. The simple model links the current rate of inflation to several factors, including lagged inflation, long-run inflation expectations, labor utilization, and changes in the relative prices of food, energy and imports (Yellen, 2015). Additional details on the model can be found in the appendix. Return to text
3. In the decomposition procedure, movements in core inflation affect headline inflation one-for-one; as a result, the contributions of food and energy price inflation are defined as each component's price change relative to the core, weighted by its share in total nominal consumer spending. The estimated contribution of movements in import prices is also computed relative to core inflation; thus, if import prices are rising at the same rate as core inflation, they have no estimated effect on the shortfall of overall inflation from 2 percent. In addition, the decomposition takes account of lags in the adjustment of core inflation to movements in resource utilization and other factors. More details on the decomposition procedure can be found in the appendix. Return to text
4. In the simple model, inflation depends in part on lagged inflation. As a result, an unexplained movement in inflation is predicted to influence inflation beyond the current quarter, but to a degree that fades over time. On average, the model predicts that roughly 85 percent of any unexplained movement will have disappeared after four quarters. Return to text
5. In general, price changes measured over a few months tend to be noisy, even when measured on a core or trimmed-mean basis. For this reason, the FOMC usually focuses on the growth rate of PCE prices over the previous 12 months, which smooths through the volatility in the monthly price data. This approach also sidesteps distortions in the monthly data associated with residual seasonality; these distortions are likely to hold down month-to-month changes in prices over the balance of the year (see Peneva, 2014). That said, 12‑month rates of inflation will continue to be held down through early 2018 by the unusually weak monthly readings on price changes recorded in early 2017. Return to text
6. See Reifschneider and Tulip (2017) for details on the calculation of these confidence intervals. Return to text
7. This statement abstracts from any persistent effects such disturbances might have on real activity, which could have implications for monetary policy. Return to text
8. For example, Aaronson and others (2015) estimate that increases in the average age and educational attainment of U.S. workers will reduce the sustainable rate of unemployment almost 1/2 percentage point between 2014 and 2020. Barnichon and Mesters (2017) also present evidence that demographic changes have somewhat reduced the structural unemployment rate in the United States in recent years. Relatedly, Yoon, Kim, and Lee (2014) and Juselius and Takats (2015) estimate that ongoing demographic transitions are having modest disinflationary effects in the United States and other developed economies. Return to text
9. The statistical evidence also suggests that the sustainable rate of unemployment could be higher. As illustrated by the results reported in Reifschneider, Wascher, and Wilcox (2015) and Barnichon and Matthes (2017), standard errors for estimates of the sustainable rate of unemployment are typically at least 1/2 percentage point. Accordingly, if the sustainable rate is estimated to be about 4-1/2 percent, there is roughly a 15 percent probability that the actual value is less than 4 percent; symmetrically, there is a 15 percent probability that it is greater than 5 percent. Return to text
10. Several years ago, I discussed the interpretation of a wide range of labor market indicators at length (Yellen, 2014). Return to text
11. The employment-to-population ratio for all persons aged 16 and over has recovered much less than the prime-age ratio since 2007, in large part reflecting the ongoing retirement of the baby boomers and a rise in school attendance rates for young adults aged 20 to 24 (Aaronson and others, 2014). Schanzenbach and others (2017) estimate that the substantial overall employment-to-population gap that opened up in the wake of the financial crisis finally closed in July 2017. Return to text
12. The labor force participation rate for prime-age men has been declining for decades. Evidence suggests that a portion of the decline is attributable to a reduction in the demand for low-skilled workers resulting from advances in technology and globalization. For a general discussion of the decline in male labor force participation, see Aaronson and others (2014). For a discussion of the role played by technical factors in this decline, see Deming (forthcoming) and Acemoglu and Autor (2011); for a discussion of the role of globalization, see Autor, Dorn, and Hanson (2013) and Pierce and Schott (2016). In addition to these factors, Autor and Duggan (2003) and French and Song (2014) present evidence suggesting that increases in the number of people on disability rolls have also been important. Relatedly, an alarming deterioration in health outcomes among low-education workers, including a rise in deaths related to alcohol, drugs, and suicide, may be having an adverse effect on both male and female employment (Case and Deaton, 2017). Return to text
13. For a discussion of how secular forces may be influencing the trend share of part-time employment, see Valletta and van der List (2015). Return to text
14. In contrast to the other wage and compensation measures, the Wage Growth Tracker only measures wage changes for individuals who had a job in both the current month and a year ago. Return to text
15. For example, predictions from a simple empirical model track recent movements in the employment cost index reasonably well, because the model estimates that the increasing upward pressure on compensation growth from rising labor utilization is being offset by a declining contribution from productivity growth. (See the appendix for further details.) Relatedly, research also suggests that cyclical changes in the composition of the workforce associated with the absorption of new workers with relatively low skills and experience may be currently restraining growth in both aggregate wages and productivity. See Daly and Hobijn (2017) and Daly, Hobijn, and Pyle (2016), who also point to the retirement of baby boomers as a factor holding down wage growth. Return to text
16. See J.P. Morgan (2017) for more on this analysis. Return to text
17. As I discussed in a speech one year ago, I view expectations formation as one of the key areas requiring further research by economists (see Yellen, 2016). Return to text
18. In the Survey of Primary Dealers conducted by the Federal Reserve Bank of New York, the median of respondents' longer-term projections for PCE inflation have been essentially flat at 2 percent since the survey began in 2011. Similarly, in the Blue Chip Financial Indicators survey, which solicits the views of a large number of financial firms (as well as a few other institutions) about the extended outlook every June and December, the median of long-run expectations for GDP price inflation has stayed close to 2.1 percent over the past six years. Comparisons of results from these surveys to those reported in the Survey of Professional Forecasters (as well as surveys of households) are somewhat complicated by differences in the projection period used. For example, some surveys include the low rates of inflation expected over the next few years in the calculation of projected longer-run averages, while other surveys exclude them. Return to text
19. Expected inflation over the next 5 to 10 years as reported in the Michigan survey runs appreciably above PCE price inflation on average since the mid-1990s, perhaps because households are less informed about actual inflation developments than professional forecasters and financial firms. For this reason, it may be best to focus on changes over time in the Michigan measure, not on the level. Return to text
20. In addition to monitoring survey measures of expected inflation, Federal Reserve staff also use statistical techniques to try to directly estimate possible movements over time in the underlying long-run trend in inflation, using data for actual inflation and other series, including resource utilization. Many of these statistical estimates suggest that the underlying trend in PCE inflation is currently somewhat below 2 percent. Econometrically, however, it is extremely difficult if not impossible to disentangle estimates of the underlying trend in PCE inflation from estimates of the sustainable rate of unemployment. To be consistent with the data, the higher one's estimate of trend inflation or expected long-run inflation, the lower must be one's estimate of the sustainable unemployment rate, at least over the medium run. Return to text
21. For example, Andreasen and Christensen (2016) show that once TIPS liquidity premiums are taken into account, the model-implied one-year inflation expectation becomes more stable and shows a smaller decline since 2013. In addition, quotes on inflation derivatives suggest that most of the decline in inflation compensation over this period is associated with investor perceptions of reduced risks of above-target inflation outcomes rather than increased risks of below-target inflation outcomes. Return to text
22. Personal consumption expenditures include all medical services, including those paid by Medicare and Medicaid; prices for the latter may be viewed as "administered" because they are essentially set by the government. The formulas used to set Medicare prices were adjusted by the 2010 Affordable Care Act and additional legislation passed in 2015, resulting in smaller increases in prices for the same increase in costs than would have been the case in the prior decade. In addition, Medicaid prices have probably been restrained somewhat by budget pressures on state governments. Aside from these direct influences of government policy on healthcare prices, some research suggests that lower Medicare prices tend to lead to lower negotiated prices by private insurers as well (see Clemens, Gottlieb, and Shapiro, 2016). Return to text
23. In an early study, Borio and Filardo (2007) reported results suggesting that global economic slack adds considerable explanatory power to reduced-form inflation equations (such as the one discussed in the appendix), and that its role has been growing over time. However, Ihrig, Kamin, Lindner, and Marquez (2010) subsequently argued that the estimated link was not robust to alternative measures of global resource utilization. Federal Reserve Board staff have updated this analysis using data through early 2017 and confirmed that global slack does not appear to exert an appreciable direct effect on domestic inflation in the United States and most other advanced economies. Return to text
24. Using sector-level data, Elsby, Hobijn, and Sahin (2013) estimate the contributions of offshoring, the substitution of capital for low-skilled labor, and several other factors on the aggregate U.S. labor share of income, and find that only offshoring has been important. They also conclude that the decline in the labor share since the late 1980s has been overstated as a result of statistical measurement problems. In contrast to the influence of globalization on the U.S. labor share, Feenstra and Weinstein (2017) find that the influence of increased globalization on price markups in the United States has been modest. Return to text
25. For more on the inflation implications of innovation in the retail sector, see Curran and Jamrisko (2017) and Trainer (2016). Return to text
26. For a review of changes over time in the competitive structure of the overall economy, see Council of Economic Advisers (2016). For a discussion of the evidence for, and some of the implications of, changes in the dynamism of the economy, see Hathaway and Litan (2014) and Decker and others (2016). Return to text
27. The median of FOMC participants' projections of the longer-run unemployment rate has declined almost a full percentage point over the past five years; the revision in the long-run consensus forecast reported in the Blue Chip Survey between October 2012 and March 2017 was slightly larger. Return to text
28. It might be thought that the FOMC could mitigate this problem by raising the federal funds rate higher than might otherwise be called for while the economy continues to expand in order to increase the extent to which interest rates could be cut later should a recession occur. But this strategy would be counterproductive, because it would only serve to weaken economic activity and push down inflation before the recession. Return to text
29. Although the data used in the decomposition analysis have been revised and extended, the specification of the model and the estimation period are the same as that discussed in a speech I gave two years ago (Yellen, 2015). As a result, the estimated coefficients of the model are essentially unchanged. Extending the estimation period through 2017:Q2 has little effect on the estimated coefficients and the decomposition estimates. Return to text
30. This measure of core import prices is constructed by Board staff using published and unpublished data provided by the Bureau of Economic Analysis and the Bureau of Labor Statistics. Return to text
31. The information on participants' forecasts provided at the September 20, 2017, press conference is available on the Board's website at https://www.federalreserve.gov/monetarypolicy/files/fomcprojtabl20170920.pdf. Return to text
32. The level of core import prices, expressed relative to core consumer prices, displayed a modest downward trend from 1990 through 2001 but since then has displayed little persistent trend, particularly if one controls for shifts related to recent changes in the real exchange rate. If the post-2001 pattern persists in coming years, then $$ {RPIM}_t$$ would be expected to converge to zero within a few quarters and core PCE inflation to converge to 2 percent within two or three years, assuming that the unemployment rate remains near 4-1/2 percent (the median of the longer-run projections provided by FOMC participants) and there are no further shocks to the exchange rate and other factors. If, however, core import prices were expected to resume trending down relative to consumer prices, then the model as specified would imply that the unemployment rate consistent with inflation stabilizing at 2 percent in the longer run would be somewhat lower than 4-1/2 percent. Return to text
33. The ECI series used here is obtained from a ratio splice of the SIC- and NAICS-based indexes; the SIC-based index is used before 2001 and the NAICS-based index used thereafter. (All data used in the model were current as of September 1, 2017.) Return to text
34. The estimation procedure imposes the joint restriction that the sum of the coefficients on $$ \pi_{t-1}^e$$ and the lagged ECI growth terms are equal to 1, and that the coefficients on $$ \pi_{t-1}^e$$ and $$ {MA\_PROD}_t$$ are equal. This joint restriction receives a $$ p$$ value of 0.57. Return to text
35. The low-pass component is obtained from a band-pass filter. The filter width and cutoffs are set equal to the values used in Douglas Staiger, James Stock, and Mark Watson (2001), "Prices, Wages, and the U.S. NAIRU in the 1990s," in Alan Krueger and Robert Solow, eds., The Roaring Nineties: Can Full Employment Be Sustained? (New York: Russell Sage Foundation and Century Foundation Press), pp. 3‑60. Before the series' starting point in 1947:Q2, actual productivity growth is padded with an ARIMA(4,1,0) model; after its 2017:Q2 endpoint, the series is padded with the CBO's January 2017 forecast of average nonfarm business trend productivity growth from 2017 to 2027 (which is 1.67 percent in log differences) and with the 2027 value of the CBO forecast (1.77 percent) thereafter. Return to text