


Introduction
The Federal Reserve Board (Board) has recently taken several actions related to the supervisory stress test and stress capital buffer requirements.
Recent Stress Testing Proposals
In 2025, the Board proposed changes to reduce the year-over-year volatility of stress capital buffer requirements and increase the transparency and public accountability of the stress test.
In April 2025, the Board requested comment on a proposal to average the results of the supervisory stress test over two years to reduce the volatility of the stress capital buffer requirements.3 It also sought comment on modifying the annual effective date of the stress capital buffer requirement to give banks additional time to adjust to new capital requirements that result from the stress test.
In October 2025, the Board requested comment on additional proposals to increase the transparency and public accountability of the stress test.4 The proposals sought comment on the stress test models, proposed changes to the supervisory models that predict stress test losses, the framework that guides the design of the stress test scenarios, and an enhanced disclosure process for future stress test cycles.
The Board is currently reviewing public feedback on these proposals.
Methodology and Uses of the 2026 Stress Test
For the 2026 stress test, the supervisory models remained largely unchanged from the prior stress test because the models are out for public comment.5 The supervisory models for the 2026 stress test include limited adjustments that were applied in the 2025 stress test related to the treatment of non-recurring expenses, portfolio layer method hedges, divestitures, and synthetic securitizations.6
In February 2026, the Board voted to maintain the current stress capital buffer requirements until 2027, when new requirements can be calculated based on stress test models that take public feedback into consideration.7 As a result of the Board's decision, there is no expectation that the firms delay until a particular time the public disclosure of their planned capital actions through the third quarter of 2027.8
Summary of Results
The 2026 stress test results show that the 32 large banks subject to the test this year have sufficient capital to absorb nearly $708 billion in losses and continue lending to households and businesses under hypothetical stressful conditions.
Under the severely adverse scenario, the aggregate common equity tier 1 (CET1) capital ratio of the 32 banks subject to the stress test this year falls from an actual 12.8 percent in the fourth quarter of 2025 to its projected minimum of 11.2 percent, before rising to 12.7 percent at the end of the projection horizon (see table 1). The aggregate and individual bank post-stress CET1 capital ratios remain above the required minimum regulatory levels throughout the projection horizon.
Table 1. Aggregate capital ratios, actual, projected 2026:Q1–2028:Q1, and regulatory minimums
Percent
| Regulatory ratio | Actual 2025:Q4 | Stressed minimum capital ratios, severely adverse | Projected 2028:Q1 | Minimum regulatory capital ratios |
|---|---|---|---|---|
| Common equity tier 1 capital ratio | 12.8 | 11.2 | 12.7 | 4.5 |
| Tier 1 capital ratio | 14.2 | 12.6 | 14.1 | 6.0 |
| Total capital ratio | 16.2 | 14.8 | 16.2 | 8.0 |
| Tier 1 leverage ratio | 7.6 | 6.7 | 7.5 | 4.0 |
| Supplementary leverage ratio | 6.3 | 5.5 | 6.3 | 3.0 |
Note: The capital ratios are calculated using the capital action assumptions provided within the supervisory stress testing rules. See 12 CFR §§ 238.132(d); 252.44(c). These projections represent hypothetical estimates that involve an economic outcome that is more adverse than expected. The minimum capital ratios are for the period 2026:Q1 to 2028:Q1. Supplementary leverage ratio projections only include estimates for banks subject to Category I, II, or III standards.
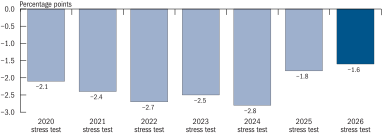
As shown in figure 1, the 1.6 percentage point aggregate decline this year is smaller than the aggregate decline in recent years.
Figure 1. Aggregate maximum decline in stressed common equity tier 1 capital ratio, severely adverse scenario
Accessible Version | Return to text
Note: Each bar represents the aggregate maximum common equity tier 1 (CET1) capital ratio decline of the banks in each exercise.
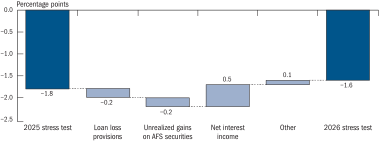
As highlighted in figure 2, several factors drive this year's results in different ways:
- Projected capital decreased due to greater loan losses as a result of an increase in loan balances and the severity of certain scenario variables: In 2025, loan balances grew by around 10 percent, concentrated in credit cards and wholesale loans. Combined with more severe paths for certain scenario variables in this year's stress test, including more severe changes in corporate bond spreads and commercial real estate prices, this led to greater loan losses year-over-year. The scenario changes are due to changes in the U.S. economy over 2025 and the countercyclical design of the Board's annual hypothetical scenario.
- Projected capital decreased due to smaller projected unrealized gains on available-for-sale (AFS) securities as a result of smaller projected declines in interest rates in the hypothetical scenario: The 2026 severely adverse scenario had smaller projected declines in interest rates than last year's hypothetical scenario, resulting in elevated interest rate levels throughout the projection horizon. Higher interest rate levels led to smaller unrealized gains on AFS portfolios, which are included in the capital of certain large banks through accumulated other comprehensive income.9
- Projected capital increased due to higher projected net interest income as a result of recent bank financial performance and the path of interest rates in the scenario: Bank revenue improved over the course of 2025, largely due to loan growth. Through the lens of the Federal Reserve's current models, stronger recent net interest income leads to higher projections of net interest income under stress. Higher projected levels of interest rates in the hypothetical scenario also led to more projected net interest income when compared to the prior stress tests (see table 2).
Figure 2. Decomposition of year-over-year changes in aggregate maximum decline in stressed common equity tier 1 capital ratio, severely adverse scenario
Accessible Version | Return to text
Note: The 2025 stress test bar shows the aggregate common equity tier 1 (CET1) capital ratio decline resulting from the 2025 stress test. The Loan loss provisions, Unrealized gains on AFS securities, Net interest income, and Other bars show the impact that changes in each of these elements had on the difference between 2025 and 2026 stress test results. The 2026 stress test bar shows the aggregate CET1 capital ratio decline resulting from the 2026 stress test. The sample includes the 22 banks subject to the supervisory stress test in 2025 compared with the 32 banks in the 2026 supervisory stress test. The figure is based on numbers at the minimum aggregate capital ratio quarter (fourth quarter) of the 2026 stress test. Values may not sum precisely due to rounding.
Table 2. Key variables in 2025 and 2026 supervisory severely adverse scenarios
| 2025 severely adverse | 2026 severely adverse | |
|---|---|---|
| Unemployment rate | ↑ 5.9 p.p. to 10% | ↑ 5.5 p.p. to 10% |
| Real GDP (peak-to-trough change) | ↓ 7.8% | ↓ 4.6% |
| House prices | ↓ 33% | ↓ 30% |
| CRE prices | ↓ 30% | ↓ 39% |
| 3-month Treasury | ↓ 4.3 p.p. to 0.1% | ↓ 3.6 p.p. to 0.1% |
| 10-year Treasury | ↓ 3.3 p.p. to 1.0% | ↓ 1.8 p.p. to 2.3% |
| BBB-bond rate spread | ↑ 3.9 p.p. to 5.0% | ↑ 4.7 p.p. to 5.7% |
| Equity prices | ↓ 50% | ↓ 58% |
Note: p.p. is percentage point.
Further details on this year's results are provided in the "Results for Banks under the Severely Adverse Scenario" section of this report, which includes results presented both in the aggregate and for individual banks.
This report includes
- background information regarding the 2026 stress test,
- stress test results,
- details on the projection path of the CET1 capital ratio, and
- bank-specific stress test results (appendix A).
References
3. See Board of Governors of the Federal Reserve System, "Federal Reserve Board Requests Comment on a Proposal to Reduce the Volatility of the Capital Requirements Stemming from the Board's Annual Stress Test Results," press release, April 17, 2025, https://www.federalreserve.gov/newsevents/pressreleases/bcreg20250417a.htm. Return to text
4. See Enhanced Transparency and Public Accountability of the Supervisory Stress Test Models and Scenarios, 90 Fed. Reg. 51,856 (proposed November 18, 2025), https://www.federalregister.gov/documents/2025/11/18/2025-20211/enhanced-transparency-and-public-accountability-of-the-supervisory-stress-test-models-and-scenarios. Return to text
5. See Board of Governors of the Federal Reserve System, 2026 Supervisory Stress Test Methodology (Board of Governors, February 2026), https://www.federalreserve.gov/publications/files/2026-february-supervisory-stress-test-methodology.pdf. Return to text
6. More information on the model adjustments applied in the 2025 stress test can be found at Board of Governors of the Federal Reserve System, 2025 Federal Reserve Stress Test Results (Board of Governors, June 2025), https://www.federalreserve.gov/publications/files/2025-dfast-results-20250627.pdf. Return to text
7. See "Federal Reserve Board Finalizes Hypothetical Scenarios for Its Annual Stress Test and Votes to Maintain the Current Stress Test-related Capital Requirements until Public Feedback Can Be Considered," press release, February 4, 2026, https://www.federalreserve.gov/newsevents/pressreleases/bcreg20260204a.htm. Return to text
8. The Board typically requests that banks wait two business days to publicly disclose any information about their planned capital actions and preliminary stress capital buffer requirements to give all banks sufficient time to examine and understand their individual results. With regard to a bank's 2026 capital plan, a bank may publicly disclose those planned capital actions at any time, to the extent consistent with other applicable law. See "Comprehensive Capital and Analysis Review and Dodd-Frank Act Stress Tests: Questions and Answers," Q (GEN0511), https://www.federalreserve.gov/publications/ccar-qas/comprehensive-capital-analysis-and-review-questions-and-answers.htm. Return to text
9. Per U.S. Generally Accepted Accounting Principles (GAAP), available-for-sale securities are typically held at fair value on a firm's balance sheet. Unrealized gains and losses are calculated as the difference between the amortized cost and the fair value of an available-for-sale security. Return to text