


Results for Banks under the Severely Adverse Scenario
This section details the Federal Reserve's results for the 2026 supervisory stress test under the severely adverse scenario. The results are presented both in the aggregate and for individual banks.
The aggregate results incorporate the combined sensitivities of capital, losses, revenues, and expenses across all banks to the stressed economic and financial market conditions included in the severely adverse scenario. The range of results across individual banks indicates differences in business focus, asset composition, revenue and expense sources, and portfolio risk characteristics. Box 1 discusses the progression of the aggregate CET1 capital ratio throughout the nine quarters of the stress test. The comprehensive 2026 stress test results for individual banks are in appendix A.
Capital
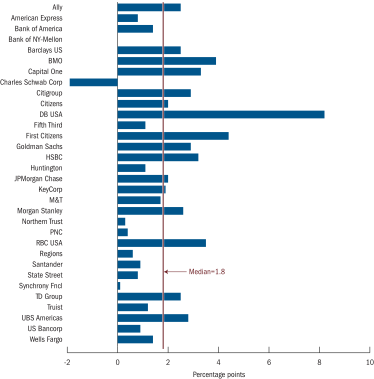
Under the severely adverse scenario, the aggregate CET1 capital ratio is projected to decline from an actual 12.8 percent at the start of the projection horizon to a minimum of 11.2 percent before rising to 12.7 percent at the end of nine quarters (see table 4). Tables 5 and 6 present post-stress minimum capital ratios for each bank and the change from the start of the projection horizon, which varies considerably across banks (see figure 5). This variation is due to differences in banks' business lines, portfolio composition, and securities and loan risk characteristics, which drive changes in the magnitude and timing of loss, revenue, and expense projections.
Table 4. Capital ratios and risk-weighted assets, actual 2025:Q4 and projected 2026:Q1–2028:Q1
Percent except as noted
| Regulatory ratio | Actual 2025:Q4 |
Projected 2028:Q1 |
Projected minimum |
|---|---|---|---|
| Common equity tier 1 capital ratio | 12.8 | 12.7 | 11.2 |
| Tier 1 capital ratio | 14.2 | 14.1 | 12.6 |
| Total capital ratio | 16.2 | 16.2 | 14.8 |
| Tier 1 leverage ratio | 7.6 | 7.5 | 6.7 |
| Supplementary leverage ratio | 6.3 | 6.3 | 5.5 |
| Risk-weighted assets 1 (billions of dollars) | 12,583.7 | 12,541.2 |
Note: The capital ratios are calculated using the capital action assumptions provided within the supervisory stress testing rules. See 12 CFR §§ 238.132(d); 252.44(c). These projections represent hypothetical estimates that involve an economic outcome that is more adverse than expected. The minimum capital ratios are for the period 2026:Q1 to 2028:Q1. Supplementary leverage ratio projections only include estimates for banks subject to Category I, II, or III standards.
1. For each quarter, risk-weighted assets are calculated under the Board's standardized approach to risk-based capital in 12 CFR pt. 217, subpt. D. Return to table
Table 5. Projected minimum common equity tier 1 capital ratio under the severely adverse scenario, 2026:Q1–2028:Q132 banks
Percent
| Bank | Stressed ratios with supervisory stress testing capital action assumptions |
|---|---|
| Ally | 7.8 |
| American Express | 9.7 |
| Bank of America | 9.9 |
| Bank of NY-Mellon | 11.8 |
| Barclays US | 12.3 |
| BMO | 10.1 |
| Capital One | 11.0 |
| Charles Schwab Corp | 32.2 |
| Citigroup | 10.3 |
| Citizens | 8.6 |
| DB USA | 14.4 |
| Fifth Third | 9.7 |
| First Citizens | 6.7 |
| Goldman Sachs | 11.4 |
| HSBC | 8.1 |
| Huntington | 9.3 |
| JPMorgan Chase | 12.6 |
| KeyCorp | 9.9 |
| M&T | 9.2 |
| Morgan Stanley | 12.5 |
| Northern Trust | 12.3 |
| PNC | 10.3 |
| RBC USA | 13.7 |
| Regions | 10.3 |
| Santander | 11.7 |
| State Street | 10.8 |
| Synchrony Fncl | 12.5 |
| TD Group | 14.0 |
| Truist | 9.7 |
| UBS Americas | 15.3 |
| US Bancorp | 9.8 |
| Wells Fargo | 9.2 |
Note: The capital ratios are calculated using the capital action assumptions provided within the supervisory stress testing rules. See 12 CFR §§ 238.132(d); 252.44(c). These projections represent hypothetical estimates that involve an economic outcome that is more adverse than expected. The minimum capital ratio presented is for the period 2026:Q1 to 2028:Q1.
Source: Federal Reserve estimates in the severely adverse scenario.
Table 6. Capital ratios, actual 2025:Q4 and projected 2026:Q1–2028:Q1 under the severely adverse scenario: 32 banks
Percent
| Bank | Common equity tier 1 capital ratio |
Tier 1 capital ratio | Total capital ratio | Tier 1 leverage ratio | Supplementary leverage ratio1 |
||||||||||
|---|---|---|---|---|---|---|---|---|---|---|---|---|---|---|---|
| Actual 2025:Q4 |
Ending | Mini- mum |
Actual 2025:Q4 |
Ending | Mini- mum |
Actual 2025:Q4 |
Ending | Mini- mum |
Actual 2025:Q4 |
Ending | Mini- mum |
Actual 2025:Q4 |
Ending | Mini- mum |
|
| Ally | 10.2 | 7.8 | 7.8 | 11.7 | 9.2 | 9.2 | 13.6 | 11.1 | 11.1 | 9.2 | 7.3 | 7.2 | |||
| American Express | 10.5 | 12.8 | 9.7 | 11.1 | 13.4 | 10.4 | 13.1 | 15.4 | 12.3 | 9.8 | 11.6 | 9.0 | 8.3 | 9.9 | 7.6 |
| Bank of America | 11.4 | 10.8 | 9.9 | 12.8 | 12.3 | 11.4 | 14.7 | 14.4 | 13.8 | 6.8 | 6.5 | 6.0 | 5.7 | 5.4 | 5.1 |
| Bank of NY-Mellon | 11.9 | 17.1 | 11.8 | 14.6 | 19.9 | 14.5 | 15.4 | 20.8 | 15.4 | 6.0 | 8.1 | 6.0 | 6.7 | 9.1 | 6.7 |
| Barclays US | 14.8 | 16.6 | 12.3 | 16.4 | 18.2 | 13.9 | 18.7 | 20.7 | 16.5 | 7.5 | 8.4 | 6.3 | 6.3 | 7.1 | 5.3 |
| BMO | 14.0 | 10.1 | 10.1 | 14.7 | 10.8 | 10.8 | 16.3 | 12.5 | 12.5 | 10.5 | 7.5 | 7.5 | 9.1 | 6.5 | 6.5 |
| Capital One | 14.3 | 11.2 | 11.0 | 15.3 | 12.3 | 12.0 | 17.2 | 14.1 | 13.9 | 12.5 | 9.9 | 9.6 | 10.6 | 8.4 | 8.2 |
| Charles Schwab Corp | 30.4 | 40.4 | 32.2 | 36.1 | 46.1 | 37.9 | 36.1 | 46.5 | 38.1 | 9.3 | 11.8 | 9.7 | 9.2 | 11.8 | 9.7 |
| Citigroup | 13.2 | 13.2 | 10.3 | 15.1 | 15.1 | 12.2 | 18.2 | 18.3 | 15.4 | 6.7 | 6.7 | 5.3 | 5.5 | 5.5 | 4.4 |
| Citizens | 10.6 | 8.6 | 8.6 | 11.9 | 9.9 | 9.9 | 13.8 | 11.8 | 11.8 | 9.5 | 7.8 | 7.8 | |||
| DB USA | 22.6 | 14.7 | 14.4 | 28.4 | 21.1 | 20.8 | 28.5 | 21.5 | 21.2 | 9.2 | 6.3 | 6.2 | 8.5 | 5.8 | 5.7 |
| Fifth Third | 10.8 | 9.7 | 9.7 | 11.9 | 10.8 | 10.7 | 13.8 | 12.7 | 12.7 | 9.4 | 8.5 | 8.5 | |||
| First Citizens | 11.2 | 6.7 | 6.7 | 11.9 | 7.5 | 7.5 | 13.7 | 9.6 | 9.6 | 9.3 | 5.8 | 5.8 | |||
| Goldman Sachs | 14.3 | 16.5 | 11.4 | 16.4 | 18.5 | 13.4 | 18.0 | 20.5 | 15.6 | 6.6 | 7.5 | 5.4 | 5.2 | 5.9 | 4.2 |
| HSBC | 11.3 | 8.1 | 8.1 | 12.8 | 9.6 | 9.6 | 14.6 | 11.8 | 11.8 | 5.9 | 4.3 | 4.3 | |||
| Huntington | 10.4 | 9.4 | 9.3 | 12.0 | 11.1 | 11.0 | 14.2 | 13.2 | 13.1 | 9.3 | 8.5 | 8.4 | |||
| JPMorgan Chase | 14.6 | 15.0 | 12.6 | 15.5 | 16.0 | 13.6 | 17.4 | 17.8 | 15.5 | 6.9 | 7.1 | 6.0 | 5.8 | 6.0 | 5.1 |
| KeyCorp | 11.8 | 9.9 | 9.9 | 13.5 | 11.6 | 11.5 | 15.7 | 13.9 | 13.8 | 10.5 | 9.0 | 9.0 | |||
| M&T | 10.8 | 9.3 | 9.2 | 12.6 | 11.0 | 10.9 | 14.4 | 12.9 | 12.8 | 10.0 | 8.8 | 8.6 | |||
| Morgan Stanley | 15.0 | 17.6 | 12.5 | 16.8 | 19.3 | 14.2 | 18.7 | 21.3 | 16.1 | 6.7 | 7.7 | 5.7 | 5.4 | 6.2 | 4.6 |
| Northern Trust | 12.6 | 13.4 | 12.3 | 13.5 | 14.3 | 13.2 | 16.1 | 17.5 | 16.1 | 7.8 | 8.3 | 7.6 | 8.7 | 9.2 | 8.5 |
| PNC | 10.6 | 10.7 | 10.3 | 11.9 | 12.0 | 11.6 | 13.5 | 13.4 | 13.2 | 9.4 | 9.4 | 9.1 | 7.6 | 7.6 | 7.3 |
| RBC USA | 17.2 | 13.7 | 13.7 | 17.2 | 13.7 | 13.7 | 17.9 | 15.0 | 15.0 | 11.9 | 9.2 | 9.2 | 10.0 | 7.7 | 7.7 |
| Regions | 10.9 | 10.7 | 10.3 | 12.0 | 11.8 | 11.4 | 13.9 | 13.7 | 13.3 | 9.7 | 9.5 | 9.1 | |||
| Santander | 12.6 | 11.7 | 11.7 | 14.4 | 13.5 | 13.5 | 16.5 | 15.7 | 15.7 | 9.2 | 8.8 | 8.7 | |||
| State Street | 11.6 | 14.7 | 10.8 | 14.4 | 17.5 | 13.6 | 16.1 | 19.4 | 15.3 | 5.5 | 6.7 | 5.2 | 6.5 | 7.8 | 6.1 |
| Synchrony Fncl | 12.6 | 18.4 | 12.5 | 13.8 | 19.6 | 13.6 | 15.8 | 21.6 | 15.7 | 12.5 | 18.4 | 12.5 | |||
| TD Group | 16.5 | 14.0 | 14.0 | 16.5 | 14.0 | 14.0 | 17.8 | 15.2 | 15.2 | 8.5 | 7.1 | 7.1 | 7.5 | 6.3 | 6.3 |
| Truist | 10.8 | 9.7 | 9.7 | 11.9 | 10.9 | 10.8 | 13.8 | 12.8 | 12.7 | 10.0 | 9.1 | 9.0 | 8.3 | 7.6 | 7.5 |
| UBS Americas | 18.1 | 17.4 | 15.3 | 21.8 | 21.6 | 19.5 | 22.1 | 22.8 | 20.2 | 8.3 | 7.5 | 6.7 | 7.1 | 6.3 | 5.7 |
| US Bancorp | 10.8 | 10.3 | 9.8 | 12.3 | 11.8 | 11.3 | 14.2 | 13.7 | 13.3 | 8.7 | 8.4 | 8.0 | 7.1 | 6.8 | 6.5 |
| Wells Fargo | 10.6 | 9.7 | 9.2 | 11.9 | 11.0 | 10.5 | 14.3 | 13.5 | 13.0 | 7.5 | 6.9 | 6.5 | 6.2 | 5.8 | 5.4 |
| 32 banks | 12.8 | 12.7 | 11.2 | 14.2 | 14.1 | 12.6 | 16.2 | 16.2 | 14.8 | 7.6 | 7.5 | 6.7 | 6.3 | 6.3 | 5.5 |
Note: The capital ratios are calculated using the capital action assumptions provided within the supervisory stress testing rules. See 12 CFR §§ 238.132(d); 252.44(c). These projections represent hypothetical estimates that involve an economic outcome that is more adverse than expected. The minimum capital ratios are for the period 2026:Q1 to 2028:Q1.
1. Supplementary leverage ratio projections only include estimates for banks subject to Category I, II, or III standards. Return to table
Source: Federal Reserve estimates in the severely adverse scenario.
Figure 5. Decline from start to minimum common equity tier 1 capital ratio in the severely adverse scenario
Accessible Version | Return to text
Note: The top bars show the decline from the start of the 2026 stress test in 2025:Q4 to the minimum CET1 capital ratio in the 2026 stress test. Estimates of minimum CET1 capital as a percent of risk-weighted assets are for the nine-quarter period from 2026:Q1 to 2028:Q1. Negative values indicate CET1 ratio increases.
Pre-tax Net Income
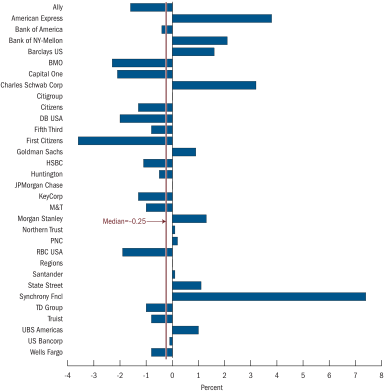
Projections of pre-tax net income are the largest component of post-stress changes in capital.14 Over the nine quarters of the projection horizon, aggregate cumulative pre-tax net income is projected to be positive 1.2 billion, which equals approximately 0.01 percent of average total assets (see table 7). As a percent of average assets, projected cumulative pre-tax net income is negative for 17 of the 32 banks and varies considerably across banks, from negative 3.6 percent to positive 7.4 percent (see figure 6). This range illustrates differences in the sensitivity of the various components of pre-tax net income to the economic and financial market conditions in the severely adverse scenario. These components include cumulative projections of losses and PPNR, which are discussed in further detail below.
Table 7. Projected aggregate losses, revenue, and net income before taxes through 2028:Q1 under the severely adverse scenario
| Item | Billions of dollars | Percent of average assets1 |
|---|---|---|
| Pre-provision net revenue | 719.0 | 3.0 |
| equals | ||
| Net interest income | 1,270.4 | 5.3 |
| Noninterest income | 994.8 | 4.2 |
| less | ||
| Noninterest expense2 | 1,546.1 | 6.5 |
| less | ||
| Provisions for loan and lease losses | 634.7 | |
| Credit losses on investment securities (AFS/HTM) 3 | 6.5 | |
| Trading and counterparty losses 4 | 37.1 | |
| Other losses/gains 5 | 39.5 | |
| equals | ||
| Net income before taxes | 1.2 | 0.0 |
| Memo items | ||
| Other comprehensive income 6 | 42.6 | |
| Other effects on capital | Actual 2025:Q4 | 2028:Q1 |
| AOCI included in capital (billions of dollars) | -76.6 | -34.0 |
1. Average assets is the nine-quarter average of total assets. Return to table
2. Noninterest expense includes losses from operational-risk events and other real estate owned (OREO) costs. Return to table
3. The Federal Reserve incorporates its projection of expected credit losses on securities in the allowance for credit losses, in accordance with ASU 2016-13. Return to table
4. Trading and counterparty losses include mark-to-market and credit valuation adjustment (CVA) losses and losses arising from the counterparty default scenario component applied to derivatives, securities lending, and repurchase agreement activities. Return to table
5. Other losses/gains include projected change in fair value of loans held for sale or held for investment and measured under the fair-value option, losses/gains on hedges on loans measured at fair value or amortized cost, and losses on private equity investments. Return to table
6. Other comprehensive income is only calculated for banks subject to Category I or II standards or banks that opt in to including accumulated other comprehensive income (AOCI) in their calculation of capital. Return to table
Figure 6. Pre-tax net income rates in the severely adverse scenario
Accessible Version | Return to text
Note: Estimates are for the nine-quarter period from 2026:Q1 to 2028:Q1 as a percent of average assets.
Table 8. Projected losses, revenue, and net income before taxes through 2028:Q1 under the severely adverse scenario: 32 banks
Billions of dollars
| Bank | Revenue | Minus sum of provisions and losses | Equals | Memo items |
Other effects on capital | |||
|---|---|---|---|---|---|---|---|---|
| Pre-provision net revenue1 |
Provisions for loan and lease losses | Credit losses on investment securities (AFS/HTM) 2 | Trading and counterparty losses 3 | Other losses/ gains 4 |
Net income before taxes |
Other compre- hensive income5 |
AOCI included in capital (2028:Q1) |
|
| Ally | 7.7 | 10.1 | 0.4 | 0.0 | 0.2 | -3.1 | 0.0 | 0.0 |
| American Express | 41.9 | 30.4 | 0.0 | 0.0 | 0.0 | 11.5 | 0.0 | -3.3 |
| Bank of America | 66.2 | 69.5 | 0.7 | 6.6 | 1.9 | -12.5 | 4.7 | -3.8 |
| Bank of NY-Mellon | 12.6 | 1.9 | 0.2 | 0.6 | 0.0 | 10.0 | 2.0 | -1.0 |
| Barclays US | 8.6 | 4.6 | 0.0 | 0.8 | 0.1 | 3.2 | 0.0 | 0.0 |
| BMO | 5.0 | 11.6 | 0.0 | 0.0 | 0.0 | -6.7 | 0.0 | 0.0 |
| Capital One | 64.8 | 78.3 | 0.3 | 0.0 | 0.1 | -13.9 | 0.0 | 0.1 |
| Charles Schwab Corp | 17.4 | 1.7 | -0.2 | 0.0 | 0.0 | 15.9 | 0.0 | 0.0 |
| Citigroup | 62.3 | 51.0 | 0.6 | 5.4 | 4.1 | 1.3 | 7.0 | -34.9 |
| Citizens | 6.0 | 8.9 | 0.0 | 0.0 | 0.0 | -2.9 | 0.0 | 0.0 |
| DB USA | -0.5 | 0.8 | 0.0 | 1.0 | 0.2 | -2.4 | 0.0 | -0.2 |
| Fifth Third | 8.2 | 9.8 | 0.0 | 0.0 | 0.1 | -1.6 | 0.0 | 0.0 |
| First Citizens | 6.5 | 14.5 | 0.1 | 0.0 | 0.1 | -8.2 | 0.0 | 0.0 |
| Goldman Sachs | 52.9 | 23.4 | 0.0 | 4.7 | 7.8 | 17.1 | 3.9 | 1.6 |
| HSBC | 1.8 | 4.1 | 0.1 | 0.0 | 0.2 | -2.6 | 0.0 | 0.0 |
| Huntington | 7.8 | 8.9 | 0.0 | 0.0 | 0.1 | -1.2 | 0.0 | 0.0 |
| JPMorgan Chase | 118.6 | 95.0 | 1.3 | 8.9 | 13.6 | -0.3 | 13.7 | 10.8 |
| KeyCorp | 5.9 | 8.2 | 0.0 | 0.0 | 0.1 | -2.5 | 0.0 | 0.0 |
| M&T | 7.8 | 9.8 | 0.0 | 0.0 | 0.1 | -2.2 | 0.0 | 0.0 |
| Morgan Stanley | 41.9 | 12.9 | 0.1 | 4.4 | 6.8 | 17.8 | 2.0 | -4.3 |
| Northern Trust | 3.6 | 3.3 | 0.2 | 0.0 | 0.0 | 0.1 | 0.7 | 0.1 |
| PNC | 19.7 | 18.0 | 0.1 | 0.0 | 0.2 | 1.4 | 0.0 | 0.0 |
| RBC USA | 4.4 | 7.4 | 0.7 | 0.0 | 0.0 | -3.7 | 0.0 | 0.0 |
| Regions | 7.0 | 6.9 | 0.1 | 0.0 | 0.0 | 0.0 | 0.0 | 0.0 |
| Santander | 7.3 | 7.2 | 0.0 | 0.0 | 0.0 | 0.1 | 0.0 | 0.0 |
| State Street | 7.4 | 2.1 | 0.1 | 1.1 | 0.0 | 4.0 | 0.7 | -0.3 |
| Synchrony Fncl | 25.5 | 16.7 | 0.0 | 0.0 | 0.0 | 8.8 | 0.0 | -0.1 |
| TD Group | 5.8 | 10.6 | 0.2 | 0.0 | 0.3 | -5.2 | 0.0 | 0.0 |
| Truist | 17.9 | 22.0 | 0.1 | 0.0 | 0.1 | -4.3 | 0.0 | 0.0 |
| UBS Americas | 5.1 | 2.9 | 0.0 | 0.0 | 0.1 | 2.2 | 0.0 | -0.1 |
| US Bancorp | 23.8 | 24.2 | 0.1 | 0.0 | -0.1 | -0.5 | 0.0 | 0.0 |
| Wells Fargo | 48.2 | 58.0 | 1.3 | 3.7 | 3.5 | -18.2 | 7.9 | 1.4 |
| 32 banks | 719.0 | 634.7 | 6.5 | 37.1 | 39.5 | 1.2 | 42.6 | -34.0 |
Note: These projections represent hypothetical estimates that involve an economic outcome that is more adverse than expected. Values may not sum precisely due to rounding.
1. Pre-provision net revenue includes losses from operational-risk events and other real estate owned (OREO) costs. Return to table
2. The Federal Reserve incorporates its projection of expected credit losses on securities in the allowance for credit losses, in accordance with ASU 2016-13. Return to table
3. Trading and counterparty losses include mark-to-market and credit valuation adjustment (CVA) losses and losses arising from the counterparty default scenario component applied to derivatives, securities lending, and repurchase agreement activities. Return to table
4. Other losses/gains include projected change in fair value of loans held for sale or held for investment and measured under the fair-value option, losses/gains on hedges on loans measured at fair value or amortized cost, and losses on private equity investments. Return to table
5. Other comprehensive income is only calculated for banks subject to Category I or II standards or banks that opt in to including accumulated other comprehensive income (AOCI) in their calculation of capital. Return to table
Source: Federal Reserve estimates in the severely adverse scenario.
Losses
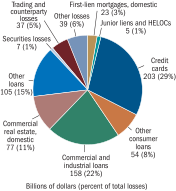
Over the projection horizon, aggregate losses on loans and other positions are projected to be $708 billion. These losses comprise
- $625 billion in loan losses, accounting for 89 percent of total losses;
- $39 billion in additional losses from items such as loans booked under the fair-value option, accounting for 6 percent of total losses;
- $37 billion in trading and counterparty losses at the 10 banks with substantial trading, processing, or custodial operations, accounting for 5 percent of total losses; and15
- $7 billion in securities losses, accounting for 1 percent of total losses (see figure 7).16
Figure 7. Projected losses in the severely adverse scenario
Accessible Version | Return to text
Note: Percent of total losses may not sum to 100 because of rounding. Total losses in billions may not sum to the reported total losses because of rounding.
For loans measured at amortized cost, projected aggregate losses are $625 billion, with the loan loss rate at 6.9 percent (see table 9).17 These loan losses flow into pre-tax net income through the projection of provisions for loan and lease losses, which is $635 billion in aggregate and takes into account banks' established allowances for credit losses at the start of the projection horizon (see table 7).18
Table 9. Projected aggregate loan losses, by type of loan, under the severely adverse scenario, 2026:Q1–2028:Q1
| Loan type | Billions of dollars | Portfolio loss rates (percent) 1 |
|---|---|---|
| Loan losses | 624.9 | 6.9 |
| First-lien mortgages, domestic | 22.5 | 1.5 |
| Junior liens and HELOCs,2 domestic | 5.5 | 3.2 |
| Commercial and industrial 3 | 158.2 | 9.0 |
| Commercial real estate, domestic | 76.5 | 8.8 |
| Credit cards | 203.0 | 17.1 |
| Other consumer4 | 54.1 | 7.3 |
| Other loans5 | 105.0 | 3.8 |
1. Average loan balances used to calculate portfolio loss rates exclude loans held for sale, loans held for investment under the fair-value option, and Paycheck Protection Program loans and are calculated over nine quarters. Return to table
2. HELOCs (home equity lines of credit). Return to table
3. Commercial and industrial loans include small- and medium-enterprise loans and corporate cards. Return to table
4. Other consumer loans include student loans and automobile loans. Return to table
5. Other loans include international real estate loans. Return to table
Projected consumer loan losses represent a smaller share (41 percent) of total losses than commercial loan losses (48 percent). The loan portfolio that constitutes the largest amount of losses is credit cards, representing 29 percent of total losses.
Total loan loss rates vary significantly across banks, ranging between 0.7 percent and 20.7 percent (see table 10). This range results from differences in loan portfolio composition, which materially affects losses because projected loss rates vary significantly for different types of loans. For example, aggregate loan loss rates range from 1.5 percent on domestic first-lien mortgages to 17.1 percent on credit cards because of the sensitivity and historical performance of these loans. Some loan portfolios are sensitive to home prices or unemployment rates and may experience high stressed loss rates due to the considerable stress on these factors in the severely adverse scenario.19
Table 10. Projected loan losses by type of loan for 2026:Q1–2028:Q1 under the severely adverse scenario: 32 banks
Percent of average loan balances1
| Bank | Loan losses |
First-lien mortgages, domestic |
Junior liens and HELOCs,2 domestic |
Commercial and industrial 3 |
Commercial real estate, domestic |
Credit cards | Other consumer 4 |
Other loans 5 |
|---|---|---|---|---|---|---|---|---|
| Ally | 7.3 | 0.9 | 0.0 | 8.6 | 9.4 | 0.0 | 7.0 | 18.2 |
| American Express | 11.8 | 0.0 | 0.0 | 15.7 | 0.0 | 9.5 | 16.8 | 2.7 |
| Bank of America | 5.2 | 1.3 | 2.4 | 6.5 | 9.3 | 16.2 | 2.0 | 3.4 |
| Bank of NY-Mellon | 2.0 | 1.5 | 5.7 | 4.4 | 8.4 | 0.0 | 0.6 | 1.5 |
| Barclays US | 14.3 | 0.0 | 0.0 | 24.3 | 3.6 | 16.1 | 16.2 | 0.9 |
| BMO | 7.6 | 2.3 | 4.2 | 8.9 | 9.4 | 16.5 | 10.1 | 7.3 |
| Capital One | 17.1 | 1.8 | 5.3 | 14.9 | 13.3 | 21.8 | 11.4 | 6.5 |
| Charles Schwab Corp | 0.7 | 1.2 | 4.1 | 0.0 | 0.0 | 0.0 | 0.0 | 0.6 |
| Citigroup | 7.2 | 2.0 | 3.1 | 5.5 | 10.9 | 16.3 | 21.5 | 3.2 |
| Citizens | 6.0 | 1.8 | 4.5 | 6.7 | 9.1 | 17.6 | 9.8 | 6.0 |
| DB USA | 4.2 | 2.0 | 6.9 | 3.4 | 8.1 | 0.0 | 2.0 | 2.6 |
| Fifth Third | 7.4 | 2.0 | 3.8 | 9.0 | 11.3 | 18.3 | 7.3 | 5.0 |
| First Citizens | 8.6 | 1.8 | 3.1 | 11.2 | 12.5 | 17.4 | 6.8 | 6.7 |
| Goldman Sachs | 7.0 | 1.9 | 4.1 | 17.2 | 12.8 | 22.7 | 17.4 | 4.1 |
| HSBC | 6.9 | 2.5 | 5.3 | 10.3 | 17.9 | 17.4 | 14.0 | 6.8 |
| Huntington | 5.9 | 2.3 | 3.8 | 6.5 | 10.0 | 17.4 | 6.3 | 4.6 |
| JPMorgan Chase | 6.7 | 1.2 | 1.6 | 13.2 | 3.8 | 15.9 | 2.9 | 4.5 |
| KeyCorp | 7.3 | 1.6 | 3.7 | 9.1 | 11.0 | 17.4 | 11.6 | 6.3 |
| M&T | 6.5 | 1.8 | 4.0 | 7.9 | 6.8 | 17.4 | 9.6 | 6.4 |
| Morgan Stanley | 3.3 | 1.6 | 4.8 | 48.5 | 11.4 | 0.0 | 13.9 | 2.6 |
| Northern Trust | 6.6 | 1.6 | 5.1 | 7.9 | 16.1 | 0.0 | 16.1 | 5.0 |
| PNC | 5.4 | 1.3 | 2.8 | 8.6 | 9.2 | 17.4 | 3.0 | 2.6 |
| RBC USA | 6.7 | 2.8 | 5.8 | 9.8 | 12.9 | 17.4 | 11.4 | 4.3 |
| Regions | 6.7 | 2.0 | 5.1 | 8.7 | 9.7 | 15.7 | 16.0 | 4.0 |
| Santander | 11.7 | 1.4 | 4.2 | 8.6 | 6.3 | 17.4 | 17.5 | 2.1 |
| State Street | 3.8 | 0.0 | 0.0 | 8.4 | 8.1 | 0.0 | 0.0 | 3.3 |
| Synchrony Fncl | 20.7 | 0.0 | 0.0 | 28.8 | 14.8 | 20.5 | 22.1 | 5.8 |
| TD Group | 6.0 | 1.9 | 4.6 | 10.9 | 7.9 | 21.1 | 3.0 | 2.7 |
| Truist | 6.1 | 1.4 | 2.9 | 6.9 | 9.7 | 16.6 | 9.6 | 3.9 |
| UBS Americas | 2.5 | 2.1 | 0.0 | 3.6 | 9.9 | 17.4 | 0.6 | 7.5 |
| US Bancorp | 6.2 | 1.4 | 4.3 | 8.7 | 8.4 | 16.0 | 7.6 | 5.1 |
| Wells Fargo | 5.6 | 0.9 | 0.8 | 7.9 | 10.2 | 17.4 | 4.5 | 4.1 |
| 32 banks | 6.9 | 1.5 | 3.2 | 9.0 | 8.8 | 17.1 | 7.3 | 3.8 |
Note: These projections represent hypothetical estimates that involve an economic outcome that is more adverse than expected. Values may not sum precisely due to rounding.
1. Average loan balances used to calculate portfolio loss rates exclude loans held for sale, loans held for investment under the fair-value option, and Paycheck Protection Program loans and are calculated over nine quarters. Return to table
2. HELOCs (home equity lines of credit). Return to table
3. Commercial and industrial loans include small- and medium-enterprise loans and corporate cards. Return to table
4. Other consumer loans include student loans and automobile loans. Return to table
5. Other loans include international real estate loans. Return to table
Source: Federal Reserve estimates in the severely adverse scenario.
Loan loss rates also reflect differences in the characteristics of loans within each portfolio. For example, the aggregate projected loss rate on commercial and industrial (C&I) loans across all banks is 9 percent. The loss rate on C&I loans among individual banks ranges from 3.4 percent to 48.5 percent. For credit cards, the range of projected loss rates among banks is 9.5 percent to 22.7 percent, and the aggregate projected loss rate is 17.1 percent.
For loans measured at fair value, losses enter pre-tax net income through other losses/gains (see table 8). Loans measured at amortized cost and those measured at fair value generally have similar risk factors, but the latter are exposed to risk from the effects of market fluctuations, which can lead to more severe market value losses in periods of high market volatility or asset illiquidity.
Aggregate trading and counterparty losses, which also flow into pre-tax net income, are $37 billion for the 10 banks subject to the global market shock component and/or the largest counterparty default component of the severely adverse scenario. Individual bank losses range from less than $1 billion to $9 billion, resulting from the specific risk characteristics of each bank's trading positions and counterparty exposures, inclusive of hedges (see table 8). Importantly, these projected losses are based on the trading positions and counterparty exposures held by banks on the same as-of date (October 17, 2025) and could have varied if they had been based on a different date.
Aggregate credit losses on investment securities are $7 billion (see table 7). In addition, unrealized gains and losses on available-for-sale debt securities are reflected in accumulated other comprehensive income (AOCI).20 Other comprehensive income (OCI) is projected to be $43 billion in aggregate.
Pre-provision Net Revenue
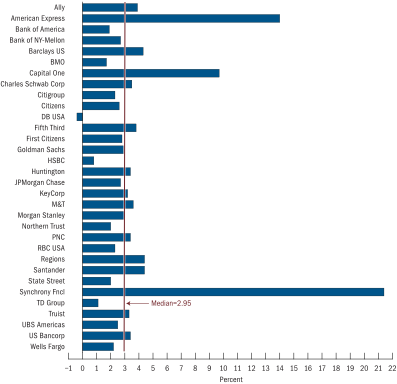
Pre-tax net income also includes projections of post-stress income and expenses captured in pre-provision net revenue (PPNR). Over the projection horizon, banks are projected to generate an aggregate of $719 billion in PPNR, which is equal to 3 percent of their combined average assets (see table 7).
PPNR projections are generally driven by the shape of the yield curve, the path of asset prices, equity market volatility, and measures of economic activity in the severely adverse scenario. In addition, PPNR incorporates expenses stemming from operational-risk events, such as fraud, employee lawsuits, litigation-related expenses, or computer system or other operating disruptions.21 In the aggregate, operational-risk losses are $211 billion.
The ratio of PPNR to average assets varies across banks (see figure 8), primarily because of differences in business focus. For instance, the ratio of PPNR to assets tends to be higher at banks focusing on credit card lending, since credit cards generally produce higher net interest income relative to other forms of lending.22 Additionally, lower ratios of PPNR to assets do not necessarily imply lower pre-tax net income, because the same business focus and risk characteristics determining differences in PPNR across banks could also result in offsetting projected losses.
Figure 8. Pre-provision net revenue rates in the severely adverse scenario
Accessible Version | Return to text
Note: Estimates are for the nine-quarter period from 2026:Q1 to 2028:Q1 as a percent of average assets.
Box 1. 2026 Stress Test 9-Quarter Projection
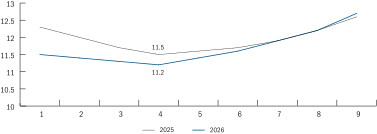
To promote the transparency of the stress test, in December 2025, the Federal Reserve published aggregate 9-quarter projections of certain variables from the 2025 stress test results.1 These variables included projected capital ratios, income, and loan losses, as well as other projected values. In the 2025 stress test, the projected minimum aggregate CET1 ratio was 11.5 percent and occurred in the fourth projection quarter.
In conjunction with the publication of this year's stress test results, the Federal Reserve also disclosed data for aggregate 9-quarter projections of the same set of variables for the 2026 stress test.2 In the 2026 stress test, the minimum aggregate CET1 capital ratio was 11.2 percent and also occurred in the fourth projection quarter (see figure A).
Figure A. Projected common equity tier 1 capital ratio, supervisory severely adverse scenario
Accessible Version | Return to text
Note: The 2025 line includes 30 firms that participated in the 2024 stress test using the full phase-in of 2025 stress test models, as published on the Federal Reserve website on December 1, 2025. The 2026 line includes 32 firms that participated in the 2026 stress test using 2026 stress test models.
1. These data files can be found on the 2026 stress test site at https://www.federalreserve.gov/supervisionreg/dfa-stress-tests-2026.htm. Return to text
2. These data files can be found on the 2026 stress test site at https://www.federalreserve.gov/supervisionreg/dfa-stress-tests-2026.htm. Return to text
References
14. For risk-based capital ratios, the numerator is capital, which is primarily impacted from pre-tax net income and gains/losses on available-for-sale (AFS) debt securities. The denominator for risk-based capital ratios is risk-weighted assets. Risk-weighted assets change minimally throughout the projection horizon as the result of an assumption that a bank's assets generally remain unchanged. Return to text
15. The banks subject to the global market shock component and/or the largest counterparty default component are Bank of America Corporation; The Bank of New York Mellon Corporation; Barclays US LLC; Citigroup, Inc.; DB USA Corporation; The Goldman Sachs Group, Inc.; JPMorgan Chase & Co.; Morgan Stanley; State Street Corporation; and Wells Fargo & Company. Return to text
16. For banks that have adopted ASU 2016-13, the Federal Reserve incorporated its projection of expected credit losses on securities in the allowance for credit losses, in accordance with Financial Accounting Standards Board (FASB), "Financial Instruments—Credit Losses (Topic 326)," FASB ASU 2016-13 (Norwalk, CT: FASB, June 2016). Prior to the adoption of ASU 2016-13, securities credit losses were realized through other-than-temporary impairment. Return to text
17. The loss rate is calculated as total projected loan losses over the nine quarters of the projection horizon divided by average loan balances over the horizon. Return to text
18. Provisions for loan and lease losses equal projected loan losses plus the amount needed for the allowance to be at an appropriate level at the end of each quarter. Return to text
19. In addition, losses are calculated based on the exposure at default, which includes both outstanding balances and any additional drawdown of the credit line that occurs prior to default, while loss rates are calculated as a percentage of average outstanding balances over the projection horizon. Return to text
20. Only banks subject to Category I or II standards or banks that opt in are required to include unrealized gains and losses on AFS debt securities in the calculation of capital. Category III and IV banks are not required to include unrealized gains and losses on AFS debt securities in the calculation of capital. Return to text
21. These operational-risk expenses are not a supervisory estimate of banks' current or expected legal liability, as they are based on the severely adverse scenario and conservative assumptions, and they also incorporate the potential for substantial losses that do not involve litigation or legal exposure. Return to text
22. Credit card lending also tends to generate relatively high loss rates, suggesting that the higher PPNR rates at these banks do not necessarily indicate higher profitability. Return to text