Industrial Production and Capacity Utilization - G.17
During the week of November 9, the “Build Your Package” feature in the Data Download Program (DDP) will be removed in preparation for the eventual retirement of the DDP. Users can access data and expanded download options through the Federal Reserve Bank of St. Louis's Federal Reserve Economic Data (FRED). Learn more about the DDP and FRED partnership.
Current Release PDF ASCII RSS Data Download FRED XML
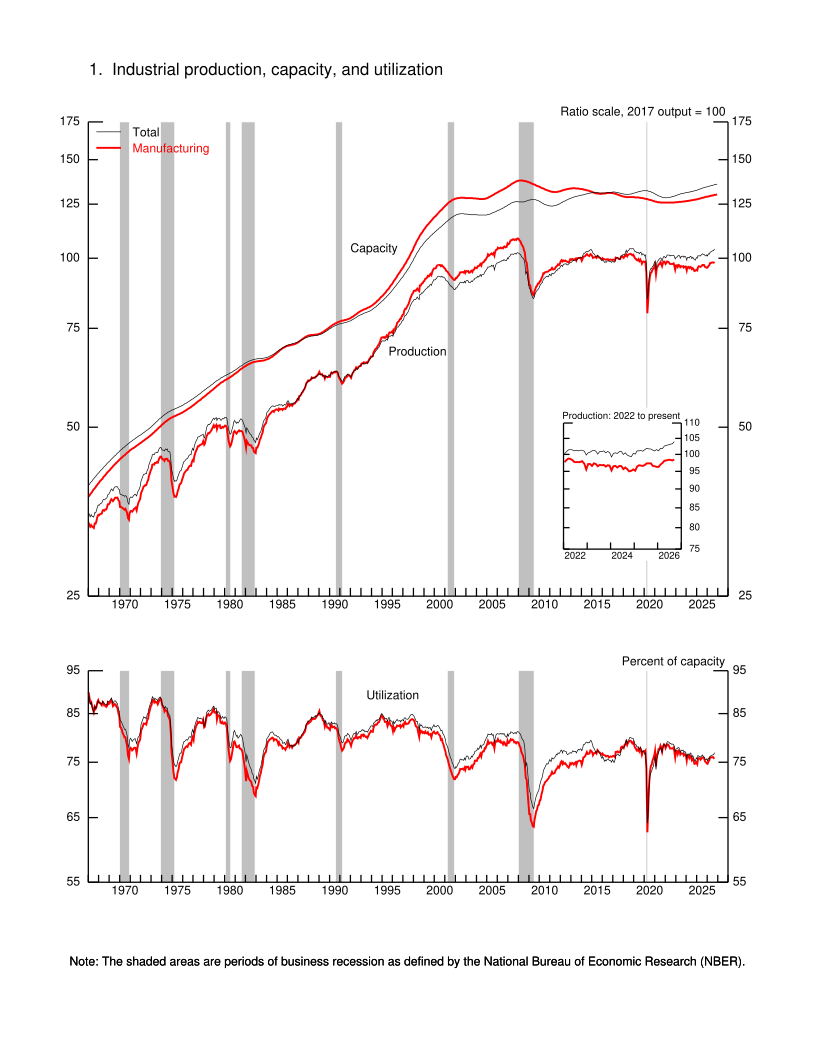
Industrial production (IP) increased 0.7 percent in September after edging up 0.1 percent in August. In the third quarter, IP increased at an annual rate of 2.8 percent. Manufacturing output rose 0.3 percent in September. The index for mining moved up 0.2 percent, and the index for utilities increased 3.5 percent. At 104.0 percent of its 2017 average, total IP in September was 2.2 percent above its year-earlier level. Capacity utilization moved up to 76.9 percent in September, a rate that is 2.5 percentage points below its long-run (1972–2025) average.
Industrial Production and Capacity Utilization: Summary
| Industrial production | 2017=100 | Percent change | |||||||||||
|---|---|---|---|---|---|---|---|---|---|---|---|---|---|
| 2026 | 2026 | Sept. '25 to Sept. '26 |
|||||||||||
| Apr.[r] | May[r] | June[r] | July[r] | Aug.[r] | Sept.[p] | Apr.[r] | May[r] | June[r] | July[r] | Aug.[r] | Sept.[p] | ||
| Total index | 102.6 | 102.7 | 103.0 | 103.2 | 103.3 | 104.0 | .8 | .1 | .2 | .2 | .1 | .7 | 2.2 |
| Previous estimates | 102.6 | 102.6 | 102.8 | 103.0 | 103.1 | .8 | .1 | .2 | .2 | .0 | |||
| Major market groups | |||||||||||||
| Final Products | 98.6 | 98.8 | 99.1 | 99.4 | 99.3 | 99.8 | 1.0 | .3 | .2 | .4 | -.1 | .5 | 1.9 |
| Consumer goods | 97.6 | 97.4 | 97.6 | 97.5 | 97.5 | 98.1 | .6 | -.2 | .2 | .0 | .0 | .7 | -.1 |
| Business equipment | 98.5 | 99.8 | 100.1 | 101.2 | 101.0 | 101.0 | 2.0 | 1.3 | .4 | 1.0 | -.1 | .0 | 6.7 |
| Nonindustrial supplies | 99.5 | 99.5 | 99.6 | 99.4 | 99.3 | 100.2 | .2 | -.1 | .1 | -.2 | -.1 | .9 | 2.1 |
| Construction | 100.4 | 101.1 | 101.5 | 101.9 | 101.2 | 102.2 | -.2 | .7 | .4 | .4 | -.7 | 1.0 | 1.6 |
| Materials | 107.4 | 107.5 | 107.8 | 108.1 | 108.4 | 109.2 | .9 | .1 | .3 | .3 | .3 | .7 | 2.6 |
| Major industry groups | |||||||||||||
| Manufacturing (see note below) | 98.1 | 98.1 | 98.3 | 98.4 | 98.2 | 98.4 | .7 | .1 | .2 | .1 | -.2 | .3 | 1.1 |
| Previous estimates | 98.1 | 98.1 | 98.3 | 98.4 | 98.2 | .7 | .1 | .1 | .2 | -.3 | |||
| Mining | 122.0 | 122.8 | 123.3 | 123.7 | 124.3 | 124.5 | 1.5 | .6 | .4 | .4 | .5 | .2 | 2.8 |
| Utilities | 110.1 | 110.1 | 110.5 | 111.7 | 113.3 | 117.3 | .9 | .0 | .3 | 1.1 | 1.5 | 3.5 | 8.7 |
| Capacity utilization | Percent of capacity | Capacity growth |
|||||||||||
|---|---|---|---|---|---|---|---|---|---|---|---|---|---|
| Average 1972- 2025 |
1988- 89 high |
1990- 91 low |
1994- 95 high |
2009 low |
2025 Sept. |
||||||||
| 2026 | Sept. '25 to Sept. '26 |
||||||||||||
| Apr.[r] | May[r] | June[r] | July[r] | Aug.[r] | Sept.[p] | ||||||||
| Total industry | 79.4 | 85.2 | 78.8 | 85.0 | 66.5 | 76.0 | 76.2 | 76.2 | 76.3 | 76.4 | 76.4 | 76.9 | 1.2 |
| Previous estimates | 76.2 | 76.2 | 76.2 | 76.3 | 76.3 | ||||||||
| Manufacturing (see note below) | 78.2 | 85.5 | 77.2 | 84.6 | 63.4 | 75.8 | 75.9 | 75.9 | 76.0 | 76.0 | 75.8 | 75.9 | 1.0 |
| Previous estimates | 75.9 | 75.9 | 76.0 | 76.0 | 75.7 | ||||||||
| Mining | 85.2 | 86.3 | 84.4 | 88.6 | 78.3 | 85.0 | 85.8 | 86.4 | 86.7 | 87.0 | 87.4 | 87.5 | -.1 |
| Utilities | 84.0 | 93.2 | 84.7 | 93.2 | 78.1 | 70.0 | 70.0 | 69.9 | 70.0 | 70.6 | 71.5 | 73.8 | 3.1 |
| Stage-of-process groups | |||||||||||||
| Crude | 84.5 | 87.9 | 84.9 | 90.0 | 76.5 | 83.5 | 83.3 | 83.8 | 83.7 | 83.6 | 84.0 | 84.0 | -.1 |
| Primary and semifinished | 80.1 | 86.4 | 77.9 | 87.7 | 63.5 | 75.4 | 75.8 | 75.9 | 76.0 | 76.2 | 76.3 | 77.2 | 1.4 |
| Finished | 76.6 | 83.3 | 77.4 | 80.7 | 66.3 | 73.9 | 73.9 | 73.8 | 74.0 | 74.1 | 73.7 | 73.7 | 1.3 |
Market Groups
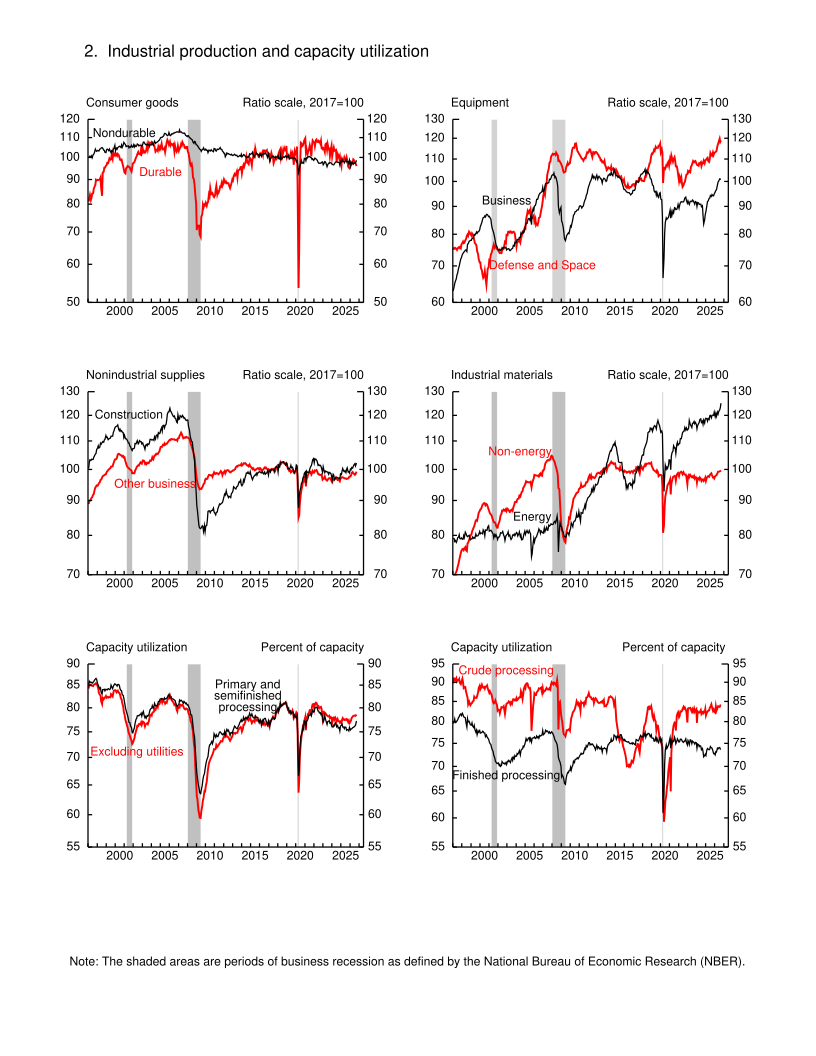
All major market groups posted gains in September except business equipment, which recorded no change. The production of consumer goods rose 0.7 percent, as a gain in nondurable consumer goods output more than offset a decline in durable consumer goods output. Output of defense and space equipment rose 0.4 percent. The index for construction supplies increased 1.0 percent, and the index for business supplies rose 0.9 percent. Materials output moved up 0.7 percent, with gains in its energy and non-energy components.
Industry Groups
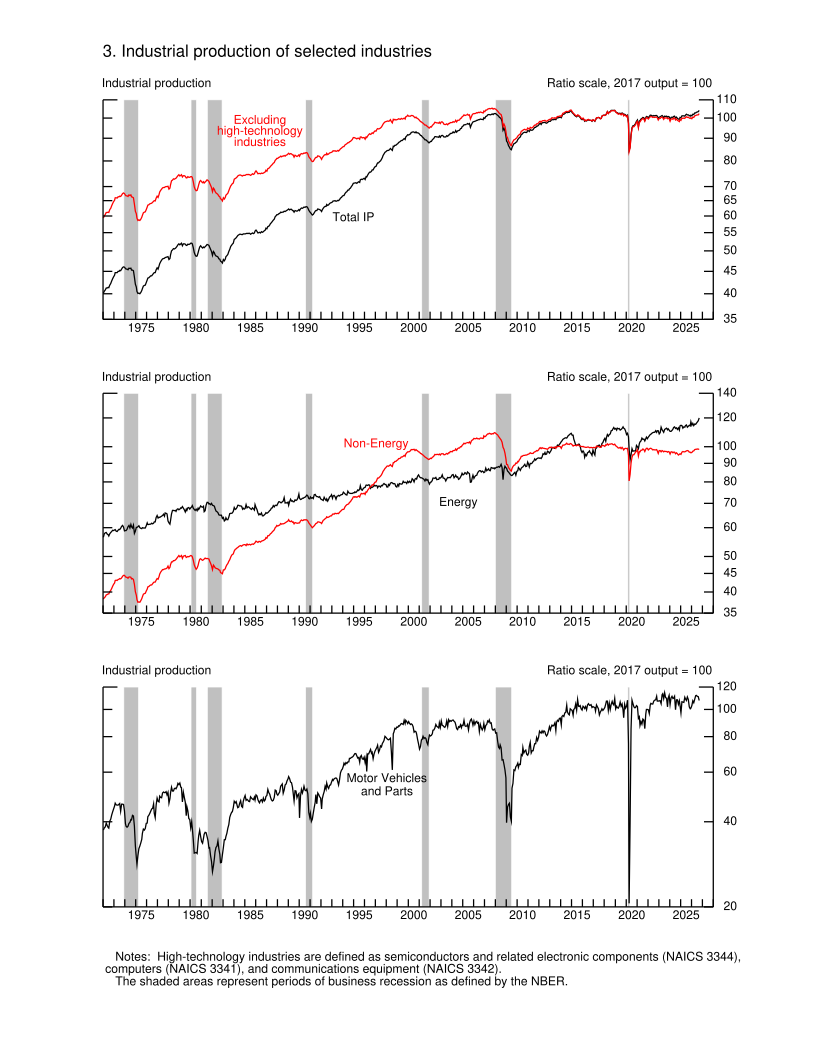
Manufacturing output rose 0.3 percent in September and increased at an annual rate of 0.7 percent in the third quarter. The durable manufacturing index ticked up 0.1 percent in September. Within durables, gains of 1 percent or more were posted by primary metals; machinery; and electrical equipment, appliances, and components. Output of motor vehicles and parts declined 3.0 percent. The nondurable manufacturing index increased 0.4 percent, led by gains in the indexes for printing and support and for chemicals. In the third quarter as a whole, durable manufacturing output rose at an annual rate of 3.8 percent—driven in part by a 28.4 percent gain in the output of semiconductors and related electronic components—while nondurable manufacturing output fell 1.6 percent.
Mining output moved up 0.2 percent in September and expanded at an annual rate of 5.0 percent in the third quarter. The index for utilities rose 3.5 percent in September, with gains in the indexes for electric utilities and for natural gas utilities. In the third quarter, utilities output increased at an annual rate of 14.8 percent.
Capacity utilization for manufacturing increased 0.1 percentage point in September to 75.9 percent, a rate that is 2.3 percentage points below its long-run (1972–2025) average. The operating rate for mining ticked up 0.1 percentage point to 87.5 percent in September, and the operating rate for utilities increased 2.3 percentage points to 73.8 percent. The rate for mining was 2.3 percentage points above its long-run average, while the rate for utilities remained substantially below its long-run average.
Revision of Industrial Production and Capacity Utilization
The Federal Reserve Board plans to issue its annual revision to the indexes of industrial production (IP) and the related measures of capacity utilization on November 24, 2026. The base year for the revised indexes will be 2022. New annual benchmark data for manufacturing from the Census Bureau for 2023 and 2024 will be incorporated, as well as other annual data, including information on the mining of metallic and nonmetallic minerals (except fuels). The updated IP indexes will include revisions to the monthly indicator (either product data or input data) and to seasonal factors for each industry. In addition, the estimation methods for some series may be changed. Any modifications to the methods for estimating the output of an industry will affect the index from 1972 to the present.
Capacity and capacity utilization will be revised to incorporate data for manufacturing through the fourth quarter of 2025 from the U.S. Census Bureau's Quarterly Survey of Plant Capacity Utilization, along with new data on capacity from the U.S. Geological Survey, the U.S. Department of Energy, and other organizations.
Note. The statistics in this release cover output, capacity, and capacity utilization in the U.S. industrial sector, which is defined by the Federal Reserve to comprise manufacturing, mining, and electric and gas utilities. Mining is defined as all industries in sector 21 of the North American Industry Classification System (NAICS); electric and gas utilities are those in NAICS sectors 2211 and 2212. Manufacturing comprises NAICS manufacturing industries (sector 31-33) plus the logging industry and the newspaper, periodical, book, and directory publishing industries (except exclusive Internet publishing). Logging and publishing are classified elsewhere in NAICS (under agriculture and information respectively), but historically they were considered to be manufacturing and were included in the industrial sector under the Standard Industrial Classification (SIC) system. In December 2002, the Federal Reserve reclassified all of its industrial output data from the SIC system to NAICS.G.17 Release Tables:
- Summary: Industrial Production and Capacity Utilization
- Chart 1: Industrial Production, Capacity, and Capacity Utilization
- Chart 2: Industrial Production and Capacity Utilization
- Chart 3: Industrial Production of Selected Industries
- Table 1: Industrial Production: Market and Industry Groups (percent change)
- Table 2: Industrial Production: Special Aggregates and Selected Detail (percent change)
- Table 3: Motor Vehicle Assemblies
- Table 4: Industrial Production Indexes: Market and Industry Group Summary
- Table 5: Industrial Production Indexes: Special Aggregates
- Table 6: Diffusion Indexes of Industrial Production
- Table 7: Capacity Utilization: Manufacturing, Mining, and Utilities
- Table 8: Industrial Capacity: Manufacturing, Mining, and Utilities (percent change)
- Table 9: Industrial Production: Gross Value of Products and Nonindustrial Supplies
- Table 10: Gross-Value-Weighted Industrial Production: Stage-of-Process Groups
- Table 11: Historical Statistics for IP, Capacity, and Utilization: Total Industry
- Table 12: Historical Statistics for IP, Capacity, and Utilization: Manufacturing
- Table 13: Historical Statistics for IP, Capacity, and Utilization: Total Industry excluding Selected High-Technology Industries
- Table 14: Historical Statistics for IP, Capacity, and Utilization: Manufacturing excluding Selected High-Technology Industries
- Table 15: Industrial Production: Reliability Estimates