FEDS Notes
July 31, 2020
How Did Banks Fund C&I Drawdowns at the Onset of the COVID-19 Crisis?
David Glancy, Max Gross, and Felicia Ionescu1
Banks experienced significant balance sheet expansions in March 2020 due to unprecedented increases in commercial and industrial (C&I) loans and deposit funding. According to the Federal Reserve's H.8 data, "Assets and Liabilities of Commercial Banks in the U.S.", C&I loans increased by nearly $480 billion in March—the largest monthly increase in the history of this series, surpassing the nearly $90 billion increase in C&I loans in the six weeks following Lehman Brothers' collapse in 2008 (see Figure 1). Commentary in banks' and firms' earnings calls, as well as write-in comments provided in weekly data submissions, indicate that this growth was primarily attributable to firms drawing down revolving lines of credit to make up for revenue and funding disruptions related to the coronavirus pandemic.
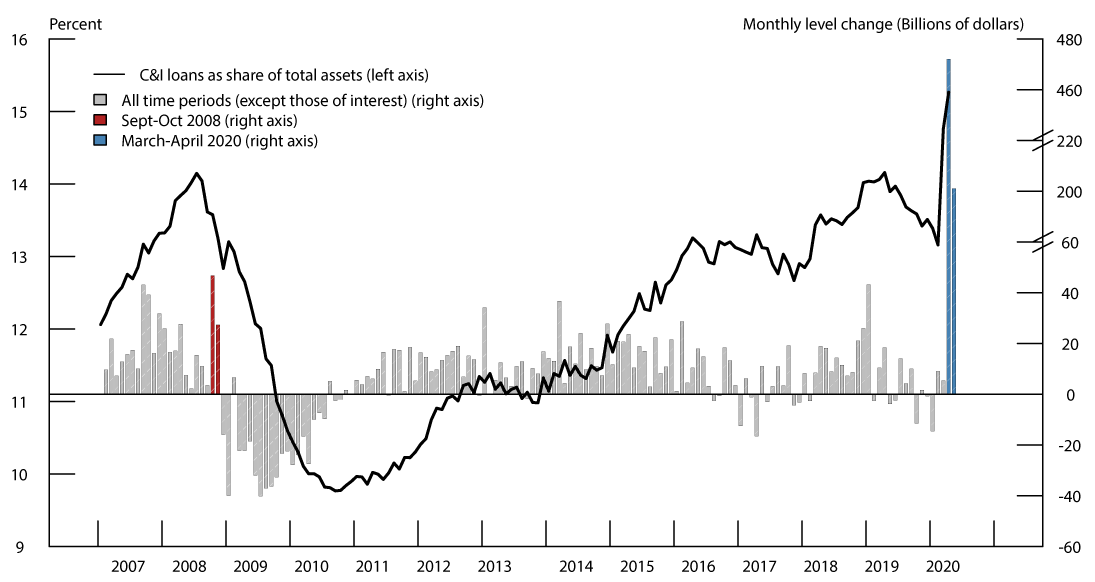
Note: Bars show changes in C&I outstanding over the course of each month from 2007 to the present. Month-end levels are linearly imputed from weekly data. C&I loan flows exclude loans to non-depository financial institutions due to a change in reporting in this interval.
Source: FR 2644.
The unparalleled magnitude of these draws could potentially strain banks' liquidity positions. However, banks also experienced over $800 billion in deposit inflows in March 2020, possibly mitigating these strains. While deposit increases outpaced C&I loan increases in aggregate, this does not necessarily imply that deposits were sufficient to fund the large draws for all banks. If the banks that experienced the largest C&I drawdowns did not also receive correspondingly larger deposit inflows, they might need to liquidate assets or increase other types of funding. This note uses high-frequency, individual bank balance sheet data to shed light on these issues and investigate how banks adjusted balance sheets to fund the large C&I drawdowns.
We find that deposits and non-deposit borrowings increased in weeks with high C&I draws, especially at large banks. Smaller banks experienced smaller deposit inflows, and thus also reduced liquid assets to fund draws. The large C&I draws therefore broadly expanded banks' balance sheets, and diminished stocks of liquid assets at smaller banks, potentially putting pressure on bank capital requirements and liquidity positions.2 These developments highlight the importance of recent policies to ease capital constraints and provide liquidity to the sector.
Data
In order to study how banks responded to C&I drawdowns in the COVID-19 episode, we use microdata from FR 2644 filings.3 These data include weekly information on the size and composition of the portfolios of a random stratified sample of about 875 domestically chartered banks and U.S. branches and agencies of foreign banks. These data allow us to test how banks that experienced large increases in C&I loans in a given week adjusted their balance sheets to accommodate these increases.4 We include in C&I loans both conventional C&I loans (as defined in the Call Reports) and loans to non-depository financial institutions. We include the latter in order to capture draws from institutions such as Real Estate Investment Trusts (REITs), which also utilized bank credit lines heavily during our period of interest. We predominantly use data from March 4 to April 1 in order to capture the weeks with the largest C&I draws, and to avoid up effects from the Payroll Protection Program, which significantly affected C&I lending in the following weeks.5
We conduct the analysis for four types of banks. We break down findings for domestically chartered banks based on their total assets as of March 4, 2020, choosing thresholds so as to group banks operating in similar regulatory environments.6 Large banks are those with assets exceeding $100 billion, midsized banks have assets between $10 billion and $100 billion, and small banks have assets under $10 billion. We separately study the response of branches and agencies of foreign banks. We omit banks in holding companies that predominantly operate as custodian or investment banks, banks with minimal C&I holdings (less than 5 percent of assets), and observations with extreme draws from our analysis.7
Aggregate Changes in Balance Sheets
Figure 2 summarizes changes in banks' balance sheets in March 2020, aggregated across all respondent banks for a given week. The height of each segment reflects the weekly change in a particular asset or liability, normalized by initial assets. As shown, the most dramatic expansion in banks' balance sheets occurred in the two weeks from March 11 to March 25. C&I loans outstanding increased by over 1% of initial assets each week, while deposits and cash increased even more. Non-deposit financing also increased notably during these weeks, indicating that, despite the large increases in deposits, some banks experienced increased funding needs not satisfied by deposit inflows.
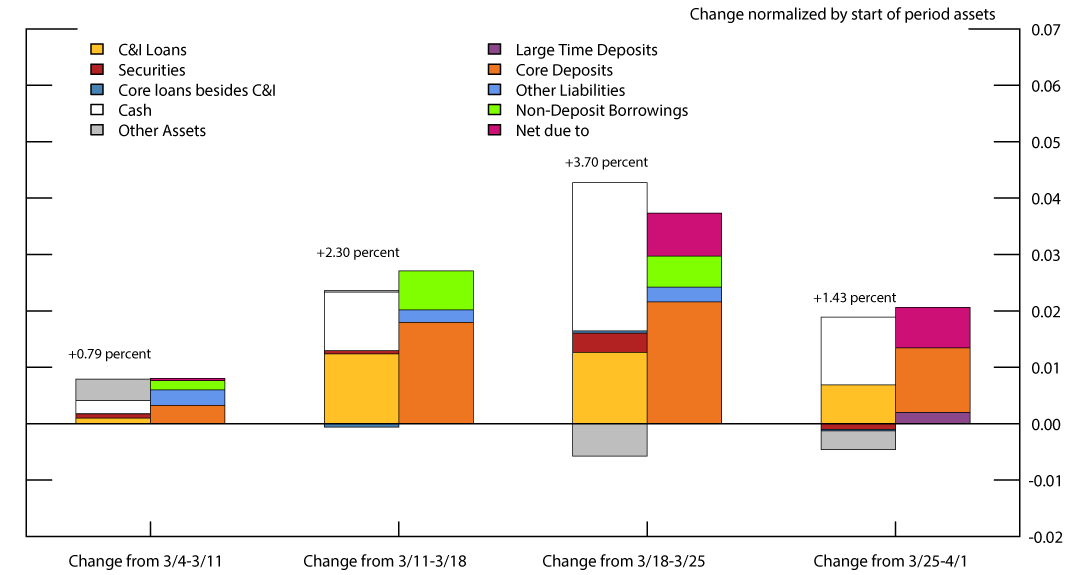
Note: Bars show weekly changes in assets (left bars) and liabilities (right bars) as a percentage of March 4 assets. Changes are aggregated across all respondent banks. The four largest changes from 3/4 to 3/11 were to other assets (+0.4%), core deposits (+0.3%), other liabilities (+0.3%), and cash (+0.2%). The largest changes from 3/11 to 3/18 were to core deposits (+1.8%), C&I loans (+1.2%), cash (+1.0%), and borrowings (+0.7%). The largest changes from 3/18 to 3/25 were to cash (+2.6%), core deposits (+2.2%), C&I loans (+1.3%), and net due to (+0.8%). The largest changes from 3/25 to 4/1 were to cash (+1.2%), core deposits (+1.1%), net due to (+0.7%) and C&I loans (+0.7%).
Source: FR 2644.
This substantial asset growth occurred for banks of all sizes and was particularly pronounced for large banks and branches of foreign banks. Figure 3 summarizes changes in banks' balance sheets between March 4 and April 1 across all four bank types in our analysis, with each pair of bars reflecting the change in assets and liabilities for a particular bank type. As shown, large domestic banks increased in size by about 8 percent, accounting for about half of the total increase in bank assets, with midsized and small domestic banks increasing by about 5 percent and 2 percent, respectively. Assets in foreign branches grew by nearly 20 percent, but accounted for a smaller portion of the overall expansion than large banks, due to their smaller initial size.
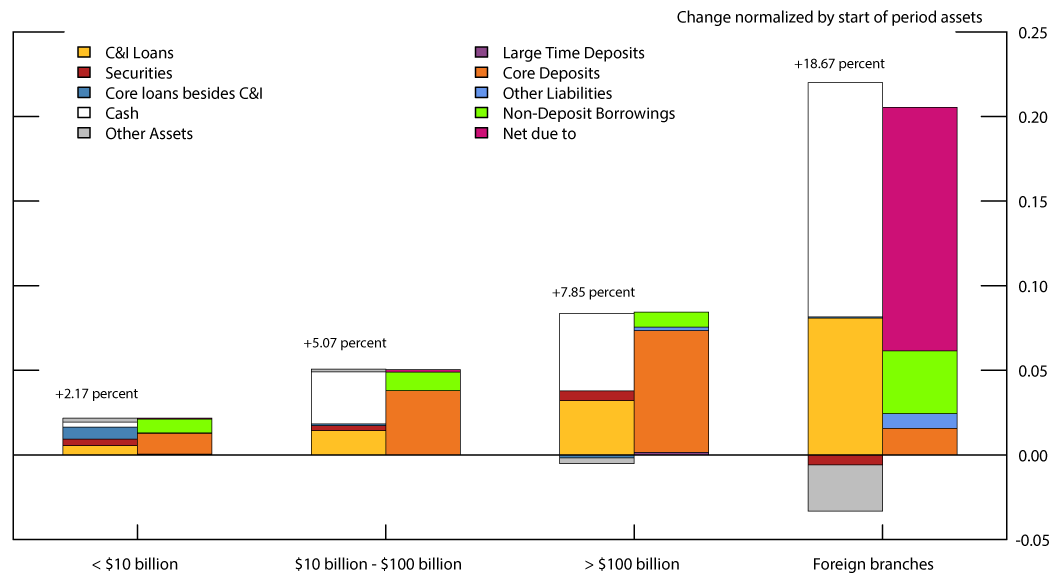
Note: Bars show changes in assets (left bars) and liabilities (right bars) from March 4 to April 1, 2020 as a percentage of initial assets. Changes are aggregated across all banks within a particular size category that responded to both the March 4 and April 1 survey. Banks are categorized based on March 4 assets. The first three bars include domestic banks only, while the fourth bar shows results for branches and agencies of foreign banks. The largest changes for small banks were to core deposits (+1.2%), borrowings (+0.8%), core loans besides C&I (+0.7%), and C&I loans (+0.5%). The largest changes for midsized banks were to core deposits (+3.8%), cash (+3.1%), C&I loans (+1.4%) and borrowings (+1.1%). The largest changes for large banks were to core deposits (+7.2%), cash (+4.6%), C&I loans (+3.2%) and borrowings (+0.9%). The largest changes for foreign branches were to net due to (+14.4%), cash (+13.9%), C&I loans (+8.1%), and borrowings (+3.7%).
Source: FR 2644.
This expansion in balance sheets seems to be primarily attributable to two factors: unprecedented C&I draws increasing lending and flight to quality effects increasing deposits. In large domestic banks, C&I loans increased by nearly $350 billion dollars over the course of four weeks, or about 3 percent of their initial assets. Deposits increased about double that. C&I loans grew at an even faster pace at branches and agencies of foreign banks, funded by an increase in the net amount due to related institutions. Similarly, small and midsized banks experienced increases in C&I loans and in deposits, however this growth was much smaller than at larger banks. Additionally, cash increased by over $900 billion dollars over this period, with fast growth at larger domestic banks and at branches and agencies of foreign banks.
Overall, the aggregate numbers show deposit inflows exceeding C&I draws, allowing banks to increase cash holdings. The substantial draws in March thus do not appear to have caused liquidity strains for the banking sector as a whole. However, aggregate numbers may give a misleading sense of how draws affected individual banks. If the banks that experienced the largest C&I credit line drawdowns did not also have significantly larger deposit inflows, then they might have needed to adjust elsewhere on their balance sheet to fund soaring C&I lending. To study this issue, the next section analyzes how individual banks responded to C&I draws.
Cross-sectional Changes in Banks' Balance Sheets
Figure 4 presents a set of scatter plots summarizing the cross-sectional relationship between C&I drawdowns and changes in liquid assets (cash, securities, repos, and fed funds sold), deposits, and non-deposit borrowings. Each dot represents a certain bank-week observation, with the change in C&I loans as a percent of assets on the x-axis and the change in the studied balance sheet variable as a percent of assets on the y-axis. Each chart also presents the results of the corresponding regression between these variables, representing the expected change in the balance sheet item for each dollar increase in C&I loans.
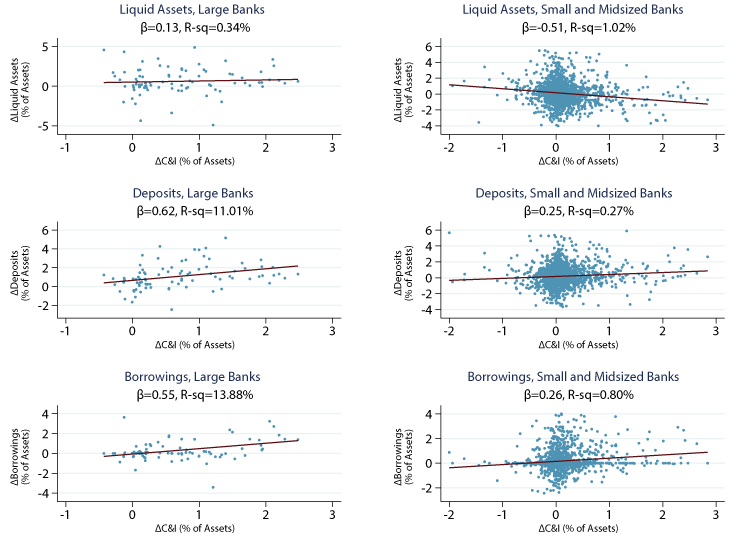
Note: Charts plot the weekly change in various balance sheet items (as a percent of initial assets) against changes in C&I loans for a particular bank category. Each chart also displays the line of best fit between these variables, as well as the regression coefficient and R-squared from the corresponding regression. Observations where the dependent variable is below the 1st percentile or above the 99th percentile are suppressed in the scatter plot to facilitate display, but are still used to estimate the regression line. Observations are at the bank-week level, and span the period between March 4 and April 1. Left charts include observations from domestic banks with over $100 billion in assets as of March 4, while right charts include domestic banks with less than $100 billion in assets
Source: FR 2644.
Large domestic banks, which accounted for the vast majority of the drawdowns, funded these draws entirely by expanding liabilities, with higher deposits (middle-left chart) and non-deposit borrowings (bottom-left chart). Based on regression estimates, banks that faced an extra dollar in draws increased deposit funding by about 62 cents and other borrowing by about 55 cents, which accounted for all of the increase in total assets. Large banks in fact increased liquid assets somewhat in weeks with elevated C&I draws (top-left chart).
In contrast to large banks, small and midsized domestic banks were more prone to reduce holdings of liquid assets when faced with C&I draws (top-right chart). We estimate that an extra dollar in draws resulted in about a 51 cent decrease in liquid assets. As with larger banks, to the extent that C&I draws expanded small and midsized banks' balance sheets, this expansion was funded with a combination of roughly equal increases in deposits and non-deposit borrowings. However, caution is warranted for these values, as the fit in the regressions for smaller banks is not as good as the fit for larger banks. C&I draws were much more significant for larger banks resulting in more precision in our estimates for how these banks responded to draws.
Our analysis reveals several key findings on how banks funded C&I draws that merely examining aggregate credit flows cannot capture. First, while deposit growth out-paced C&I draws more often than not, there are still a significant number of banks for which draws exceeded deposit inflows. For example, there are a number of large banks that experienced weekly C&I draws in the neighborhood of 2 percent of assets. As illustrated, deposit inflows for these banks were typically not sufficient to fund such large draws, and these banks significantly increased non-deposit borrowing. Second, while banks increased cash in aggregate, the scatter plots show that smaller banks reduced liquid assets (predominantly cash) when faced with high C&I draws. Thus while the banking sector overall was awash in deposits, many individual banks needed to turn to other sources of funding to accommodate the increased C&I demand. These findings highlight the importance of policies to facilitate banks' ability to access finance, such as encouraging the use of the discount window.
Our results so far demonstrate how banks responded to draws at a high level, with large domestic banks funding draws with higher deposits and non-deposit borrowings and small and midsized banks also needing to reduce liquid assets in addition to using deposits and non-deposit borrowing. We next turn to studying changes at a more granular level (e.g. examining which liquid assets decline) or in other categories (e.g. non-C&I lending).
We present a full decomposition of the cross-sectional changes in banks' balance sheets in response to C&I draws. In general, each dollar increase in C&I loans needs to have a corresponding increase in funding or decrease in other assets. We use this balance sheet identity to create a similar identity for regression coefficients of the type displayed in the scatter plots in Figure 4: the predicted effect of a dollar increase in C&I loans must be a dollar increase across a bank's funding sources, net of changes in other assets.8
Figure 5 presents the results of this decomposition at a granular level with a stacked bar chart, where the height of each segment in these bars illustrates how much banks adjusted a particular balance sheet item to fund C&I draws. For liabilities, this height is the coefficient from regressing changes in that particular liability on changes in C&I loans, both as a percent of bank assets. For assets, the sign of the coefficient is reversed as declines in an asset can be used to fund a loan. These segments add up to one, and thus can be interpreted as the share of the increase in C&I loans funded by adjusting that particular balance sheet component.
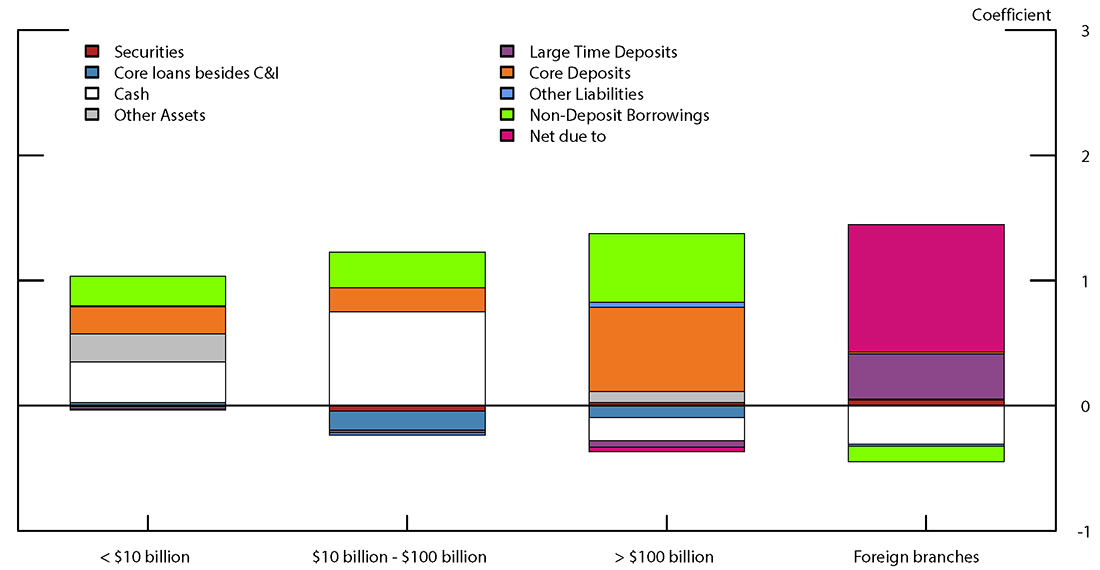
Note: Segments show how much banks adjusted a particular balance sheet item to fund increases in C&I loans. Results are based on regression of weekly changes in various balance sheet items (as a percent of initial assets) against changes in C&I loans. For liabilities, this regression coefficient is plotted, reflecting how much that funding source increased for each dollar increase in C&I. For assets, the sign of the coefficient is reversed when plotted to reflect the fact that declines in other assets can accommodate C&I draws. The sample includes the four weeks from March 4, 2020 to April 1, 2020. Each bar decomposes the response for a particular category of bank. The largest margins of adjustment for small banks were to cash (+32.1%), borrowings (+23.5%), other assets (+22.5%), and core deposits (+21.6%). The largest adjustments for midsized banks were to cash (+75.1%), borrowings (+28.5%), core deposits (+18.9%), and core loans besides C&I (-14.9%). The largest adjustments for large banks were to core deposits (+67.2%), borrowings (+54.6%), cash (-18.5%) and core loans besides C&I (-9.4%). The largest adjustments for foreign branches were to net due to (+101.8%), large time deposits (+36.0%), cash (-30.9%), and borrowings (-12.2%). Source: FR 2644.
Source: FR 2644.
As shown, the main margins of adjustment for domestic banks are to the three variables analyzed in the scatter plots: liquid assets, deposits and non-deposit borrowings. Almost the entire relationship between deposits growth and C&I draws comes from core deposits, as opposed to large time deposits, which likely reflects firms depositing drawn credit into operating accounts at the banks holding their loans. The figure also provides a closer look at which liquid assets change. Changes in securities and short term lending (repos and fed funds sold goes into the other asset category) did not move much with C&I draws, so most of the change in liquid assets shown in the scatter plots is due to changes in cash holdings. One exception is for small banks, for whom declines in short term lending make up a significant share of the decline in liquid assets in response to C&I draws. Lastly, much like large banks, foreign branches and agencies of foreign banks increased cash in weeks with high draws, likely due to banks building up liquidity to fund anticipated future draws. As a result, these branches needed a large increase in funding, which seem to have mostly come from parent foreign banking organizations. The figure shows that net due to related institutions increases about 1-for-1 with C&I draws.9
Figure 6 displays an equivalent decomposition of how bank balance sheets change with C&I loan increases, but for the period from 2015 to 2019, allowing us to compare results with more normal times. As this period featured a fairly similar regulatory environment to the COVID-19 episode, the primary difference is likely the effects of the virus, most notably the increase in C&I loan demand. During normal times, weekly changes in C&I loans ranged from $14 billion to $22 billion, compared to $29 billion to $226 billion during the COVID-19 episode.
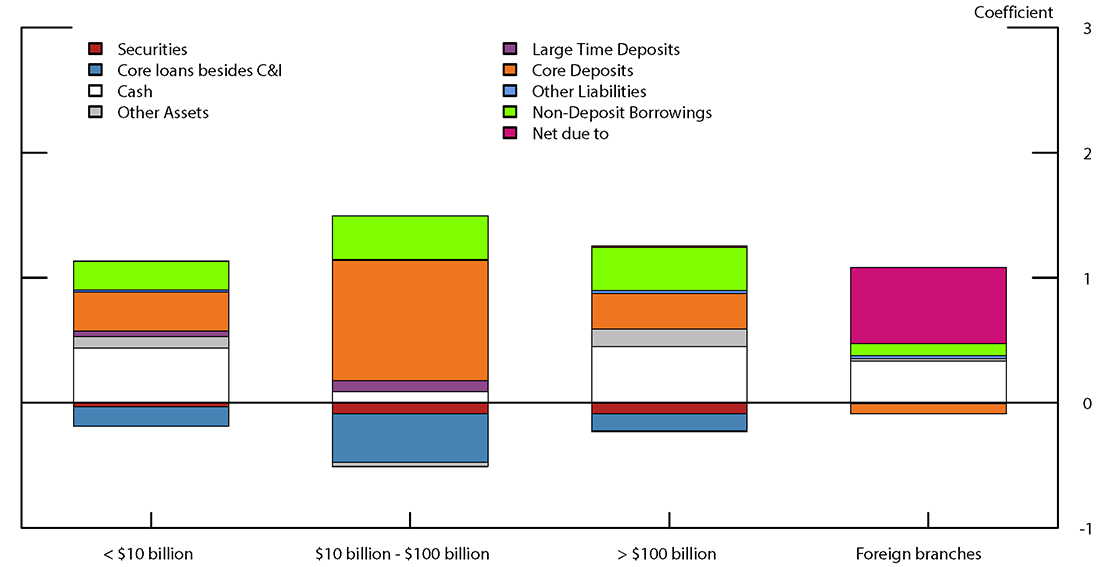
Note: Segments show how much banks adjusted a particular balance sheet item to fund increases in C&I loans. Results are based on regression of weekly changes in various balance sheet items (as a percent of initial assets) against changes in C&I loans. For liabilities, this regression coefficient is plotted, reflecting how much that funding source increased for each dollar increase in C&I. For assets, the sign of the coefficient is reversed when plotted to reflect the fact that declines in other assets can accommodate C&I draws. The sample runs from January 7, 2015 to December 25, 2019. Each bar decomposes the response for a particular category of bank. The largest margins of adjustment for small banks were to cash (+43.6%), core deposits (+31.4%), borrowings (+22.9%), and core loans besides C&I (-15.8%). The largest adjustments for midsized banks were to core deposits (+96.1%), core loans besides C&I (-38.6%), borrowings (+34.7%), and cash (+9.1%). The largest adjustments for large banks were to cash (+45.1%), borrowings (+34.5%), core deposits (+28.4%) and other assets (+13.8%). The largest adjustments for foreign branches were to net due to (+61.1%), cash (+32.6%), borrowings (+9.6%) and core deposits (-8.1%).
Source: FR 2644.
Although the magnitude of the changes were substantially different, the findings are fairly similar: domestic banks increased deposits and non-deposit borrowings in weeks where C&I loans increased, while foreign banks predominantly increased the amount due to related institutions. Despite these broad similarities, some differences stick out. During normal times, deposits moved almost 1-for-1 with C&I for midsized banks, with large banks experiencing smaller deposit inflows. This reversed in the COVID-19 period, with large banks experiencing comparatively larger deposit inflows associated with C&I draws. Furthermore, unlike in normal times when large banks and foreign banks reduced cash in the face of C&I loan increases, during the COVID-19 period episode, they increased cash. As these banks experienced the largest draws during the COVID-19 period, they might have been less willing to reduce liquid assets in case draws continued to remain elevated in the future.
Conclusion
Our analysis shows that while deposits rose in banks experiencing C&I draws, often this was not enough to fund the dramatic increase in C&I loans in March. Domestic banks made up for this shortfall by increasing non-deposit borrowing and, in the case of smaller banks, by also reducing liquid assets.
Our analysis sheds light on how banks funded loans upon the time of draws, however the longer run funding mix is likely to differ. The immediate effect of the draws is to reduce capital ratios, and for smaller banks to deplete the stock of liquid assets. Even though banks entered the COVID-19 period with strong capital and liquidity positions, these developments likely put capital and liquidity pressures on the banking sector. If banks are not comfortable with their new balance sheet composition, and equity issuance is prohibitively costly, they might reduce new lending in order to rebuild capital and liquidity. Thus, although banks had limited ability to reduce loans to immediately fund draws during the COVID-19 episode, the large credit line draws could still crowd out other lending in the longer term.
This threat of credit line draws having an adverse effect on credit supply going forward highlights the importance of recent Federal Reserve actions to support the flow of credit to firms and households. Indeed, recent policies have supported banks' abilities to borrow (e.g. discount window modifications and Money Market Mutual Fund Liquidity facility), eased capital constraints (e.g. modifications to the Supplemental Leverage Ratio and guidance on use of capital buffers) and directly facilitated lending (e.g. Main Street Lending Program and Paycheck Protection Program Liquidity Facility). With banks facing the combined effects of C&I draws expanding balance sheets and expected loan losses pushing down equity, these policies play a key role in ensuring that businesses and households continue to have access to bank credit, thus limiting the financial and economic disruptions created by the coronavirus pandemic.
1. We thank Rochelle Edge and Rebecca Zarutskie for helpful comments. Return to text
2. Using Call Reports data on banks' leverage ratios in the fourth quarter of 2019, we estimate that the four weeks of C&I draws discussed in this note decreased Tier 1 capital ratios at large banks by between a quarter and a half percentage point. Return to text
3. These data were obtained through a confidential survey of depository institutions that requires confidential treatment of institution-level data and any information that identifies the individual institutions that reported the data. Return to text
4. While changes in C&I loans generally reflect a combination of draws of existing lines of credit, new loan originations, and paybacks of existing loans, given the evidence of large drawdowns in March, in this note we will use the terms "drawdowns" and "increases in C&I loans" interchangeably. Return to text
5. The Payroll Protection Program, which started on April 3, also resulted in significant increases in C&I loans. However, unlike the draws in March, these increases in loans were predictable, under a bank's control, and able to be fully financed through one of the Federal Reserve's liquidity facilities, making their effects on banks' balance sheets not comparable to those of the March credit line drawdowns. Return to text
6. Banks above $10 billion in assets are subject to the Durbin amendment and CFPB examinations, while banks above $100 billion are subject to CCAR and the LCR requirement. Return to text
7. Observations are dropped when domestic banks have a weekly decrease in C&I outstanding that is more than 2 percent of assets or an increase that is more than 3 percent of assets. Foreign banks have more volatile changes, so we use cut-offs of 5 percent declines and 15 percent growth. This censoring results in the loss of less than 1 percent of domestic observations and less than 2 percent of foreign observations. Return to text
8. More formally, let a bank's balance sheet consist of a set of assets $$A$$, which are funded by a set of liabilities $$L$$, and equity $$E$$. If $$\beta_x$$ is the coefficient from regressing a change in balance sheet item $$X$$, $$\Delta{X_{b,t}}/{Assets}_b$$, on the change in C&I loans, $$\Delta {C\&I_{b,t}}/{Assets}_b$$, then we get the following identity: $$1=\beta_E + \sum_{j \in L} \beta_j -\sum_{i \in A\backslash{C\&I}}^N \beta_i$$. Banks have limited ability to adjust equity on a weekly time horizon, so we find $$\beta_E \approx 0$$ and only display coefficients for assets and liabilities. Return to text
9. From Figure 2, we know that most of the aggregate increase in borrowing from related institutions came in the last two weeks of the sample, following coordinated central bank actions in mid-March to enhance standing U.S. dollar swap lines. This timing highlights the potential importance of recent central bank actions in providing access to dollar liquidity. Return to text
Glancy, David, Max Gross, and Felicia Ionescu (2020). "How Did Banks Fund C&I Drawdowns at the Onset of the COVID-19 Crisis?," FEDS Notes. Washington: Board of Governors of the Federal Reserve System, July 31, 2020, https://doi.org/10.17016/2380-7172.2601.
Disclaimer: FEDS Notes are articles in which Board staff offer their own views and present analysis on a range of topics in economics and finance. These articles are shorter and less technically oriented than FEDS Working Papers and IFDP papers.