FEDS Notes
May 01, 2020
How Much Does Home Equity Extraction Matter for Spending?1
Aditya Aladangady and Kelsey O'Flaherty
In this note, we investigate recent trends in home equity extraction and how these trends may have impacted household spending and residential improvements. Home equity extractions—which rose and fell with house prices in the 1990s and 2000s—have remained sluggish in the recovery despite low interest rates and gains in home equity. Compared to the mid-2000s, equity extractions have fallen especially among younger households and those with lower credit scores and higher leverage, suggesting that mortgage credit supply is likely tighter than before the recession, at least for portions of the population.
We find that the recent trend in equity extraction may have dampened spending, although the quantitative impact appears fairly small in the aggregate. Households spend the bulk of extracted equity to finance home improvements and repairs, though a portion is used on non-housing expenditures or to pay down other debts. In a simple exercise, we estimate that the lower rate of equity extraction lowered annual aggregate spending by about $45 billion (about $8 billion of which is non-housing consumption) relative to a counterfactual where equity extraction and spending followed pre-recession patterns. Our estimate may be a lower bound if spending responses are slow or in categories outside what we measure. This increase in spending would have come at the cost of raising household leverage and debt servicing costs, leaving households more exposed to economic downturns.
Recent trends in equity extraction
Through the 1990s and 2000s, home equity extractions rose and fell with fluctuations in available home equity through the housing boom and bust (see Figure 1). Since the recession, extractions have remained muted despite increases in available equity and low interest rates.2
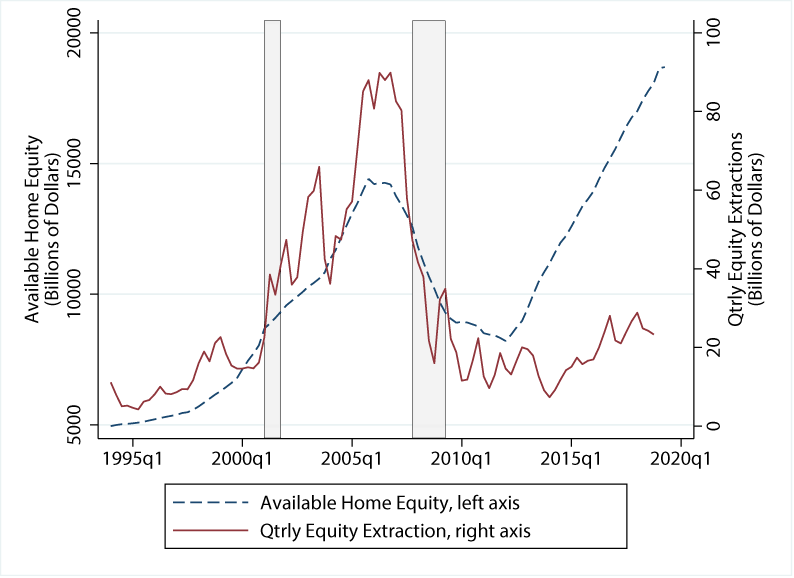
Source: Freddie Mac and Financial Accounts of the US.
The shaded bars indicate periods of business recession as defined by the National Bureau of Economic Research.
There are several reasons why cash-out refinancing behavior may have changed. One possibility is that households are wary of extracting equity from their homes given the large house price declines suffered during the housing bust. Put differently, households may want a larger financial buffer to protect them against such downturns, leading them to demand less credit or save more of their earnings. Another possibility is that households would spend out of their increased housing wealth, but are unable to secure credit against their homes to finance this spending. This inability to extract equity from homes would make housing less liquid, dampening any housing wealth effect that existed prior to the recession.3 We explore these possibilities using household-level micro-data from both the Panel Study of Income Dynamics (PSID)—a nationally representative survey that has tracked income, assets, consumption, and other information about several thousand families over time—and the Equifax/FRBNY Consumer Credit Panel (CCP)—an administrative data set of credit histories since 1999.4
Certainly part of the reason for lower equity extraction is that home ownership rates have fallen from around 69 percent immediately before the recession to 65.1 percent in the fourth quarter of 2019, with a more marked drop among young households (Paciorek, 2016; Dettling & Hsu, 2018). Figure 2 shows that, although ownership rates are lower (top left panel), the primary driver of the decline in extractions appears to be that fewer of those homeowners are extracting any equity at all (top right panel). The decline in the propensity to extract equity is somewhat larger among young and middle-aged homeowners who tend to have the majority of their wealth tied up in illiquid housing and may rely on extractions more, though there has been a broad-based decline at all ages. However, those households that are extracting equity in the recovery appear to be extracting a similar amount of available equity as those cashing out of their homes before the recession (bottom left panel), suggesting that the decline in aggregate extractions is primarily driven by the extensive margin.
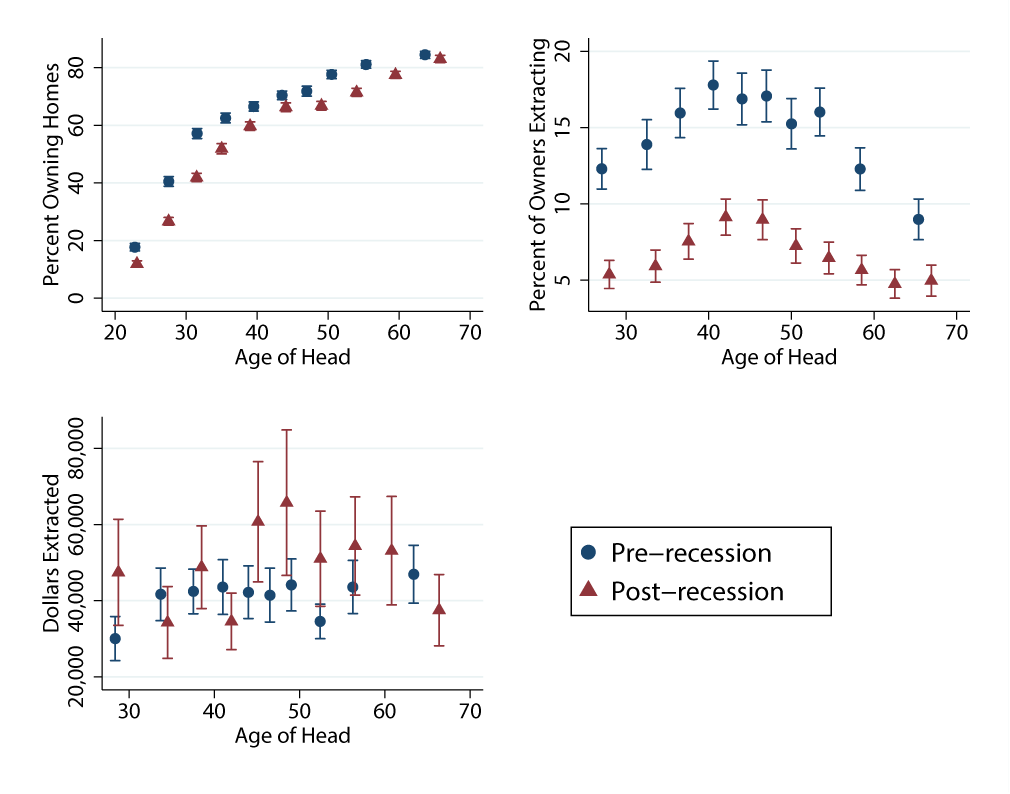
Source: PSID. Note: Pre-recession includes biennial PSID waves from 1999 through 2007. Post-recession includes waves from 2009 to 2017.
How much of the decline in extractions can be explained by the composition of households who have available equity? The left panel of Figure 3 shows that households with little equity did not engage in equity extractions in either period. In contrast, households with higher levels of available equity are engaging in fewer extractions now compared to households with similar amounts of equity prior to the recession. Importantly, the decline in extractions cannot be explained by a handful of households holding all the equity. As the right panel of Figure 3 shows, the distribution of home equity today is similar to what it was in years prior to the recession.
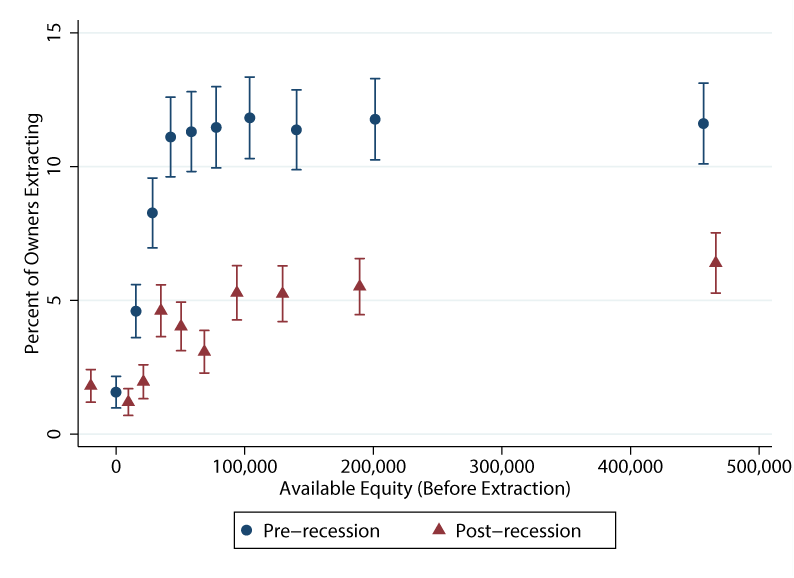
Source: PSID and Distributional Financial Accounts. Note: Available equity is defined just prior to time of extraction, and each hash plots mean for a decile of available equity among homeowners. Home equity in the Distributional Financial Accounts as the value of real estate less home mortgages.
The shaded bars indicate periods of business recession as defined by the National Bureau of Economic Research.
Leverage and credit scores are important determinants of household credit that may help further distinguish the extent to which credit supply and demand factors are at play. The left panel of Figure 4 shows the average propensity to extract equity for homeowners in waves before and after the recession, splitting households by deciles of loan-to-value ratios (LTVs).5 The likelihood of extraction had a hump-shaped relation with LTV before the recession. This is consistent with the idea that households with very high LTVs may have high demand for credit but are unable to secure additional credit against their homes without incurring high costs.6 Those with very low LTVs had chosen not to extract their ample available equity, suggesting low credit demand households have selected into lower LTVs. Households with LTVs near 0.5-0.6 had the highest propensity to extract, as they had enough equity to secure a loan and were more likely to demand credit than very low LTV households. These middle LTV households also saw the largest drop in the propensity to extract as the hump-shaped pattern across LTVs flattened out in the post-recession period.7
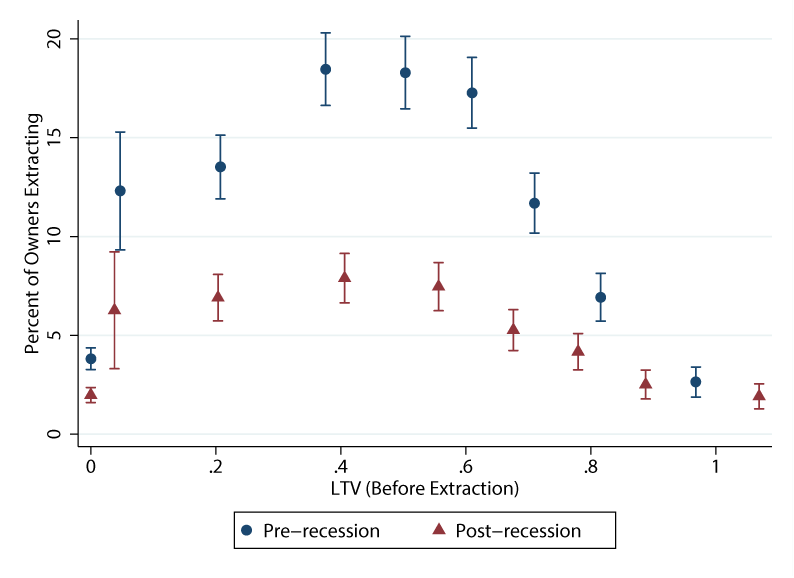
Source: PSID and Federal Reserve Bank of New York/Equifax Consumer Credit Panel. Note: Chart shows percent of owners extracting equity by bins of household combined loan-to-value ratios. The dollars extracted by those choosing to extract are broadly similar across bins (not shown).
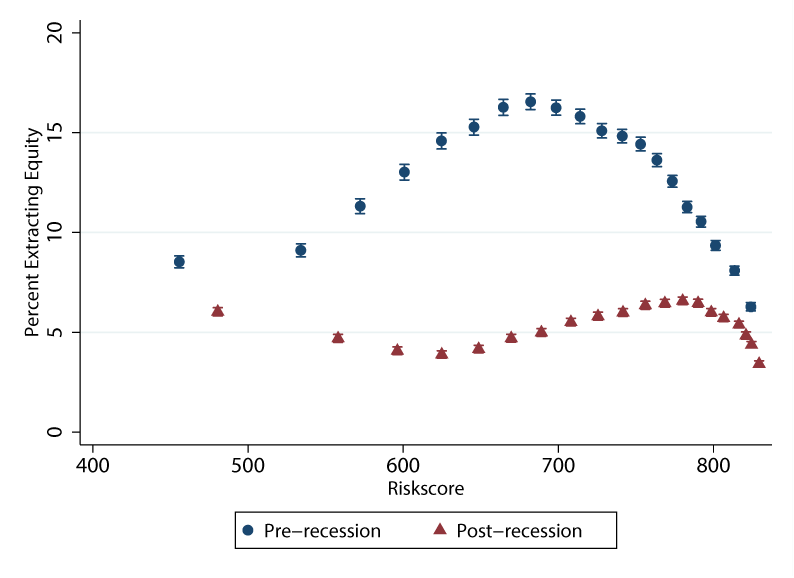
One reason for lower extractions among households with LTV's between 0.5 and 0.6 may be that they are unable to secure financing due to more stringent credit standards today. Alternately, it is possible that these households were eager to borrow previously, but are more wary of taking on debt now. To better address this ambiguity, we turn to administrative credit records from the Equifax Consumer Credit Panel (CCP), which allow us to divide households by credit score. Credit scores are an important metric considered by lenders when supplying credit and less likely to be correlated with credit demand factors than leverage, which is a product of prior decisions by the household.
The right panel of Figure 4 shows equity extraction and dollars extracted in the CCP by credit score.8 Equity extractions rose significantly in the housing boom, driven in large part by extractions from households with credit scores between 600 and 700, though those with higher credit scores also accounted for a large dollar value of extractions (not shown here). This is consistent with the idea that very high score households may not need this form of credit, and very low score households may be unable to extract very much equity (if at all). Notably, the decline in extractions—while prominent across groups in the middle of the credit score distribution—is sharpest for those with scores between 600 and 700.9
The fact that the decline in equity extraction is more pronounced among low credit score borrowers and households with moderate levels of leverage may indicate that limited credit supply is partly to blame. Indeed, mortgage originations more generally have been tight outside of the conforming loan market, with FHA and VA loans only partly offsetting the decline in private-label MBS funding. Furthermore, survey evidence from the Survey of Consumer Expectations (SCE) supports the fact that households today are seeking mortgage credit, though not all are able to acquire it. Figure 5 below shows the fraction of households in each credit score bin reporting that they refinanced their mortgage, were rejected when they applied, or were discouraged from applying at all because they did not think they would be accepted. Households with low credit scores have higher rejection rates and a higher fraction of "discouraged" credit seekers, but also the highest overall fraction of households seeking credit. Because the SCE began only after the recession, we cannot compare the number of credit seekers to years before the recession. While it is possible that households may be somewhat pessimistic about their housing wealth gains in the recovery given large declines in home values suffered during the recession, tight credit supply does appear to be constraining households with weaker credit scores and balance sheets.
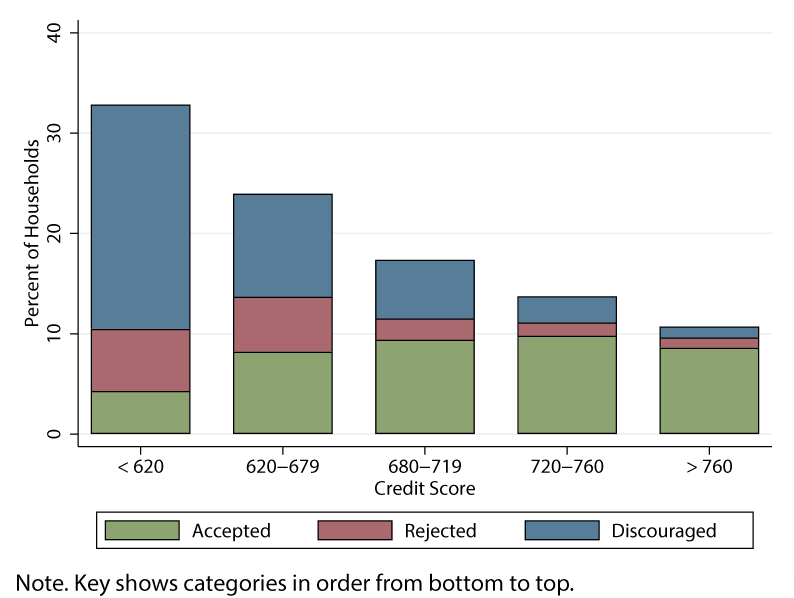
Source: Federal Reserve Bank of New York, Survey of Consumer Expectations. Note: Discouraged defined as those responding yes to "During the last twelve months, did you need [to refinance your mortgage] but did NOT apply for it because you thought you would not get approved?"
Quantifying the impact of equity extractions on aggregate spending
If home equity extraction behavior continued as it did prior to the recession, how many more extractions would we see today? To answer this question, we turn to a large sample of individual credit records from the CCP. Because we use micro-data, our estimates can address household-level and local heterogeneity such as the potential that home equity may have accrued disproportionately to types of households that are otherwise less likely to extract equity. We use a specification similar to Bhutta & Keys (2016) and allow extraction to be driven by a combination of interest rates, local house price growth, their interaction, and local labor market conditions.10 Using estimates from data through 2011, we construct a prediction of what equity extraction would have looked like in the subsequent years had the relationship between these variables remained unchanged. Figure 6 plots this prediction (red dashed) against actual extractions (blue).
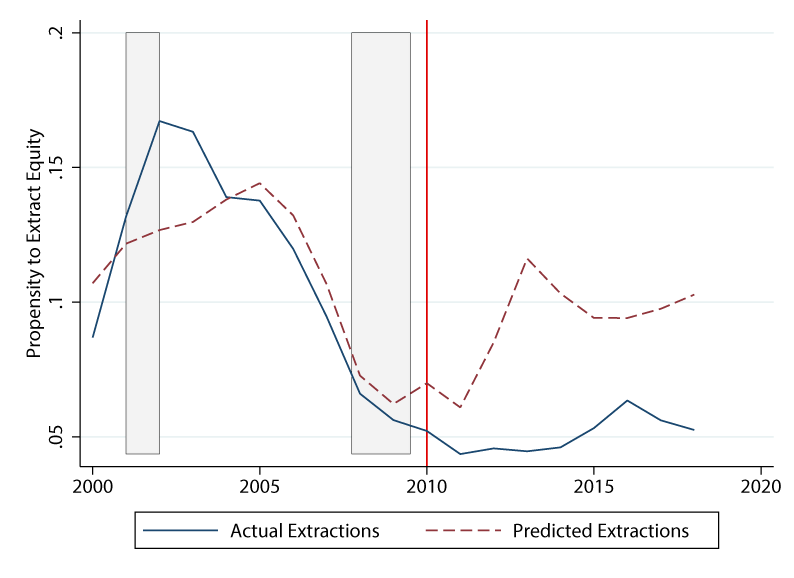
Source: Federal Reserve Bank of New York/Equifax Consumer Credit Panel and authors' calculations.
The shaded bars indicate periods of business recession as defined by the National Bureau of Economic Research.
As seen in the red dashed line, the estimated model predicts equity extraction would be just below pre-recession levels at roughly 10 percent of homeowners (red line), whereas extractions have remained closer to a 5 percent annual rate (blue line). If credit supply and consumer behavior reverted to what they were in the early 2000's, we would expect to see about 4.2 million more extractions per year given the current number of homeowners.11
To quantify the potential impact this would have on aggregate spending, we return to household-level data from the PSID, where we can look directly at how a household's spending changes when it chooses to extract equity from its home. Specifically, we run a series of simple regressions of various self-reported spending and saving measures on equity extraction, controlling for demographic and financial characteristics of the household, as well as year and household fixed effects.12 Results displayed in Figure 7 show that overall spending in measured categories (including spending on housing) rises by a little over $10 thousand in the interview following an equity extraction (red bar). Much of this effect is accounted for by home improvements, home maintenance, and higher mortgage servicing costs, but non-housing categories (orange bar) appear to rise by a little less than $2,000 on average, driven by increases in categories such as clothing, furniture, and education (bottom panel).13 Nonetheless, the overall magnitude of the estimated response appears rather small compared to the average extraction, which is between $40k to 50k.
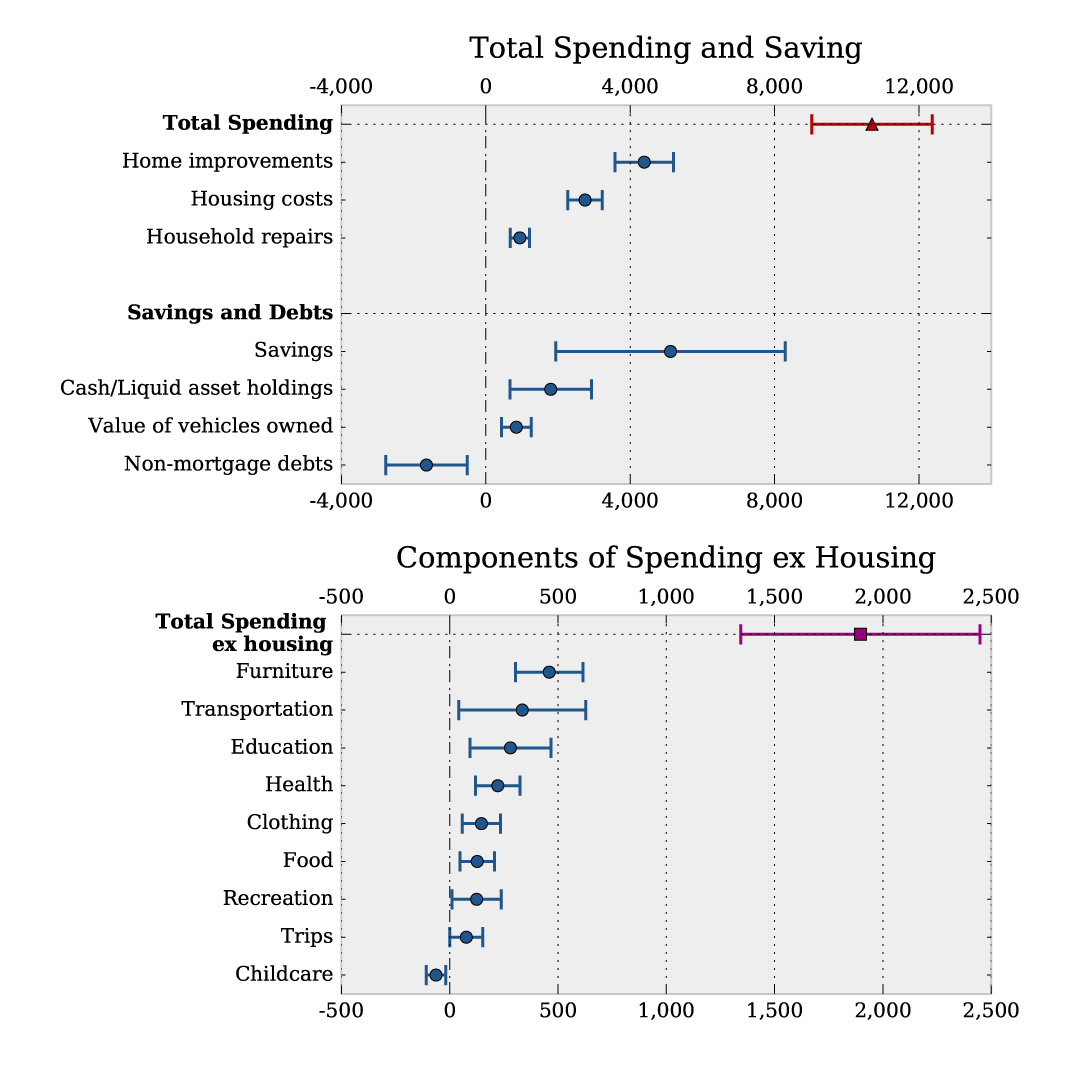
Source: PSID and authors' calculations. Note: Estimates are effects on spending/savings in wave following extraction. Error bars denote 90 percent confidence bands using standard errors clustered by household. Spending includes all categories in survey starting in 2005. Estimated responses for categories beginning in 1999 are similar.
Partly, this is accounted for by the fact that not all spending may be immediate, and some may occur after the household is surveyed. This can be seen by the fact that holdings of cash and deposit accounts rises significantly in the survey following an extraction (bottom half of top panel). Interestingly, the amount of non-mortgage debt holdings reported by households—which includes credit card, student loans, medical/legal loans, and other consumer debts—also falls significantly following equity extractions, suggesting households may have used a portion of the money to pay down other more expensive liabilities.14 These facts—in addition to the fact that measurement error in our metric for equity extractions and spending possibly attenuates estimates—may help account for the remainder of the money extracted.
Our results do not necessarily imply that equity extraction causes consumption to rise, but simply that households use equity extraction as a means to finance spending both on investments in their home and on consumption goods and services. A combination of factors such as limited credit supply or diminished desire to spend may be depressing both consumption and equity extraction during the recovery. If these factors were to recede, our prior estimates suggested there would be roughly 4.2 million more extractions each year resulting in about $44.5 billion in overall spending. About $7.9 billion of this increase would be in non-housing consumer spending components, with the remainder going to residential improvements and mortgage servicing costs.15
All told, this is a fairly small increase in aggregate spending—raising the level of GDP by about 0.2 percentage points–though effects could be relatively large for the small number of households who actually would have extracted equity if they were able. If our estimates are a lower bound, and remaining extracted equity is spent later on, the effects could be as large as 0.4 or 0.5 percentage points higher GDP, though the effect on GDP growth would be spread out over several years. Such an increase in cash-out refinancing and spending could also come at a cost to financial stability. In particular, household balance sheets today appear relatively strong compared to what they did prior to the recession meaning households are better equipped to weather shocks such as a decline in asset prices or increase in unemployment (Bhutta, et al, 2018). Increased equity extraction would also lead to household leverage and debt servicing costs, leaving households more exposed to economic downturns.
Citations
Aladangady, Aditya. 2017. "Housing Wealth and Consumption: Evidence from Geographically-Linked Microdata." American Economic Review 107: 3415-46. doi:10.1257/aer.20150491.
Aladangady, and Laura Feiveson. 2018. "A Not-So-Great Recovery in Consumption: What is holding back household spending?" FEDS Notes. doi: https://doi.org/10.17016/2380-7172.2159.
Andreski, Patricia, Geng Li, Mehmet Zahid Samancioglu, and Robert Schoeni. 2014. "Estimates of Annual Consumption Expenditures and Its Major Components in the PSID in Comparison to the CE." American Economic Review 104: 132-35. doi:10.1257/aer.104.5.132.
Bhutta, Jesse Bricker Lisa Dettling Jimmy Kelliher, and Steven Laufer. 2018. "Stress Testing Household Debt." Finance and Economics Discussion Series, Board of Governors of the Federal Reserve System. doi:https://doi.org/10.17016/FEDS.2019.008.
Bhutta, Neil, and Benjamin J. Keys. 2016. "Interest Rates and Equity Extraction During the Housing Boom." The American Economic Review (American Economic Association) 106: 1742-1774. http://www.jstor.org/stable/43861111.
Bianchi, Francesco, Martin Lettau, and Sydney C. Ludvigson. 2016. "Monetary Policy and Asset Valuation." Working Paper, National Bureau of Economic Research. doi:10.3386/w22572.
Cooper, Daniel. 2013. "HOUSE PRICE FLUCTUATIONS: THE ROLE OF HOUSING WEALTH AS BORROWING COLLATERAL." The Review of Economics and Statistics (The MIT Press) 95: 1183-1197. http://www.jstor.org/stable/43554821.
Dettling, Lisa J., and Joanne W. Hsu. 2018. "Returning to the nest: Debt and parental co-residence among young adults." Labour Economics 54: 225-236. doi:https://doi.org/10.1016/j.labeco.2017.12.006.
Federal Reserve Bank of New York/Equifax Consumer Credit Panel
Federal Reserve Bank of New York. Survey of Consumer Expectations, http://www.newyorkfed.org/microeconomics/sce/#main.
Fuster, Eilidh Geddes, and Andrew F. Haughwout. 2017. "Houses as ATMs No Longer." Federal Reserve Bank of New York Liberty Street Economics (blog). http://libertystreeteconomics.newyorkfed.org/2017/02/houses-as-atms-no-longer.html.
Hurst, Erik, and Frank Stafford. 2004. "Home Is Where the Equity Is: Mortgage Refinancing and Household Consumption." Journal of Money, Credit and Banking ([Wiley, Ohio State University Press]) 36: 985-1014. http://www.jstor.org/stable/3839098.
Lovenheim, Michael F. 2011. "The Effect of Liquid Housing Wealth on College Enrollment." Journal of Labor Economics 29: 741-771. doi:10.1086/660775.
Lovenheim, Michael F., and C. Lockwood-Reynolds. 2013. "The Effect of Housing Wealth on College Choice: Evidence from the Housing Boom." Journal of Human Resources 48: 1-35. doi:10.3368/jhr.48.1.1.
McCully, Brett, Karen M. Pence, and Daniel J. Vine. 2015. "How Much Are Car Purchases Driven by Home Equity Withdrawal?" Finance and Economics Discussion Series, Board of Governors of the Federal Reserve System (US). doi:10.17016/FEDS.2015.106r1.
Paciorek, Andrew. 2016. "The Long and the Short of Household Formation." Real Estate Economics 44: 7-40. doi:10.1111/1540-6229.12085.
Panel Study of Income Dynamics, public use dataset. Produced and distributed by the Institute for Social Research, University of Michigan, Ann Arbor, MI (downloaded 2018)
Pistaferri, Luigi. 2016. "Why Has Consumption Remained Moderate after the Great Recession?" unpublished. https://web.stanford.edu/ pista/slow_cons_oct23.pdf.
1. We thank Paul Lengermann, Daniel Cooper, Andrew Paciorek, Neil Bhutta, Dan Vine, and Daniel Garcia for their help and comments. Return to text
2. Fuster et al (2017) also document this pattern using CRISM data. Return to text
3. One reason house prices can affect consumption is the ability to finance that consumption by extracting equity (Aladangady, 2017; Bhutta & Keys, 2016; Cooper, 2013; Hurst & Stafford, 2004). Return to text
4. In both data sets, we define equity extractions as any new mortgage origination on the same home that results in a higher mortgage balance. In particular, we follow Bhutta and Keys (2016), and define cash-out refinance in both the PSID and CCP as an observation where a homeowner did not move homes, but reports a new mortgage with a balance at least $5000 higher than the previous wave. The amount extracted is the actual change in the balance during a cash-out refinance. In all regressions using the CCP, we exclude individuals that are likely real estate investors, defined as observations for which we observe multiple mortgages each with large balance, multiple HELOCs, or HELOCs larger than closed-end accounts, which is identical to the sample restriction used by Bhutta & Keys (2016). Return to text
5. Loan-to-value is defined as mortgage balance (prior to any extractions) divided by self-reported home value. All variables are based on self-reports by households in the PSID and are subject to measurement error. Results are similar if market-based home values are used to compute LTVs. Return to text
6. For example, households with LTVs above 0.8 may be required to pay private mortgage insurance. We see extraction rates decline rapidly at LTVs of 0.8, with little change between the two periods for households above this threshold. Return to text
7. We reach a similar conclusion when looking at Debt-to-Income ratios (not shown here). Households paying a larger fraction of income on debt service payments had higher propensities to extract equity prior to the recession, but this relationship is significantly diminished now. The decline in extractions among high-DTI households may reflect more stringent Ability-to-Repay requirements contracting credit supply, but may also reflect a diminished desire to take on leverage. Return to text
8. Credit scores are Vantage scores provided by Equifax. Return to text
9. In dollar terms, households with very high credit scores account for the bulk of extractions in the recovery period, but the hump-shape near scores of 600-700 remains present. Return to text
10. Labor market conditions are captured by county wage growth, employment growth, and unemployment rate from QCEW and LAUS/BLS. We also include an age polynomial and credit risk score polynomial. Return to text
11. The American Community Survey estimates there are 128.6 million households in the US in 2019. The Housing and Vacancy Survey estimates a homeownership rate of 65.1 percent, suggesting approximately 83.7 million homeowner households. If 5 percent more homeowners extracted equity, this would amount to about 4.2 million extractions. Return to text
12. We regress real spending on a dummy for cash-out refinance since the last wave, controlling for age, family size, income, other wealth, home ownership status, recent moves, and household and year fixed effects. Allowing response to vary by extraction size yields similar results for the mean extraction. Results are robust to using different time periods and including local area controls. Return to text
13. Increases in education spending are consistent with results from (Lovenheim 2011, Lovenheim and Lockwood-Reynolds 2013) who show college attendance rises for children whose parents have home equity. Interestingly, households appeared to increase spending on automobiles following an equity extraction, although this response falls to zero in the years after the recession when auto lending has been relatively lax. This finding is broadly consistent with McCully, Pence, and Vine (2019), who find that households may use equity extractions to fund down payments on autos, though the effect they find is small in the aggregate. Return to text
14. Results using CCP data show similar reductions in non-mortgage debts. Return to text
15. Our back-of-the-envelope calculation assumes the increase in mortgage servicing costs is attributed to higher interest charges (on a larger balance), though extractions bundled with rate/term refinances may lead to lower interest costs. In such a case, our estimated effect would be roughly $16 billion lower. We further assume that components of spending not measured in the PSID do not respond systematically to extractions. This assumption is reasonable given PSID spending categories cover the majority of household spending covered by PCE (Andreski et al, 2014). Return to text
Aladangady, Aditya, and Kelsey O'Flaherty (2020). "How Much Does Home Equity Extraction Matter for Spending?," FEDS Notes. Washington: Board of Governors of the Federal Reserve System, May 01, 2020, https://doi.org/10.17016/2380-7172.2535.
Disclaimer: FEDS Notes are articles in which Board staff offer their own views and present analysis on a range of topics in economics and finance. These articles are shorter and less technically oriented than FEDS Working Papers and IFDP papers.