FEDS Notes
May 11, 2020
Real Effects of Uncertainty: Evidence from Brexit
Introduction
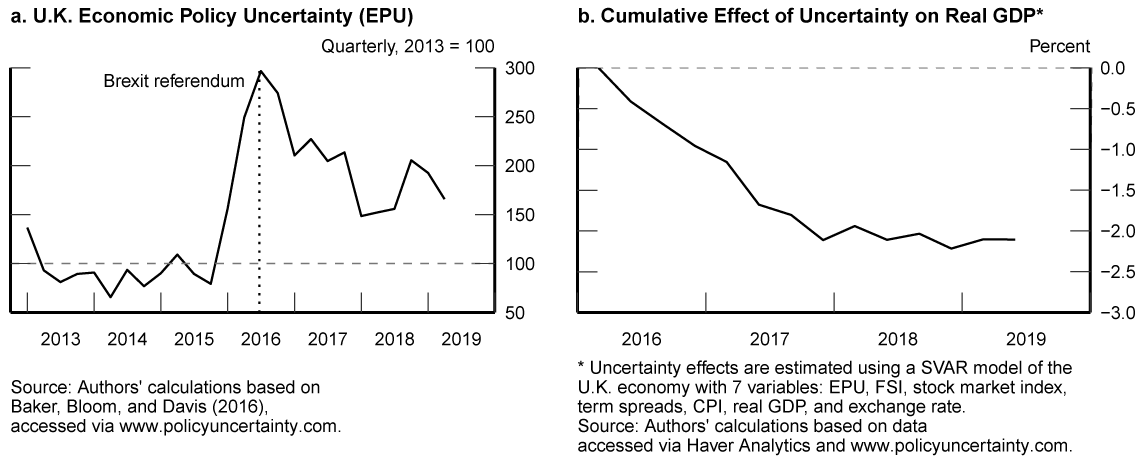
In the historic Brexit referendum on June 23, 2016, U.K. citizens voted in favor of leaving the European Union (EU), a result that created substantial uncertainty regarding the future economic relationship between the United Kingdom and the EU. As can be seen in Figure 1, uncertainty, measured by the Economic and Policy Uncertainty (EPU) index of Baker et al. (2016), spiked around the Brexit referendum date and has remained elevated relative to its pre-referendum level since then. Although the United Kingdom remained a member of the EU until January 31 2020, U.K. economic activity has slowed substantially since the referendum. This makes the Brexit episode an opportunity for an interesting case study of how shifting expectations and increased and persistent uncertainty about the future course of policy can affect an economy even before the actual change in policy occurs.
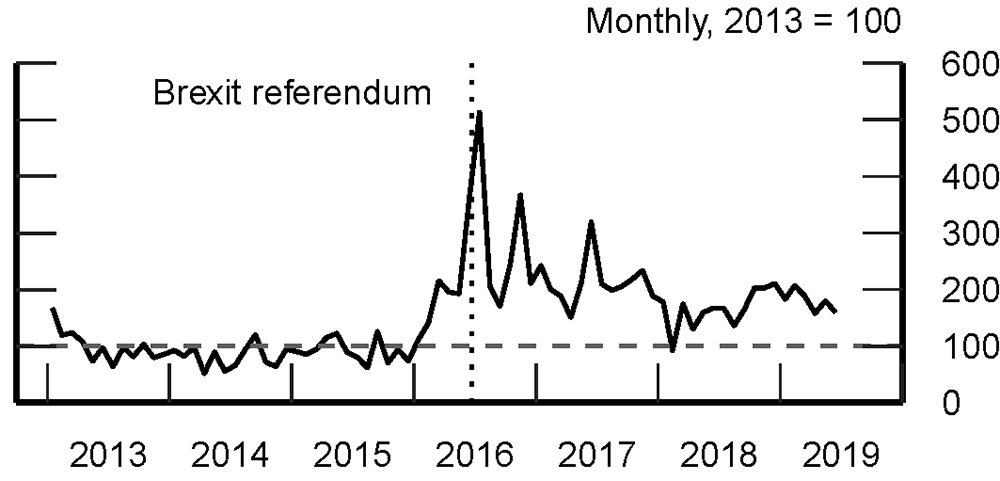
Source: Authors' calculations based on Baker, Bloom, and Davis (2016), accessed via www.policyuncertainty.com.
In this note, we analyze the effects of uncertainty on U.K. macroeconomic variables and also look at the differential impact on U.K. industries. First, we provide an overall assessment of the U.K. economy over the last three years. Second, we use econometric methods to study the effects of increased uncertainty on U.K. GDP. Finally, we use industry-level data to analyze the relationship between investment and employment growth across U.K. industries and their exposure to the EU. EU exposure is measured either as the share of the volume of EU exports in the final demand of each industry or as the proportion of EU nationals in the workforce of each industry.
We document that U.K. GDP growth has slowed since the referendum and has also underperformed in comparison to other G7 countries. This slowdown can be mainly attributed to a slowdown in investment growth, while the decline in consumption growth has been more muted. We find that the rise in EPU since 2016 accounts for a decline in the level of U.K. GDP of about 2.1 percent over the three years following the referendum. Our industry-level analysis suggests a significant negative relationship between investment growth in U.K. industries and the export exposure of these industries to the EU, while the exposure through workforce appears to have had no significant impact on firms' investment decisions since the referendum. That said, industries with a higher pre-referendum proportion of EU nationals in their workforce reduced their employment growth the most.
Post-referendum economic slowdown
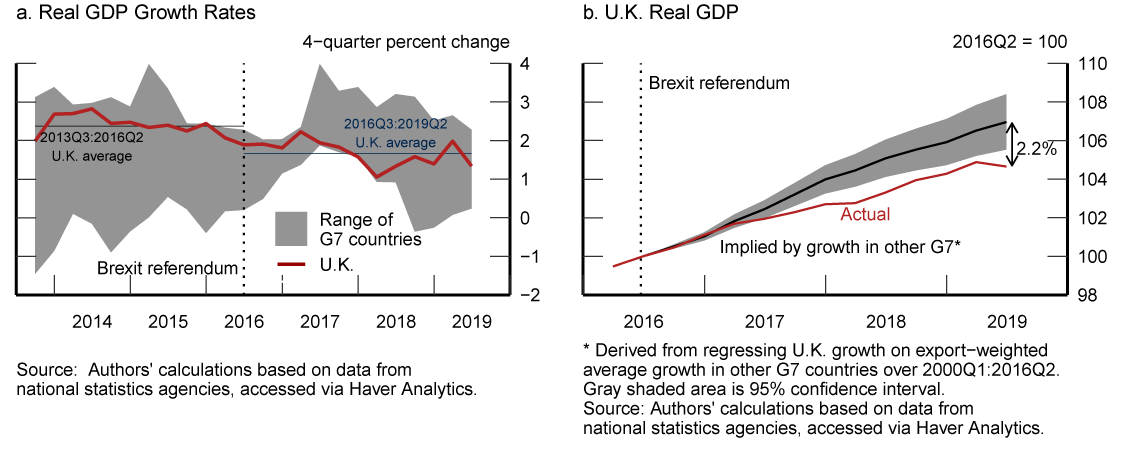
As can be seen in panel a of Figure 2, U.K. real GDP growth has slowed down somewhat (by around 0.7 percentage points at an annualized rate) between the 2016 vote and the first half of 2019, relative to the three-year period preceding the referendum. Moreover, U.K. growth was generally among the highest within the G7 countries in the years before the Brexit referendum, but has since fallen towards the bottom half of the G7 ranking. Panel b of Figure 2 shows that, had U.K. growth maintained its historical relationship with the other G7 countries, the level of U.K. real GDP would have been 2.2 percent higher as of mid-2019. One could interpret this difference as representing the GDP loss due to U.K.-specific factors since the referendum.
As discussed in Bloom (2014), among many other studies, greater uncertainty tends to decrease consumers' desire to spend and firms' willingness to hire and invest. The U.K. experience since the referendum has been consistent with this prediction, and GDP components show that U.K. investment has been hit especially hard. Quarterly business investment growth (at an annualized rate) since the referendum has been running about 5.4 percentage points lower on average than in the three years prior to the referendum (Figure 3, panel a), while the decline in private consumption growth has been much more muted at 1.2 percentage points. Because the fall in investment growth is large, it has contributed substantially to the overall GDP growth slowdown, despite business investment making up only around 10 percent of aggregate GDP (Figure 3, panel b). Note that the contribution of net exports to U.K. real GDP improved a bit during the same period, potentially helped by the sharp depreciation of the pound in the aftermath of the referendum.
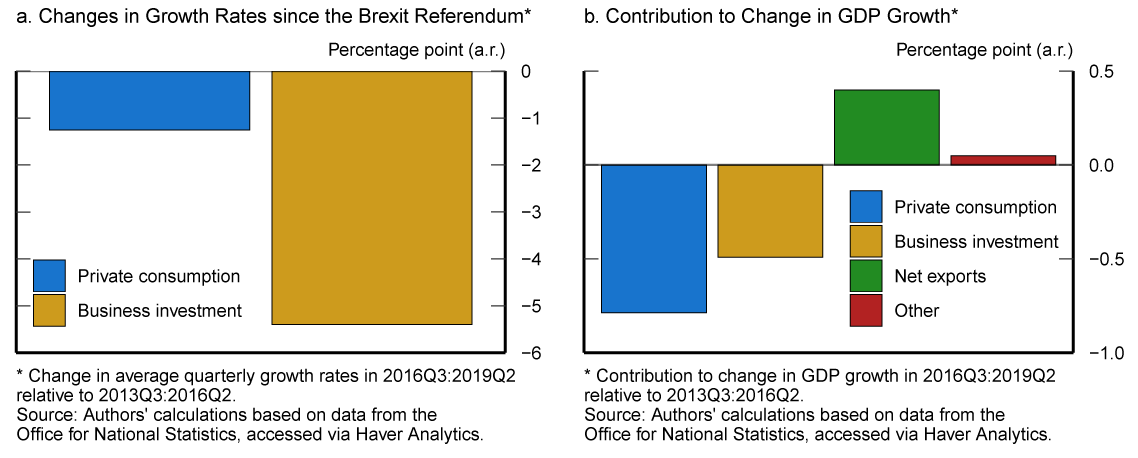
Keys identify categories in order from left to right.
The sharp slowdown in U.K. business investment growth occurred during a period when investment growth accelerated in peer economies, strengthening the case for the role of U.K.-specific factors, including Brexit-related uncertainty.2 As can be seen in Figure 4, U.K. investment outperformed investment in other G7 countries in the period preceding the referendum, but the gap has gradually closed since then, as U.K. business investment has stalled while investment growth has picked up in other G7 economies.
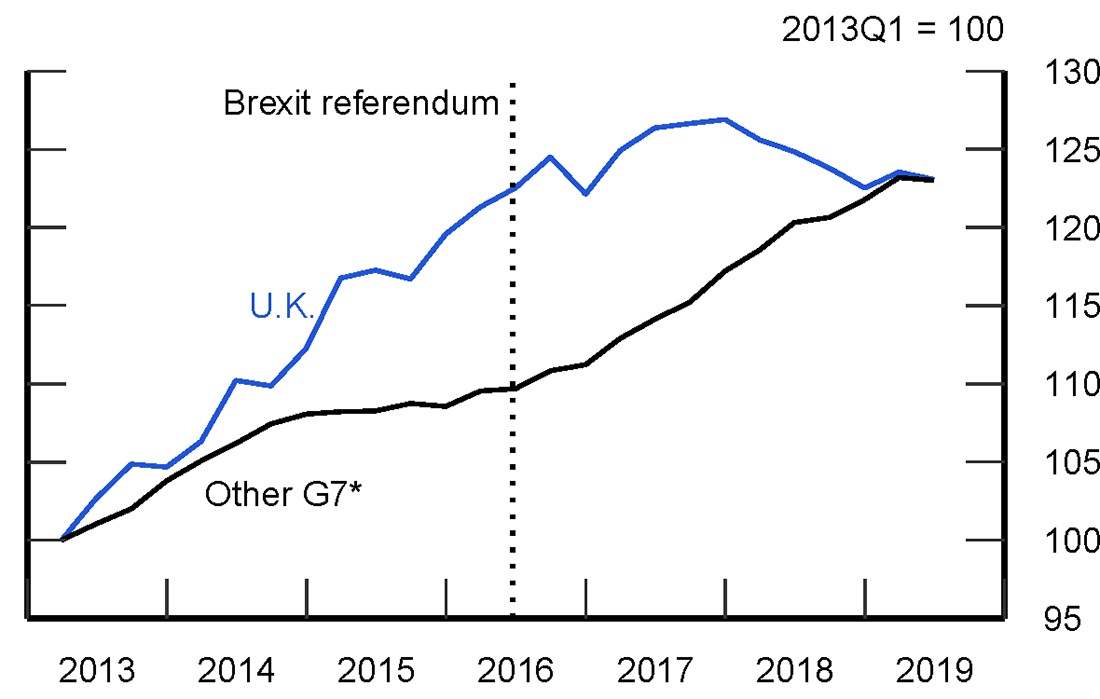
* Constructed from trade weighted average real investment growth in other G7. Source: Authors' calculations based on data from national statistics agencies, accessed via Haver Analytics.
Effects of uncertainty on GDP: A VAR Approach
To quantify the effects of uncertainty on U.K. economic activity, we estimate a vector auto-regression (VAR) model for the U.K. economy using quarterly data from 1986Q1 to 2019Q2. The model includes seven variables: EPU index, the U.K. financial stress index (FSI), term spreads (the difference between U.K. 10-year and 3-month yields), FTSE 100 stock market index, the quarterly growth rate of real U.K. GDP, U.K. CPI, and the U.K. nominal trade-weighted exchange rate. Additionally, the VAR includes four lags of the endogenous variables and a constant. We identify the uncertainty shock by imposing a Cholesky ordering with the EPU index ordered first. Consequently, the uncertainty shock can have contemporaneous effects on real and financial variables, while the EPU index reacts to other shocks only with one-quarter lag. Our identification strategy of uncertainty shocks, which allows a contemporaneous interaction between uncertainty, financial and real variables, can be interpreted as providing an upper bound on the real effects of such shocks.
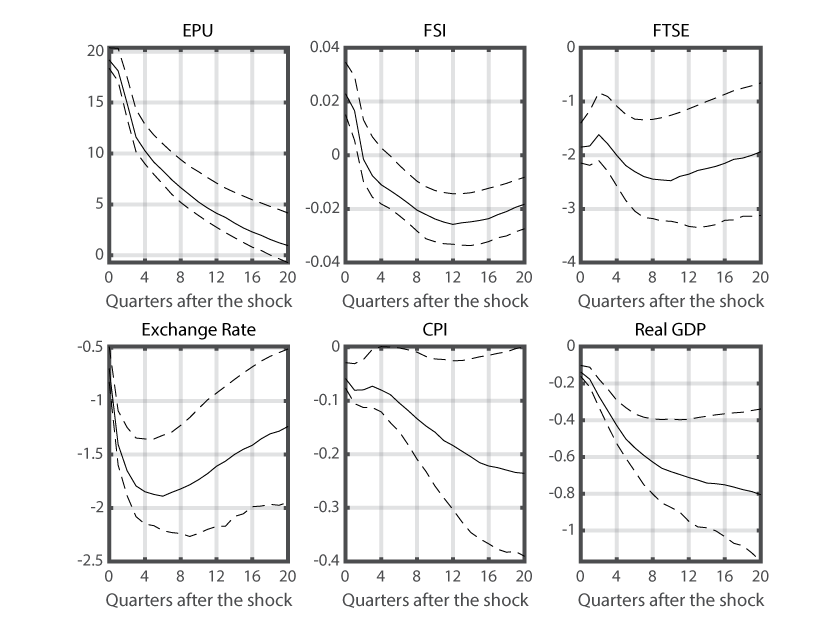
In Figure 5, we show the impulse responses to a one standard deviation shock to the U.K. EPU measure (dashed lines represent one standard deviation confidence interval). An increase in EPU leads to an increase in the financial stress index (tighter financial conditions) in the short run, a decline in the stock market index, and a depreciation of the pound on a trade-weighted basis. These channels lead to a decline in inflation and real GDP.
Figure 5. VAR Impulse Responses to an Increase in EPU3
Panel b of Figure 6 presents our estimate of the total effect of uncertainty (measured by the quarterly EPU index as shown in panel a) on the level of GDP since the Brexit referendum. According to these estimates, uncertainty appears to have subtracted 2.1 percent from U.K. GDP since the beginning of 2016.
Industry-level analysis: EU exposure and investment and employment growths
In this section, we focus on the effects of Brexit uncertainty on growth rates of investment and employment across U.K. industries. Using the DMP survey and company accounts from Bureau van Dijk, the Bank of England reports that average annual investment growth by U.K. firms that cited Brexit as one of the top three sources of uncertainty (high uncertainty firms) fell by about 2.8 percentage points since the Brexit referendum (Figure 7).4 In contrast, annual average investment growth remained roughly the same for low uncertainty firms---those citing Brexit uncertainty as "not important" or as "one of many sources."
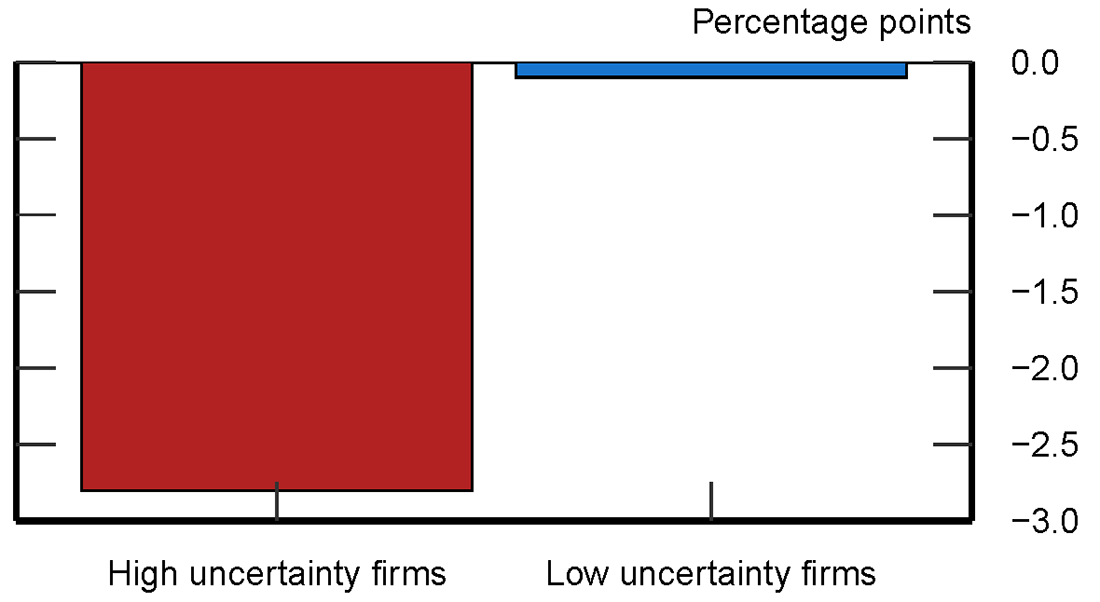
Note: The bars show the change in investment growth between 2011Q3:2016Q2 and 2016Q3:2019Q2. High uncertainty firms are the ones citing Brexit as one of the top three sources of uncertainty, low uncertainty firms are the ones citing Brexit uncertainty as "not important" or as "one of many sources" in the Decision Maker Panel Survey.
Source: Authors' calculations based on the Bank of England's November 2019 Monetary Policy Report.
Bloom et al. (2019a) report further evidence confirming that firms with higher levels of uncertainty have experienced significantly lower growth in investment since the 2016 vote, relative to the five-year period preceding the referendum, though they found no significant link between employment growth and level of uncertainty. In a related paper, Bloom et al. (2019b) show that firms with larger EU exposure, whether measured by the share of output exported to the EU or by the proportion of EU nationals in the workforce, were more likely to have reported Brexit as a top source of uncertainty. Given these findings, one would expect to observe disproportionate real effects across businesses based on their exposure to the EU because concerns about losing access to EU markets and migrants would be more relevant for high-exposure businesses. In this study, we use official U.K. industry-level data to test this prediction. We do so by studying the relationship between changes in employment and investment growth rates in a given industry since the Brexit referendum and the initial exposure of this industry to the EU (measured either as the share of EU exports in the final demand or as the proportion of EU nationals in the workforce).
We first construct a measure of export exposure of U.K. industries to the EU utilizing U.K. input-output tables.5 We then look at the correlation between this measure and changes in the industry-level real investment and employment growth rates.6 Let $$X_{EU,i}$$ be the volume of exports destined to the EU from industry $$i$$, and $$Y_i$$ be the total final demand for the output of this industry. We first construct direct EU export exposure of industry $$i\ (D_{EUexp,i})$$ as:
$$$$ D_{EUexp,i} = \frac{X_{EU,i}}{Y_i} \times 100.$$$$
To incorporate linkages through intermediate inputs into account, we then construct total EU export exposure of industry $$i\ (T_{EUexp,i})$$ as:
$$$$ T_{EUexp,i} = D_{EUexp,i} + \sum_j{ \frac{D_{EUexp,j} \times {INT}_{i,j}}{Y_i} \times 100 },$$$$
where $${INT}_{i,j}$$ is industry $$i$$'s output used as intermediate input by industry $$j$$, which has a direct EU export exposure of $$D_{EUexp,j}$$.
Panel a of Figure 8 summarizes the relationship between our measure of export exposure towards the EU (horizontal axis) and changes in quarterly investment growth since the referendum across industries (vertical axis). The correlation is negative and statistically significant at the 5 percent level, where the slope is estimated using a weighted OLS regression with weights proportional to final demand, which is indicated by the size of the circles. This suggests that industries with greater EU exposure through exports have seen slower investment growth in the post-referendum period, relative to the three-year period prior to the referendum. 7, 8
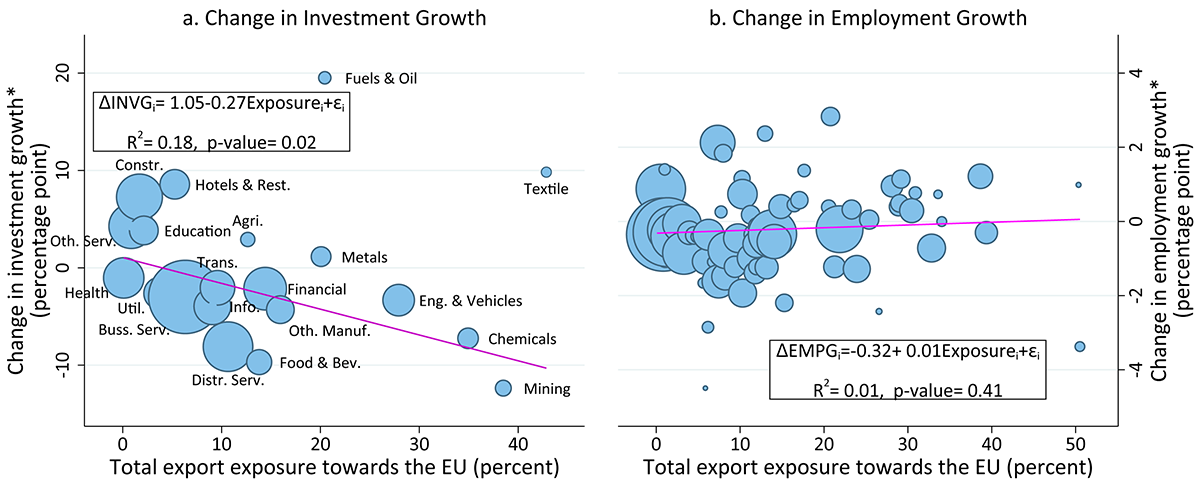
*Change in quarterly growth rate in 2016Q3:2019Q2 relative to 2013Q3:2016Q2. Weighted by final demand.
Source: Authors' calculations from industry-level Office for National Statistics data available at www.ons.gov.uk.
To put this negative relationship into a quantitative perspective, one percent of output exported to the EU before the referendum corresponds to a 0.27 percentage point slowdown in investment growth every quarter since the referendum. Of course, one should be cautious about interpreting this number as there might also be many other factors affecting investment decisions, including global demand conditions and asset prices. Furthermore, Brexit uncertainty might affect investment decisions through channels other than export exposure.
Despite the significant relationship between export exposure towards the EU and the change in investment growth, we found no link between export exposure and the change in employment growth (panel b of Figure 8), suggesting that industries with larger access to EU markets have not responded differently than less exposed industries when it comes to employment decisions.9 However, this does not necessarily mean that Brexit uncertainty, and related concerns over labor availability after Brexit, have not left any imprint on employment performances, which brings us to the next important possible channel of exposure: proportion of EU nationals in workforce.
Panel a of Figure 9 displays the negative and strong relationship since the Brexit referendum between the change in industry employment growth and EU exposure through the workforce, which is defined as the proportion of EU nationals in the workforce of an industry.10 Specifically, industries with a larger pre-referendum share of EU nationals in the workforce experienced a larger slowdown in their employment growth rates after the referendum.11 In contrast, when we consider the change in investment growth, the relationship becomes positive, but statistically insignificant, suggesting that firms' concerns over the post-Brexit labor market have not been a factor affecting their investment decisions (panel b of Figure 9).
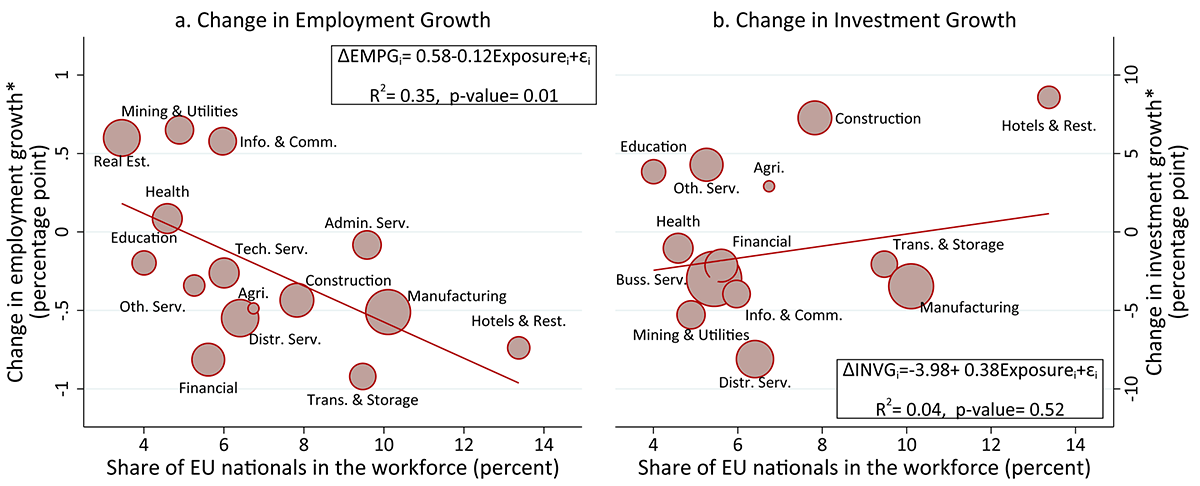
*Change in quarterly growth rate in 2016Q3:2019Q2 relatrive to 2013Q3:2016Q2. Weighted by final demand.
Source: Authors' calculations from industry-level Office for National Statistics data available at www.ons.gov.uk.
To conclude, we provided evidence that Brexit-related uncertainty has had disproportionate effects on investment and employment growth rates across industries based on their exposure to the EU, through either exports or the workforce. More specifically, we found that higher export exposure towards the EU was correlated with poor investment growth, whereas employment growth was affected by EU exposure through the workforce.
References
Baker, Scott R., Nicholas Bloom and Steven J. Davis, 2016. "Measuring Economic Policy Uncertainty," The Quarterly Journal of Economics, Oxford University Press, vol. 131(4), pages 1593-1636.
Bloom, Nicholas, 2014. "Fluctuations in Uncertainty," Journal of Economic Perspectives, 28, 153-176.
Bloom, Nicholas, Philip Bunn, Scarlet Chen, Paul Mizen, Pawel Smietanka, Gregory Thwaites and Garry Young, 2019a. "The Impact of Brexit on UK Firms," Bank of England Working Paper No. 818.
Bloom, Nicholas, Philip Bunn, Scarlet Chen, Paul Mizen, Pawel Smietanka and Gregory Thwaites, 2019b. "Brexit and Uncertainty: Insights from the Decision Maker Panel," Bank of England Working Paper No. 780.
1. Anna Lipinska ([email protected]) is a Principal Economist and Musa Orak ([email protected]) is a Senior Economist in the Division of International Finance of the Federal Reserve Board of Governors. The views expressed are solely the responsibility of the authors and should not be interpreted as reflecting the views of the Board of Governors of the Federal Reserve System or of any other person associated with the Federal Reserve System. Chazz Edington, Brynne Godfrey and Kaede Johnson provided excellent research for this note. Return to text
2. Using a new survey of U.K. firms, the Decision Maker Panel (DMP), and data from company accounts, Bloom et al. (2019a) estimate that Brexit uncertainty has reduced U.K. investment growth by 3.8 percentage point each year since the referendum. Return to text
3. Negative values in the lower left panel correspond to depreciation of the pound on a trade-weighted basis. Return to text
4. The DMP was launched in the aftermath of the Brexit referendum by the University of Nottingham and Stanford University, in partnership with the Bank of England, to track businesses' expectations and uncertainty surrounding them. Return to text
5. Exposures are measured as of 2015, the year before the Brexit referendum. Return to text
6. We calculate investment growth rates from "business investment by industry and asset" tables of Office for National Statistics. With only 20 industries, investment data determines the level of aggregation. Return to text
7. Figure 8 plots the change in quarterly business investment growth between post-referendum period and twelve months prior to it. Alternatively, we also used the post-GFC period until the referendum as the "pre-referendum period," and the announcement of referendum in late 2015 as the beginning of "post-referendum period," as well as all possible combinations of them. In all cases, the negative relationship depicted in panel a of Figure 8 was preserved, though at varying degrees of statistical significance. Return to text
8. The negative and significant relationship remains when post-referendum growth rates, rather than change in growth rates relative to pre-referendum period, are considered and when alternative exposure measures, such as direct export exposure, as defined earlier, total export exposure (EU plus non-EU) and share of EU exports in total exports are used. Return to text
9. Employment-by-industry data from Office for National Statistics allowed us to have a larger number of industries in panel b. Nonetheless, when we aggregated the employment data into the level in panel a, we still could not find a correlation between EU exposure toward the EU and change in employment growth. Return to text
10. Note the different level of aggregation in Figure 9, which is limited by the availability of industry-level nationality data. Return to text
11. The correlation remains almost unchanged when we use weights proportional to industry employment, rather than final demands. Return to text
Lipinska, Anna, and Musa Orak (2020). "Real Effects of Uncertainty: Evidence from Brexit," FEDS Notes. Washington: Board of Governors of the Federal Reserve System, May 11, 2020, https://doi.org/10.17016/2380-7172.2536.
Disclaimer: FEDS Notes are articles in which Board staff offer their own views and present analysis on a range of topics in economics and finance. These articles are shorter and less technically oriented than FEDS Working Papers and IFDP papers.