FEDS Notes
May 04, 2020
An Aggregate View of Bank Lending Standards and Demand
David Glancy, Robert Kurtzman, and Rebecca Zarutskie1
The Senior Loan Officer Opinion Survey on Bank Lending Practices (SLOOS) provides information about the supply of, and demand for, bank credit in the United States on a quarterly basis.2 SLOOS responses are used internally by Federal Reserve staff in monitoring bank lending conditions and as an input into research and analysis about broader economic and financial conditions.3 Staff analysis using the SLOOS frequently appears in Federal Reserve publications such as the Tealbook and Financial Stability Report.4
This note describes some common methods Federal Reserve Board staff use to aggregate and analyze SLOOS responses. The SLOOS queries banks about changes in loan standards and terms and loan demand for a wide range of loan categories. Understanding broader trends in credit conditions often requires aggregating responses across banks and across loan categories. Federal Reserve Board staff perform such aggregations by weighting each bank's individual response by its holdings of the relevant loan category and then create indices measuring changes in lending standards or demand for a given loan category. These loan-category-specific indices can then be further aggregated, weighting by the size of banks' aggregate lending for each loan category, to form measures of standards or demand for broader credit categories, such as business loans or household loans.
We describe six new series produced by this weighting procedure: reported changes in standards and demand for business loans, household loans, and all loans for domestically chartered banks. These series will be made available through the Board's data download program (DDP).
Weighting Responses by Banks' Loan Portfolio Shares
On a quarterly basis, the Federal Reserve Board provides to the public aggregate summaries of how banks responded to SLOOS questions, along with detailed tables reporting how banks responded to each question. The content of the summary and the tables, and the accompanying data released through the DDP, have historically been based on unweighted aggregations.5 However, in other documents, staff also present aggregated portfolio-weighted results, in which individual bank responses are weighted based on their outstanding loan balances as reported in the Call Reports. This section summarizes these two different methods of aggregating SLOOS responses.
Both the weighted and unweighted aggregation methods require the construction of a categorical variable measuring whether a bank reported tighter/easier standards or stronger/weaker demand for a given question.6 For questions regarding standards, this variable takes the values:7
$$$$ I_{it}^S\left\lbrack k \right\rbrack = \left\{\begin{matrix} -1, &\text{if bank }i\text{ reported }{easing}\text{ standards on loan category }{k}\text{ in quarter }t\ \ \ \ \ \ \ \ \ \\ \ 0, &\text{if bank }i\text{ reported no change in standards on loan category }{k}\text{ in quarter }t \\ \ 1, &\text{ if bank }i\text{ reported }{tightening}\text{ standards on loan cateogry }{k}\text{ in quarter }{t}. \ \ \ \\ \end{matrix} \right. $$$$
These bank-level responses are then averaged over the N banks responding to that question in the quarter:
$$$$ \Delta{S}_{t}\left\lbrack k \right\rbrack = 100*\sum_{i \in N}{\omega_{i,t - 1}\left\lbrack k \right\rbrack I_{it}^S\left\lbrack k \right\rbrack}, $$$$
where $$\omega_{i,t - 1}\left\lbrack k \right\rbrack$$ is the weight given to bank i for loan category k.8 An index for reported changes in demand, $$\Delta{D}_{t}\left\lbrack k \right\rbrack$$, is constructed analogously as a weighted average of $$I_{\text{it}}^{D}\left\lbrack k \right\rbrack$$, a categorical variable taking the value of 1 if a bank reports stronger demand for loans of type k in quarter t, 0 if banks report demand as unchanged, and -1 if the bank reports weaker demand.
There are two different weighting schemes typically used when analyzing SLOOS data. First, responses to individual questions are analyzed on an unweighted basis, in which case $$\Delta{S}_{t}\left\lbrack k \right\rbrack$$ can be interpreted as the fraction of banks reporting tighter standards net of the fraction of banks reporting easier standards.9 It is these unweighted series that have historically been publically released with each survey. Second, questions are weighted by each bank's lending in the particular category. In this case, $$\omega_{i,t - 1}\left\lbrack k \right\rbrack$$ is the outstanding balance of loan type k for bank i as a fraction of the total outstanding loans of all responding banks in the previous quarter's Call Reports.10 Under this weighting scheme, $$\Delta{S}_{t}\left\lbrack k \right\rbrack$$ measures the fraction of loans (rather than banks) held by banks reporting tighter standards, net of the fraction of loans in banks reporting easier standards. These weighted series are frequently referenced in publications such as the Tealbook and the Financial Stability Report.
These two aggregation methodologies can each capture subtly different developments. The unweighted measures of net changes in standards and demand are useful for measuring common trends in banking conditions. By placing an equal weight on all bank responses, these measures reflect the average response of banks, without allowing any single bank to have undue influence on the measure.11 In contrast, the weighted measures can be useful for capturing the significant influence that the largest lenders can have on aggregate credit supply. These weighted results can better reflect the conditions for the typical borrower, especially in markets where the largest banks account for the majority of all lending.12 Given that idiosyncratic supply shocks to large banks can significantly influence credit and investment (Amiti and Weinstein, 2018), having a measure of changes in lending standards that accounts for differences in banks' share of lending is a valuable complement to the unweighted analysis.
Figure 1 plots the series produced by the different methods for aggregating responses to questions about standards for commercial and industrial (C&I) loans for domestic banks.13 The left panel shows the net share of banks reporting tighter standards for C&I loans to large and middle-market firms, and the right panel shows reported changes in standards for C&I loans to small firms.14 The dotted red lines plot the net share of banks reporting tighter standards on an unweighted basis, and the solid black lines plot the tightening series which weights bank responses by outstanding loans in the Call Reports. The figure also plots the net share of large banks reporting tighter standards—the dashed blue lines— as these are the closest publically available series to the portfolio-weighted ones.15
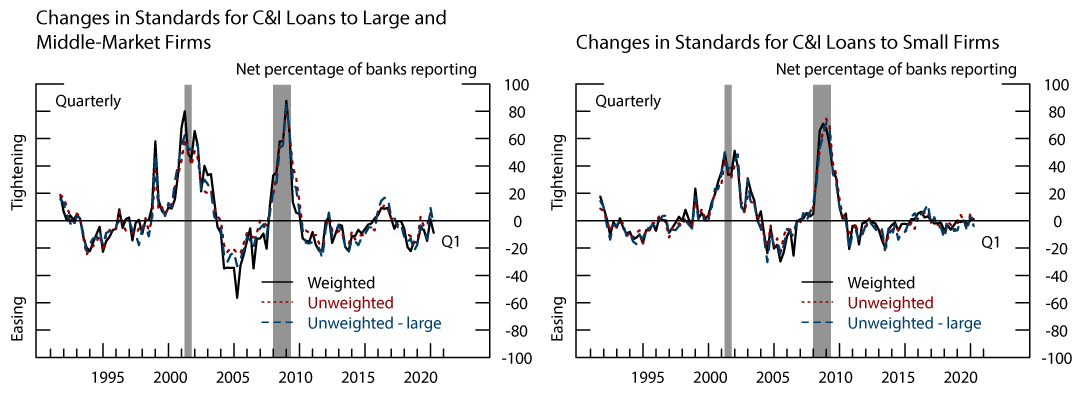
Note: This figure plots the net share of domestic banks reporting tighter/easier standards for C&I loans to large and middle-market firms (left panel) and small firms (right panel), weighted by the size of each bank’s portfolio of the respective loan category reported in the Call Reports. The shaded bars indicate periods of business recession as defined by the National Bureau of Economic Research: March 2001- November 2001 and December 2007-June 2009.
Sources: Federal Reserve Board Senior Loan Officer Opinion Survey on Bank Lending Practices; Consolidated Reports of Condition and Income, FFIEC 031/041/051.
Generally speaking, the weighted and unweighted series move together. However, there are instances of notable tightening or easing in the weighted series that are less prominent in the unweighted series. Focusing first on standards for C&I loans to large and middle-market firms, the tightening of standards following the 1998 Russian financial crisis and the 2000s dot-com bust were more pronounced in the weighted series than the unweighted series, indicating that large banks disproportionately tightened their standards during these episodes. Likewise, there was more significant reported easing in the weighted series in the run-up to the 2008 financial crisis. Some of these differences are reflected in the already available series which show reported changes in standards on an unweighted basis for large banks. However, the unweighted series for large banks still occasionally diverges from the weighted series, indicating that there is additional information available from portfolio-weighting based on the size of banks' holdings of a given loan category.
The time series for changes in standards on C&I loans to small firms, shown in the right panel of Figure 1, follows a similar path to those for loans to large and middle-market firms. However, the peaks and valleys are less extreme than for C&I loans to large and middle-market firms. The differences between the weighted and unweighted series are also less pronounced for C&I loans to small firms.
Aggregation Across Loan Categories
Portfolio-weighted responses to individual questions can provide finely disaggregated estimates of how standards or demand are changing in aggregate in a given loan category. However, it is useful to describe patterns in banking conditions more broadly by aggregating across subcategories of loan types. This is typically done by taking a weighted average of the underlying portfolio-weighted series, where the weights are outstanding loans for the various subcategories in the Call Reports.
Formally, suppose that we are interested in tracking standards for a broad loan category K, composed of subcategories indexed by k. The net standards index is a weighted average of the underlying portfolio-weighted series, weighted by the balance of outstanding loans for each subcategory, denoted $$L_{t}\lbrack k\rbrack$$, in the Call Reports:
$$$$ \Delta S_t^K = \sum_{k \in K}{\Delta{S}_{t}\lbrack k\rbrack\frac{L_{t}\lbrack k\rbrack}{\sum_{j \in K}{L_{t}\lbrack j\rbrack}}}.$$$$
Reponses to questions about changes in loan demand are aggregated across subcategories in an analogous fashion.
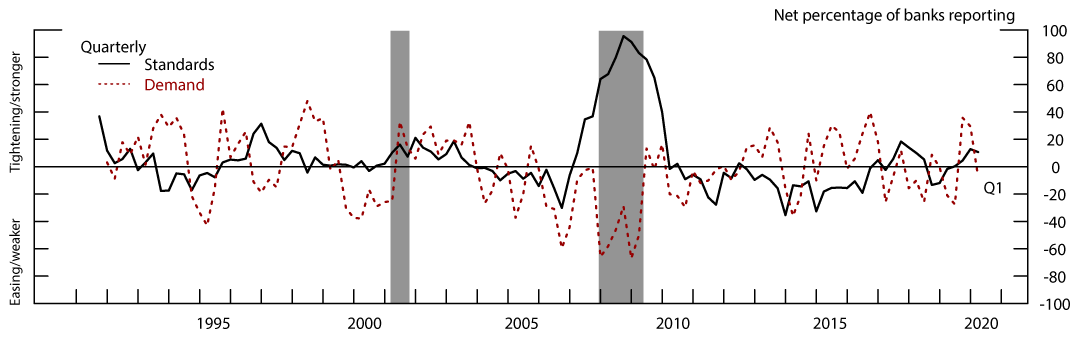
Figure 2 plots reported changes in standards and demand for C&I loans (left panel) and commercial real estate (CRE) loans (right panel). The standards (demand) series for C&I loans are a weighted average of the two portfolio-weighted series discussed in the previous section: net changes in standards (demand) for C&I loans to large and middle-market and C&I loans to small firms. Since C&I lending to small businesses has averaged about 25% of total C&I lending, the aggregate C&I standards series mostly follows that of the weighted series for C&I lending to large and middle-market firms. The weighted net share of banks reporting tighter standards for C&I loans has risen in the lead up to the last two recessions and declined toward the end or shortly after those recessions ended. Demand for C&I loans is also reported as moving closely with business cycles, with banks consistently reporting weakening demand right before and during recessions, and demand recovering in the years after recessions.
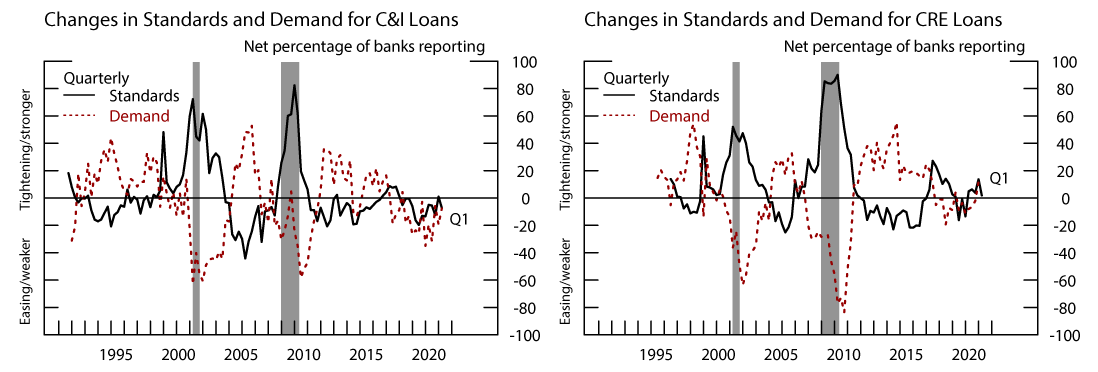
Note: This figure plots the net share of domestic banks reporting tighter/easier standards and stronger/weaker demand for C&I (left panel) and CRE (right panel) loans, aggregated across loan categories, weighted by the size of banks' portfolios reported in the Call Reports. The shaded bars indicate periods of business recession as defined by the National Bureau of Economic Research: March 2001-November 2001 and December 2007-June 2009.
Sources: Federal Reserve Board Senior Loan Officer Opinion Survey on Bank Lending Practices; Consolidated Reports of Condition and Income, FFIEC 031/041/051
Standards and demand for CRE loans (right panel) follow a broadly similar pattern as for C&I loans. To construct changes in standards and demand for CRE loans, we aggregate across three different loan categories: loans secured by multifamily properties (apartment buildings), loans secured by nonfarm nonresidential properties, and construction loans. The weighted net percentage of banks reporting tighter standards for CRE loans rises before recessions, and falls shortly after the recessions end.
Figure 3 plots changes in standards and demand for residential real estate (RRE) loans (left panel) and consumer loans (right panel).16 In the SLOOS sample, reported changes in standards and demand for RRE and consumer loans are less aligned with the business cycle than standards and demand for C&I and CRE loans. Standards for RRE loans tightened for major net fractions of banks during the financial crisis, but not during the 2001 recession. The net share of banks reporting stronger demand for RRE loans also exhibits significant swings from quarter to quarter, perhaps indicating demand fluctuating due to residual seasonality. The demand series for consumer loans is not as volatile as for RRE loans, but still exhibits more pronounced quarter-to-quarter swings than for business loan categories. Reported changes in standards for consumer loans are also more volatile than for business loans.
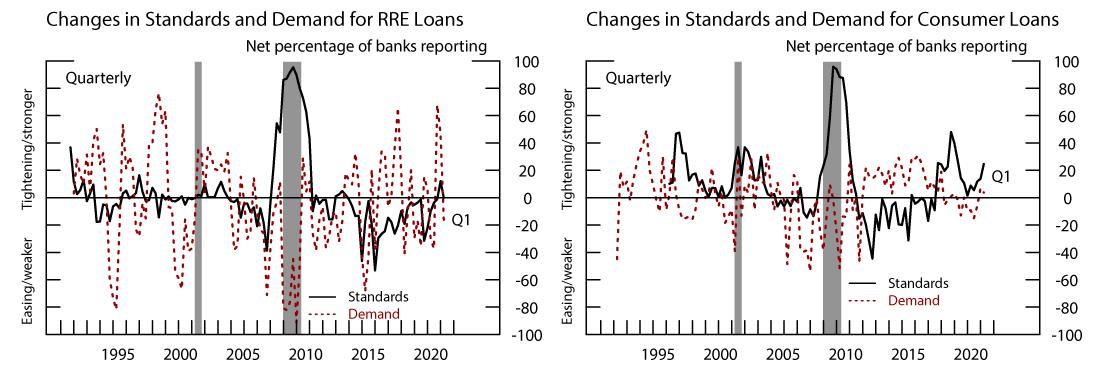
Note: This figure plots the net share of banks reporting tighter/easier standards and stronger/weaker demand for RRE (left panel) and consumer (right panel) loans, aggregated across loan categories, weighted by the size of banks' portfolios reported in the Call Reports. The shaded bars indicate periods of business recession as defined by the National Bureau of Economic Research: March 2001-November 2001 and December 2007-June 2009.
Sources: Federal Reserve Board Senior Loan Officer Opinion Survey on Bank Lending Practices; Consolidated Reports of Condition and Income, FFIEC 031/041/051.
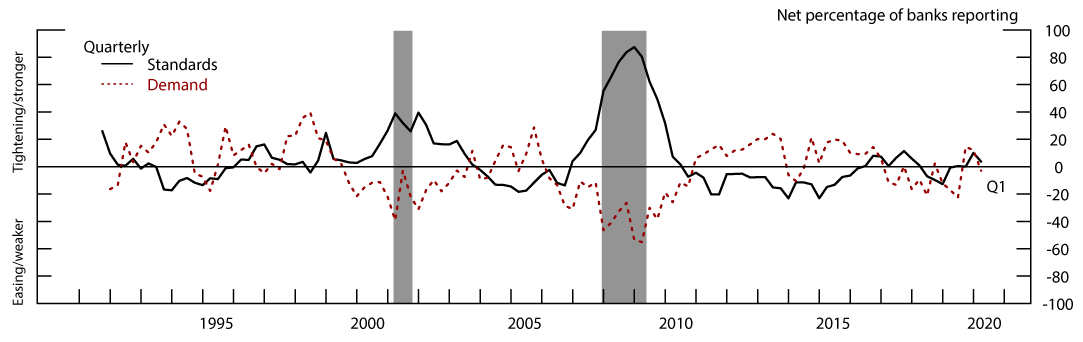
The series for C&I, CRE, RRE, and consumer lending can be further aggregated to measure changes in standards and demand for broader aggregates. In Figure 4, we plot changes in standards and demand for business loans, which are the weighted average of the C&I and CRE series, weighted by the relative amount of such loans outstanding in the Call Reports.17 Given C&I and CRE lending are of similar size on bank balance sheets in aggregate, the series generally follow the average of the patterns of the underlying series plotted in Figure 2.
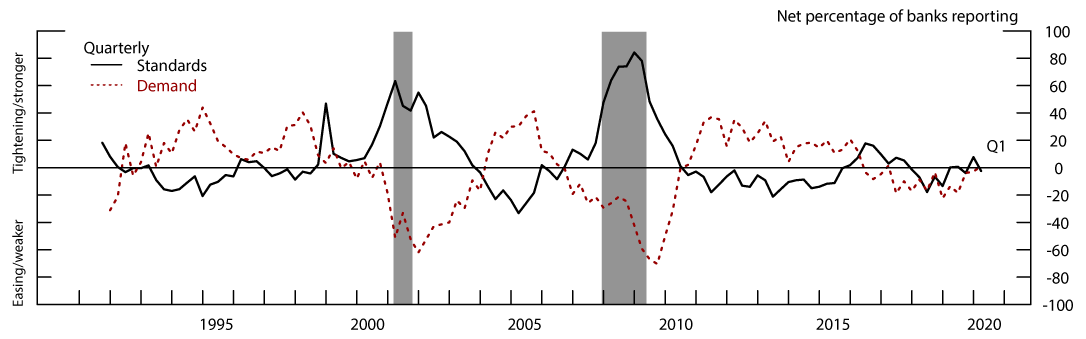
Note: This figure plots the net share of domestic banks reporting tighter/easier standards and stronger/weaker demand for business loans, aggregated across business loan categories, weighted by the size of banks' portfolios reported in the Call Reports. The shaded bars indicate periods of business recession as defined by the National Bureau of Economic Research: March 2001-November 2001 and December 2007-June 2009.
Sources: Federal Reserve Board Senior Loan Officer Opinion Survey on Bank Lending Practices; Consolidated Reports of Condition and Income, FFIEC 031/041/051.
Figure 5 aggregates the RRE and consumer indices into measures of standards and demand for household loans.18 While the additional aggregation smooths out some of the volatility, the descriptions of the series in Figure 3 mostly hold in the more aggregated series.
Note: This figure plots the net share of banks reporting tighter/easier standards and stronger/weaker demand for household loans, aggregated across household loan categories, weighted by the size of banks' portfolios reported in the Call Reports. The shaded bars indicate periods of business recession as defined by the National Bureau of Economic Research: March 2001-November 2001 and December 2007-June 2009.
Sources: Federal Reserve Board Senior Loan Officer Opinion Survey on Bank Lending Practices; Consolidated Reports of Condition and Income, FFIEC 031/041/051.
Figure 6 presents the most aggregate measures of changes in standards and demand, which average the business and household series, weighting by aggregate loans outstanding to businesses and households in the Call Reports. The figure indicates that the aggregated SLOOS changes in standards or demand may be useful leading indicators for economic downturns. In the quarters leading up to the last two recessions, significant net shares of banks reported tighter standards and weaker demand. Such broad-based reports of weakening demand or tighter standards were only associated with periods during or immediately surrounding recessions.
Note: This figure plots the net share of domestic banks reporting tighter/easier standards and stronger/weaker demand for all loans, aggregated across all loan categories, weighted by the size of banks’ portfolios reported in the Call Report. The shaded bars indicate periods of business recession as defined by the National Bureau of Economic Research: March 2001-November 2001 and December 2007-June 2009.
Sources: Federal Reserve Board Senior Loan Officer Opinion Survey on Bank Lending Practices; Consolidated Reports of Condition and Income, FFIEC 031/041/051.
New Publicly Available Aggregate SLOOS Series
In conjunction with the release of this note, aggregate series for changes in standards and demand for business loans, household loans, and all loans, as depicted in Figures 4, 5, and 6, will be released to the public through the Federal Reserve Board's DDP. These six aggregate series account for differences in the scale of banks' operations, and differences in the importance of various loan categories for aggregate bank lending, complementing the already available unweighted aggregate indices available in the DDP.
References
Amiti, Mary, and David E. Weinstein. 2018. "How Much do Idiosyncratic Bank Shocks Affect Investment? Evidence from Matched Bank-firm Loan Data." Journal of Political Economy 126(2): 525-587.
Bassett, William F., Mary Beth Chosak, John C. Driscoll, and Egon Zakrajšek. 2014. "Changes in Bank Lending Standards and the Macroeconomy." Journal of Monetary Economics 62: 23-40.
Brave, Scott A. and R. Andrew Butters. 2011. "Monitoring Financial Stability: A Financial Conditions Index Approach." Economic Perspectives 35(1): 22-43.
Ciccarelli, Matteo, Angela Maddaloni, and José-Luis Peydró. 2015. "Trusting the Bankers: A New Look at the Credit Channel of Monetary Policy." Review of Economic Dynamics 18.4: 979-1002.
Kurtzman, Robert J., Stephan Luck, and Thomas Zimmermann. Forthcoming."Did QE Lead Banks to Relax Their Lending Standards? Evidence from the Federal Reserve's LSAPs." Journal of Banking and Finance.
Lown, Cara, and Donald P. Morgan. 2006. "The Credit Cycle and the Business Cycle: New Findings Using the Loan Officer Opinion Survey." Journal of Money, Credit and Banking: 1575-1597.
Maddaloni, Angela, and José-Luis Peydró. 2011. "Bank Risk-taking, Securitization, Supervision, and Low Interest Rates: Evidence from the Euro-area and the U.S. Lending Standards." The Review of Financial Studies: 24(6), 2121-2165.
Paligorova, Teodora and Joao A.C. Santos. 2017. "Monetary Policy and Bank Risk-Taking: Evidence from the Corporate Loan Market." Journal of Financial Intermediation 30: 35-49.
Schreft, Stacey L. and Robert E. Owens. 1991. "Survey Evidence of Tighter Credit Conditions: What Does It Mean?" Economic Quarterly-Federal Reserve Bank of Richmond 77(2): 29.
Vojtech, Cindy M., Benjamin S. Kay, and John C. Driscoll. Forthcoming. "The Real Consequences of Bank Mortgage Lending Standards," Journal of Financial Intermediation.
Appendix: Further Details on the Construction of Weighted SLOOS Aggregates
This appendix presents further details on the construction of the C&I, CRE, RRE, and consumer SLOOS aggregates discussed in the body of this note, starting with the discussion of how portfolio-weights are derived from the Call Reports for each loan category.
For CRE loans and consumer loans, there is a straightforward concordance between the Call Reports and the SLOOS. For CRE, staff have regularly queried banks regarding construction loans, multifamily loans, and loans secured by nonfarm nonresidential properties in the SLOOS since the October 2013 survey. Prior to this period, banks were asked about CRE loans, generally. For consumer lending, staff have regularly queried banks regarding credit card lending, auto lending, and consumer lending other than credit card and auto lending since the April 2011 survey. Prior to this period, banks were asked about credit card and non-credit card consumer loans. Banks report their outstanding loan balances for each of these subcategories of loans in the Call Reports.
Unlike with CRE or consumer lending, for C&I loans, there is not an exact Call Report equivalent for lending to large and middle-market firms or for lending to small firms, so staff instead use Call Report data on C&I loans by loan size. C&I loans above $1 million are classified as loans to large and middle-market firms and loans below $1 million are classified as loans to small firms.19
For RRE lending, there is no close analogue in the Call Reports for the RRE categories covered in the SLOOS. Since the January 2015 survey, staff have queried SLOOS banks regarding seven closed-end mortgage categories: government sponsored enterprise (GSE)-eligible, qualified mortgage (QM) jumbo, non-QM jumbo, QM non-jumbo non-GSE-eligible, non-QM non-jumbo, government, and subprime.20 When constructing portfolio-weighted measures of standards or demand for these questions, individual bank responses are weighted by the outstanding balance of closed-end mortgages at the bank rather than lending for the particular category.
The Call Report items used to aggregate results across different questions are typically the same as the ones used to aggregate across banks, with the exception of RRE. In constructing aggregates for C&I, CRE, and consumer lending, the weight for each subcategory is the aggregate outstanding balance of each loan type in the Call Reports.21 Thus, the aggregate indices are loan-weighted averages of the portfolio-weighted result. When aggregating the mortgage subcategories to a broader RRE index, however, rule-of-thumb approximations of bank RRE portfolio shares are used due to the lack of detail available in the Call Reports. Weights of 0.5, 0.4, and 0.1 are given to GSE-eligible, QM jumbo, and non-QM jumbo lending, respectively, while other categories are given no weight.22
1. We are very grateful to Max Gross for his excellent research assistance on this note. Return to text
2. Details on the SLOOS and the composition of the reporting panel can be found here: https://www.federalreserve.gov/data/sloos/about.htm. Return to text
3. For recent examples of SLOOS being used for research by Federal Reserve System staff, see Schreft and Owens (1991), Lown and Morgan (2006), Brave and Butters (2011), Bassett, Chosak, Driscoll, and Zakrajšek (2014), Paligorova and Santos (2017), Vojtech, Kay, and Driscoll. (forthcoming), and Kurtzman, Luck, and Zimmermann (forthcoming). See also Maddaloni and Peydró (2013) and Ciccarelli, Maddaloni, and Peydró (2015) for examples of research performed outside of the Federal Reserve System using publically available SLOOS data. Return to text
4. Aggregated SLOOS results have been referenced in publically available versions of the Domestic Financial Developments portion of Greenbook Part 2 and the Financial Developments portion of Tealbook A. These documents may be found along with other historical materials of the Federal Open Market Committee at the link: https://www.federalreserve.gov/monetarypolicy/fomc_historical_year.htm. Aggregated SLOOS results have also been referenced in the recent Financial Stability Reports. These reports can be found at the link: https://www.federalreserve.gov/publications/financial-stability-report.htm. Return to text
5. The aggregated unweighted net time series for each question can be downloaded here: https://www.federalreserve.gov/datadownload/Build.aspx?rel=SLOOS. Additional charts, tables, and analysis can be found on the SLOOS site here: https://www.federalreserve.gov/data/sloos.htm. Return to text
6. This description closely follows that of Bassett, Chosak, Driscoll, and Zakrajšek (2014), who study the macroeconomic effects of changes in bank lending standards. Return to text
7. Banks respond to questions about lending standards on a qualitative scale, with the options being that standards 1) eased considerably, 2) eased somewhat, 3) remained about unchanged, 4) tightened somewhat, and 5) tightened considerably. Reported changes in demand similarly include the "somewhat" and "considerably" modifiers. The common practice of Board staff is to not distinguish between the two modifiers, as banks rarely report standards or demand as changing considerably. Return to text
8. Weights are always normalized to sum to one. Return to text
9. In this case, $$\omega_{i,t - 1}\left\lbrack k \right\rbrack$$ is equal across all i. Return to text
10. In the Appendix, we discuss which Call Reports items are used to construct the different portfolio-weighted series. Throughout this document, the Call Reports refers to the Consolidated Reports of Condition and Income (FFIEC Reporting Forms 31, 41, and 51). Return to text
11. Furthermore, as SLOOS oversamples the largest banks, placing a larger weight on the responses of larger banks would cause the results to be less reflective of the universe of domestic banks. Return to text
12. For example in the credit card market, the largest 10 banks account for the majority of lending based on calculations using the universe of bank Call Reports in 2019:Q3 and considering all credit card loans booked in domestic offices. Return to text
13. The time labeling convention used in the figures is as follows: January survey data points correspond to Q1 of the year of the survey release, April survey data points to Q2, July survey data points to Q3, and October survey data points to Q4. Return to text
14. Large and middle-market firms are defined as firms with annual sales of $50 million or more, and small firms are those with annual sales of less than $50 million. Return to text
15. Large banks are currently those with total domestic assets of $50 billion or more for each survey, where the calculation uses data from the Call Reports as of the quarter prior. Return to text
16. See the Appendix for details regarding the underlying loan categories used to create these aggregate RRE and consumer lending indices. Return to text
17. Prior to the April 1995 survey, the series Changes in Demand for Business Loans only reflects changes in demand for C&I loans, as there were no regular questions on changes in CRE loan demand prior to this survey. Similarly, prior to the April 1996 survey, the series Changes in Standards for Business Loans only reflects changes in standards for C&I loans, as there were no regular questions on changes in standards for CRE loans prior to this survey. Return to text
18. Prior to the April 1996 survey, the series Changes in Standards for Household Loans only reflects changes in standards for RRE loans, as there were no regular questions on changes in standards for consumer loans prior to this survey. Return to text
19. Before 1993, small C&I loan data were unavailable, so both C&I loan questions are weighted by aggregate C&I loans. From 1993 to 2009, small C&I loan data were only available in the second quarter, so these second quarter values are used to weight responses for all quarters in these years. After 2010, small C&I loan data are available quarterly for most banks in the SLOOS sample. The exception is banks with less that $5 billion in assets, which started reporting semi-annually in September 2019. For these banks, the most recently available data are used to form weights. Return to text
20. Before the April 2007 survey, staff asked about closed-end mortgage lending, generally. From the April 2007 survey through the October 2014 surveys, staff queried banks regarding "prime", "nontraditional," or "subprime" lending categories. Note that home equity lines of credit are excluded from the analysis of RRE lending. Return to text
21. Note that results are weighted by the outstanding balance of all loans of the type in the Call Reports, instead of the outstanding balance for the panel of SLOOS banks. This makes the size of the subcategory reflective of the universe of banks rather than the SLOOS panel. Return to text
22. Staff estimate the 50, 40, 10 split for RRE as a rough approximation of the relative portfolio holdings of the largest SLOOS RRE categories. Return to text
Glancy, David, Robert Kurtzman, and Rebecca Zarutskie (2020). "An Aggregate View of Bank Lending Standards and Demand," FEDS Notes. Washington: Board of Governors of the Federal Reserve System, May 04, 2020, https://doi.org/10.17016/2380-7172.2546.
Disclaimer: FEDS Notes are articles in which Board staff offer their own views and present analysis on a range of topics in economics and finance. These articles are shorter and less technically oriented than FEDS Working Papers and IFDP papers.