FEDS Notes
July 15, 2022
An Analysis of the Interest Rate Risk of the Federal Reserve’s Balance Sheet, Part 2: Projections under Alternative Interest Rate Paths1
Alyssa Anderson, Philippa Marks, Dave Na, Bernd Schlusche, and Zeynep Senyuz
As discussed in the first note of this two-note series, net income of the Federal Reserve (Fed) and its remittances to the U.S. Treasury along with the unrealized gain or loss position of the System Open Market Account (SOMA) portfolio are affected by fluctuations in interest rates. The need for the Fed to increase the policy rate expeditiously to address inflationary pressures is projected to result in the Fed's net income turning negative temporarily. The associated increase in market interest rates has also led to an unrealized loss position of the SOMA portfolio, which could become larger in the near-term. In this second note, we provide a simulation-based analysis of the interest rate risk associated with the Fed's balance sheet. Under a wide range of interest rate paths and associated macroeconomic outcomes, we provide projections of the Fed's balance sheet and of its income and the SOMA portfolio's unrealized position.
Methodology and Assumptions
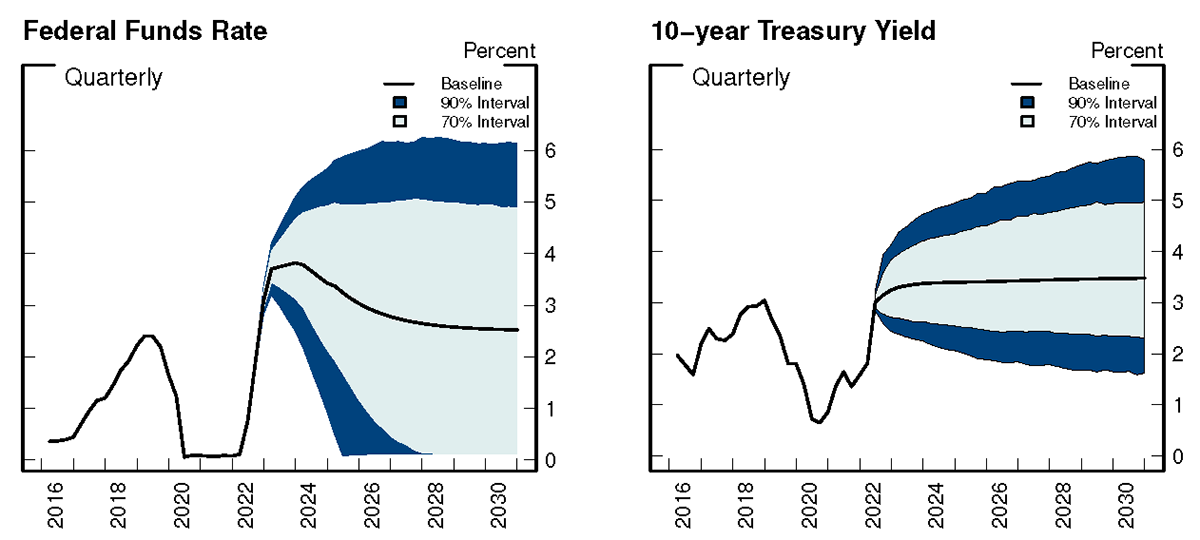
We generate sets of paths for the federal funds rate, the 10-year Treasury yield, and other financial and macroeconomic variables from stochastic simulations of the FRB/US model around a baseline path consistent with the FOMC participants' Summary of Economic Projections (SEP) submitted for the June 2022 FOMC meeting.2,3 Figure 1 shows the federal funds rate and the 10-year Treasury yield along with the associated confidence bands obtained from the stochastic simulations. The light-blue and dark-blue shaded areas reflect the range of outcomes associated with the 70- and 90-percent confidence intervals, respectively. As shown on the left, the federal funds rate under the baseline increases sharply before retracing somewhat and leveling off at around 2.5 percent. The 10-year Treasury yield, shown on the right, moves up sharply in the near-term and levels off at around 3.5 percent.
Using these interest rate paths obtained from the stochastic simulations of the FRB/US model, we generate projections for the Fed's balance sheet and income as well as the SOMA's unrealized gain or loss position. We then quantify the degree of uncertainty around the Fed's income and the value of the SOMA portfolio.4
Our projections are based on policy assumptions about the Fed's balance sheet that are consistent with the FOMC's "Plans for Reducing the Size of the Federal Reserve's Balance Sheet," released at the May 2022 FOMC meeting.5 Consistent with the FOMC's plans, the decline in the SOMA portfolio is assumed to slow and then stop when reserves are somewhat above a level that is considered to be ample, before the SOMA eventually increases again in order to maintain ample reserves over time.6 Of course, the evolution of the balance sheet is subject to a high degree of uncertainty related to the future course of the economy and policy. Therefore, the projections presented here are purely illustrative.
Projections for the Balance Sheet
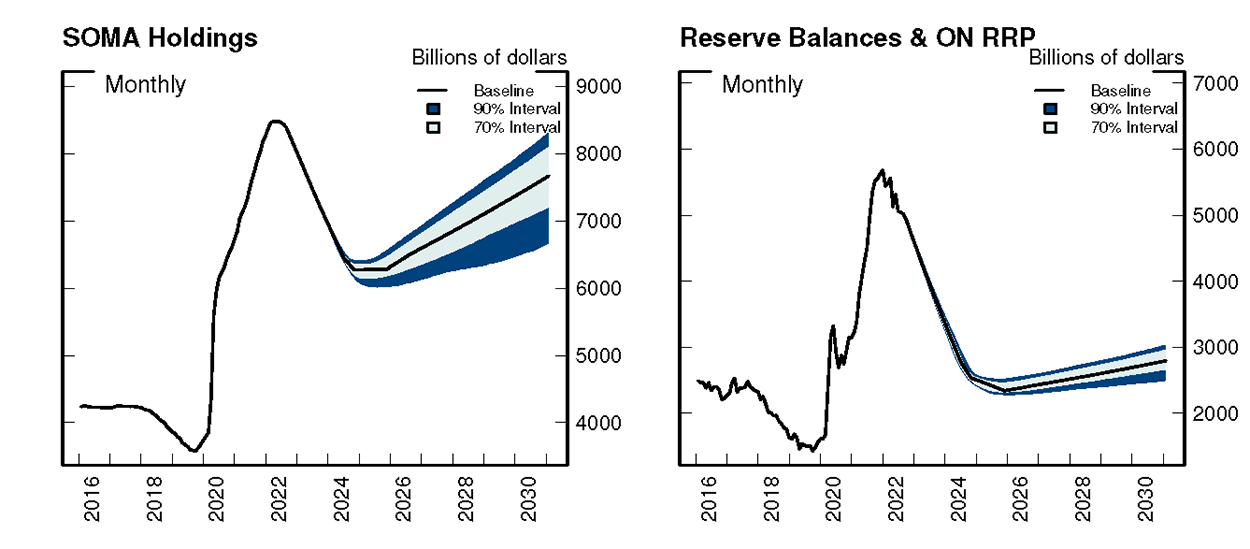
Figure 2 shows the baseline projections for the evolution of the securities holdings in the SOMA portfolio and interest-bearing liabilities (solid black line), along with the 70- and 90-percent confidence intervals for the range of outcomes (shaded regions), generated using the interest rate paths plotted in Figure 1.7 Under the baseline path, SOMA holdings decline from $8.5 trillion in 2022 to $6.3 trillion by the end of the projected date of balance sheet runoff in 2024. Thereafter, the size of the balance sheet is held constant until the SOMA portfolio starts to expand with purchases of Treasury securities for reserve management purposes, that is, to accommodate trend growth in Fed liabilities. The evolution of SOMA holdings and interest-bearing liabilities depend on a range of outcomes for nominal GDP growth. While the projected ranges for SOMA holdings and interest-bearing liabilities are rather small during balance sheet runoff, they widen over time reflecting the increased variability of nominal GDP growth and the associated demand for the Fed's liabilities. Under the baseline, at the end of the projection period in 2030, SOMA holdings and interest-bearing liabilities are projected to be $7.6 trillion and $2.8 trillion, respectively. At this time, possible outcomes for the size of the SOMA portfolio and interest-bearing liabilities within the 90-percent confidence band range from $6.7 trillion to $8.3 trillion, and $2.5 trillion to $3.0 trillion, respectively.
Projections for Income, Remittances to the Treasury, and Deferred Asset
As discussed in Note 1, the Fed's income and remittances to the Treasury have been elevated over the last two years as a result of the Fed's securities purchases in response to the COVID-19 pandemic. However, given the recent and expected rise in interest rates, remittances are projected to fall to zero for a time and a deferred asset, which represents the amount of future net income that will need to be realized before remittances to the Treasury resume, will be recorded on the Fed's balance sheet.8
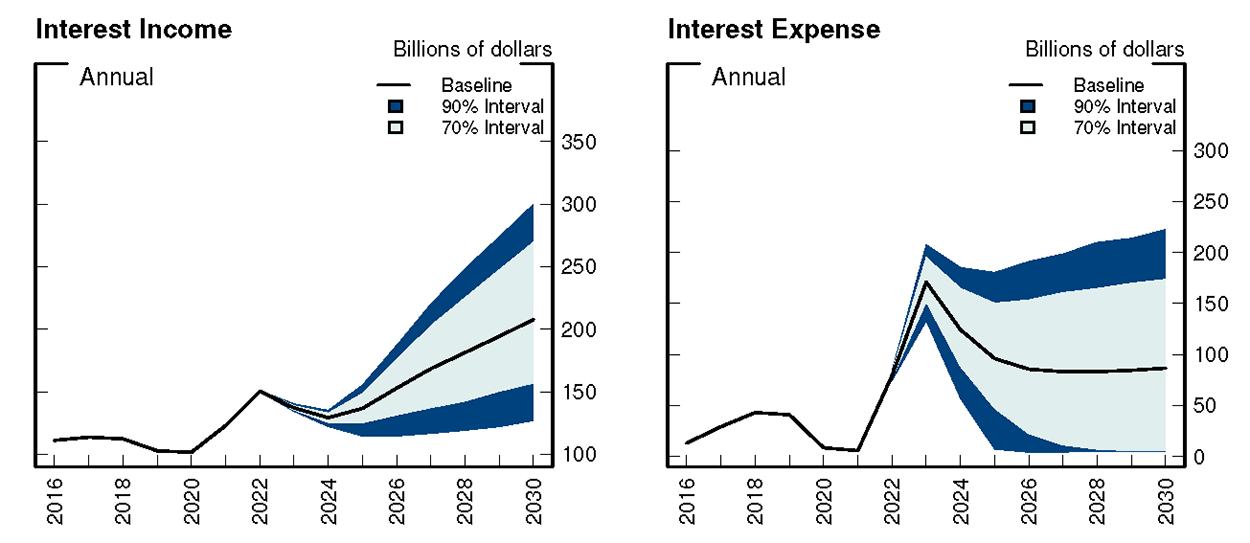
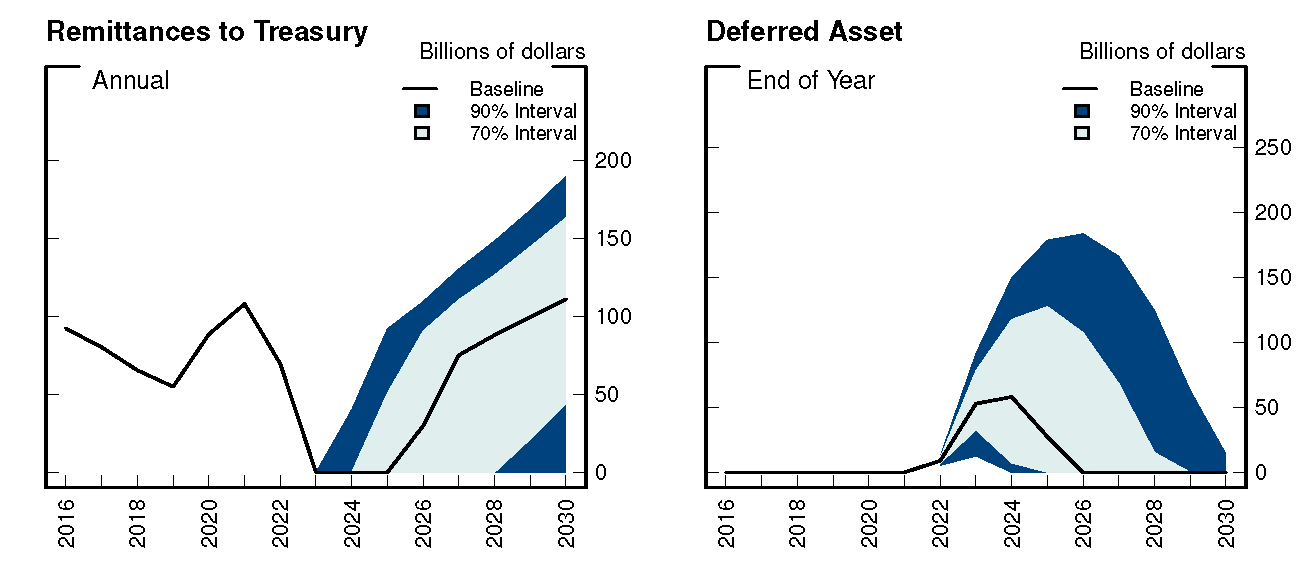
Figure 3 shows the interest income and interest expense associated with the projected evolution of the Fed's balance sheet for various simulated interest rate paths. Under the baseline path, interest income is projected to decline in the near-term during balance sheet runoff, while interest expense is projected to rise with increases in the rates paid on reserves and other Fed liabilities, resulting in a temporary period of negative net income. As a result, remittances are suspended for three years in the baseline and a deferred asset is recorded on the Fed's balance sheet, as seen in Figure 4.9 While the deferred asset reaches a peak of about $60 billion in the baseline projection, the tail risk in these projections, represented by the upper edge of the dark-blue area, indicates that the deferred asset could reach as high as about $180 billion. As net income rises above zero, the deferred asset is reduced, and remittances resume once the deferred asset is extinguished. Under the baseline scenario, despite the temporary suspension of remittances, cumulative remittances from 2022 to 2030 are projected to be sizable, amounting to about $470 billion.
Projections for Unrealized Gains or Losses of the SOMA Portfolio
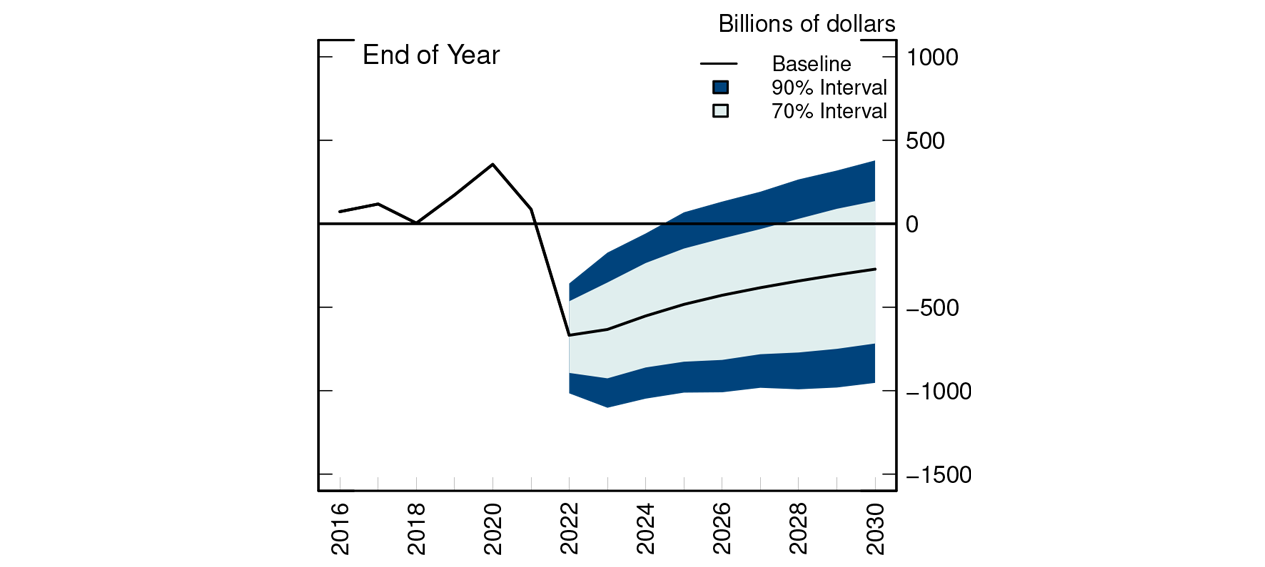
As published in the Federal Reserve Banks Combined Quarterly Financial Reports, the SOMA portfolio was in an unrealized loss position of $330 billion, or about 4 percent of the portfolio's par value, at the end of the first quarter of 2022. As shown in Figure 5, this unrealized loss position is expected to become larger as interest rates are expected to increase further. Under the baseline projection, the unrealized loss position is projected to reach a maximum of about $670 billion, or about 8 percent of the portfolio's par value, by the end of 2022. The unrealized loss position then declines gradually as SOMA securities associated with unrealized losses approach maturity; at the maturity date, the market value of each security returns to its face value. The range of outcomes for the unrealized loss position stemming from much higher interest rates than under the baseline is quite large; for example, as indicated by the lower edge of the 90-percent confidence band which represents a tail risk event, unrealized losses peak at around $1.1 trillion, or about 16 percent of the portfolio's par value, in 2023. While the SOMA's unrealized loss position is expected to increase with expected further increases in interest rates, this has no direct impact on the Fed's income or the ability of the Fed to meet its financial obligations or conduct monetary policy, as discussed in Note 1. Moreover, the unrealized loss position will fade over time as current securities holdings reach maturity.
Conclusion
In this note, we showed that net income is likely to turn negative temporarily, resulting in a deferred asset to be recorded on the Fed's balance sheet in the near-term under a range of potential macroeconomic outcomes. We project the deferred asset to remain on the balance sheet for a few years under the baseline scenario and potentially longer under scenarios with higher interest rate paths and shorter under scenarios with lower interest rate paths. While the expansion of the Fed's balance sheet in response to the pandemic may have increased the risk of the Fed's net income turning negative temporarily in a rising interest-rate environment, the Fed's mandate is neither to make profits nor to avoid losses. In all its actions, the Fed seeks to achieve its congressional mandate of maximum employment and stable prices. If the Fed had not taken these actions, the risk of experiencing a period in which net income turns negative would be lower than it is at present, but the economic position of households, businesses, the U.S. government, and taxpayers would be far worse off. In line with its strong commitment to return inflation to its 2-percent objective, the Fed has been increasing the target range for the federal funds rate since March 2022. The possibility of income turning negative temporarily in the near-term is arising from the need to raise interest rates expeditiously to address the ongoing inflationary pressures. While the rising interest rates have ancillary effects for the Federal Reserve's income and the unrealized position of the SOMA portfolio, none of these effects impair the Fed's ability to conduct monetary policy or to fulfill any of its other responsibilities.
References
Brayton, Flint, Thomas Laubach, and David Reifschneider (2014). "The FRB/US Model: A Tool for Macroeconomic Policy Analysis," FEDS Note, April 03, 2014.
González-Astudillo, Manuel, and Diego Vilán (2019). "A New Procedure for Generating the Stochastic Simulations in FRB/US," FEDS Note, March 07, 2019.
Federal Reserve Bank of New York (2022). "Open Market Operations During 2021 (PDF)," May 24, 2022.
Ferris, Erin E. Syron, Soo Jeong Kim, and Bernd Schlusche (2017). "Confidence Interval Projections of the Federal Reserve Balance Sheet and Income," FEDS Note, January 13, 2017.
1. Jamie Grasing and James Trevino provided excellent technical support. We thank David Bowman, Christian Cabanilla, Kathryn Chen, Casey Clark, Jim Clouse, Rochelle Edge, Chris Gust, Lorie Logan, Grace Milbank, Linsey Molloy, Trevor Reeve, Kim Zaikov, and Patricia Zobel for their useful comments and suggestions. The views expressed in this note are our own, and do not necessarily represent the views of the Board of Governors or the Federal Reserve System. Return to text
2. The FRB/US model is a large-scale estimated general equilibrium model of the U.S. economy developed at the Federal Reserve Board. Further information regarding the FRB/US model is available at http://www.federalreserve.gov/econresdata/frbus/us-models-about.htm. Return to text
3. Over the horizon for which SEP projections are available, the baseline projection for the federal funds rate follows the median projections in the SEP. Beyond the horizon for which SEP projections are available, the federal funds rate follows the predictions of an inertial version of the Taylor (1999) rule (for details regarding the policy rule, see Brayton, Laubach, and Reifschneider, 2014). The projection of the 10-year Treasury yield is consistent with the projected path of the federal funds rate as well as the path of the term-premium that is assumed to converge incrementally towards the long-run value implied by the FRB/US equation (the FRB/US EViews package, which is available at https://www.federalreserve.gov/econres/us-models-package.htm, includes a file containing the model equations and parameters). The FRB/US data package, which is also available at https://www.federalreserve.gov/econres/us-models-package.htm, contains additional information about the baseline projection. We simulate the FRB/US model using historical shocks of the kind and size experienced by the U.S. economy over the past several decades. We employ the historical shock sampling approach of González-Astudillo and Vilán (2019). Return to text
4. Ferris, Kim, and Schlusche (2017) conduct a similar analysis on the interest rate risk of the Fed's balance sheet following the large-scale asset purchases in response to the Global Financial Crisis. Return to text
5. Details regarding these plans are available at https://www.federalreserve.gov/newsevents/pressreleases/monetary20220504b.htm. Our policy assumptions are largely consistent with those described in the report "Open Market Operations During 2021" which was released in May 2022 (Federal Reserve Bank of New York, 2022). Return to text
6. Our simulations do not incorporate an endogenous balance sheet policy. That is, the scenarios in which the federal funds rate reaches its effective lower bound do not include any asset purchases to put downward pressure on term premiums and thereby provide additional stimulus. Return to text
7. SOMA holdings primarily include Treasury securities and agency MBS. Interest-bearing liabilities include reserves of the banking system and the overnight reverse repo (ON RRP) facility. Return to text
8. A deferred asset is reported as a negative liability on the Federal Reserve's balance sheet under the line item "Earnings remittances due to U.S. Treasury" on the weekly H.4.1 Federal Reserve Statistical Release. On the consolidated annual financial reports, the Fed has reported only two instances of relatively small deferred assets over the last decade, reflecting negative income at individual Reserve Banks. Return to text
9. The possibility of having a deferred asset on the balance sheet was also discussed in FRBNY's report "Open Market Operations During 2021" (Federal Reserve Bank of New York, 2022). Return to text
Anderson, Alyssa, Philippa Marks, Dave Na, Bernd Schlusche, and Zeynep Senyuz (2022). "An Analysis of the Interest Rate Risk of the Federal Reserve's Balance Sheet, Part 2: Projections under Alternative Interest Rate Paths," FEDS Notes. Washington: Board of Governors of the Federal Reserve System, July 15, 2022, https://doi.org/10.17016/2380-7172.3174.
Disclaimer: FEDS Notes are articles in which Board staff offer their own views and present analysis on a range of topics in economics and finance. These articles are shorter and less technically oriented than FEDS Working Papers and IFDP papers.