FEDS Notes
November 19, 2018
Money in the Bank? Assessing Families' Liquid Savings using the Survey of Consumer Finances1
On May 8, 2019, the percentage in footnote 3 was corrected to state 40 percent, instead of 60 percent as originally noted.
Families often aim to build up easily accessible savings to help deal with unexpected expenses and disruptions to their income. Professional financial planners often recommend an "emergency fund" of three to six months of expenses.2 Although interest rates on savings in highly liquid transaction accounts are generally quite low, such savings can help avoid costly borrowing or missed payments when unexpected events arise. Yet there is mounting evidence that many families have little to no financial cushion. For example, a recent survey finds that many Americans would borrow or sell something to cover an unexpected $400 expense, suggesting very low levels of liquid savings among a large fraction of the population.3
In this Note we use data from the Federal Reserve Board's triennial Survey of Consumer Finances (SCF) to directly assess American families' liquid savings. The SCF data are well-suited for this purpose: they provide comprehensive information on families' assets and debts. The SCF interview walks respondents through each type of financial account they could potentially have and asks for the dollar balance. With these details in hand, we can then tally up families' total liquid assets.4 Moreover, the SCF collects a significant amount of information on families' typical monthly expenses, allowing us to gauge families' liquid assets relative to their own expenses.5
To start our analysis, we estimate how many families have at least $400 in liquid savings. Then we move beyond this specific dollar-value concept and trace out the distribution of families' liquid assets relative to their typical expenses. We provide two main findings. First, we estimate that just 76 percent of families have at least $400 in liquid savings. Second, we find that only about 40 percent of families have liquid savings equivalent to at least three months of expenses, and less than 30 percent have liquid savings equivalent to at least six months of expenses. Older, higher income, and married families tend to have more liquid savings, but even many of these families do not have more than three months of liquidity.
How many Americans have $400? Estimating liquidity from the SCF data
Our first exercise is to use the 2016 SCF data to try to understand how many families could cover a modest emergency expense from liquid savings. We define "modest expense" as $400, following a question posed in the Survey of Household Economics and Decisionmaking (SHED), another survey conducted by the Federal Reserve Board. 6
We estimate total liquid savings from the SCF data as the sum of balances held in: transaction accounts (such as checking or savings accounts), cash, prepaid cards, and directly held stocks, bonds, and mutual funds. In 2016, we observe that about 84 percent of families reported having at least $400 in these liquid accounts. 7
One concern with this SCF estimate is that it is recorded at an arbitrary time in the month when the SCF interview is conducted. Thus, current liquidity may be overstated if some regular monthly expenses have yet to be paid and some of this liquidity has been earmarked for an upcoming expense. To allow for this possibility, we incorporate information on families' monthly expenses into our analysis. The SCF directly collects data on a significant portion of families' monthly expenses: rent and mortgage payments, car loan and lease payments, other monthly debt payments (such as credit cards and student loans), and spending on food. In addition, we estimate other monthly recurring expenses, such as utilities (including cable and cell phones), health costs, insurance costs, and housing and vehicle maintenance costs, based on characteristics of the household.8
To create an adjusted liquidity measure which takes into account money earmarked for upcoming expenses, we divide the sample into 3 groups: (1) families who report liquidity of less than $400, (2) families who report liquidity of at least $400 but less than one month of expenses plus $400, and (3) families who report liquidity of at least one month of expenses plus $400. While we can assume that group (1) does not have an extra $400 and that group (3) does have an extra $400, whether or not group (2) actually has an extra $400 is less clear.
To gauge how many families in group (2) are likely to have $400, we incorporate information on saving behavior from the SCF question that asks respondents whether they "spent less than their income last year." By this measure, 71 percent of families in group (3) save, compared to just 28 percent of families in group (1). Using this correlation, we estimate the share of group (2) that has $400, given that 39 percent of these families reported saving.9 Our adjusted liquidity measure indicates that 76 percent of American families have $400 in liquid savings. This expense-adjusted estimate is smaller than our unadjusted estimate of 84 percent, and suggests that almost a quarter of families have very little liquidity.10
How do liquid savings vary over the business cycle?
Figure 1 plots the share of families with at least $400 over time since 2004. This share reached a low point in 2010, consistent with the Great Recession depleting family savings. But it rebounded in 2013 and 2016, consistent with the growing economy and stronger labor market helping families rebuild their savings cushions.11
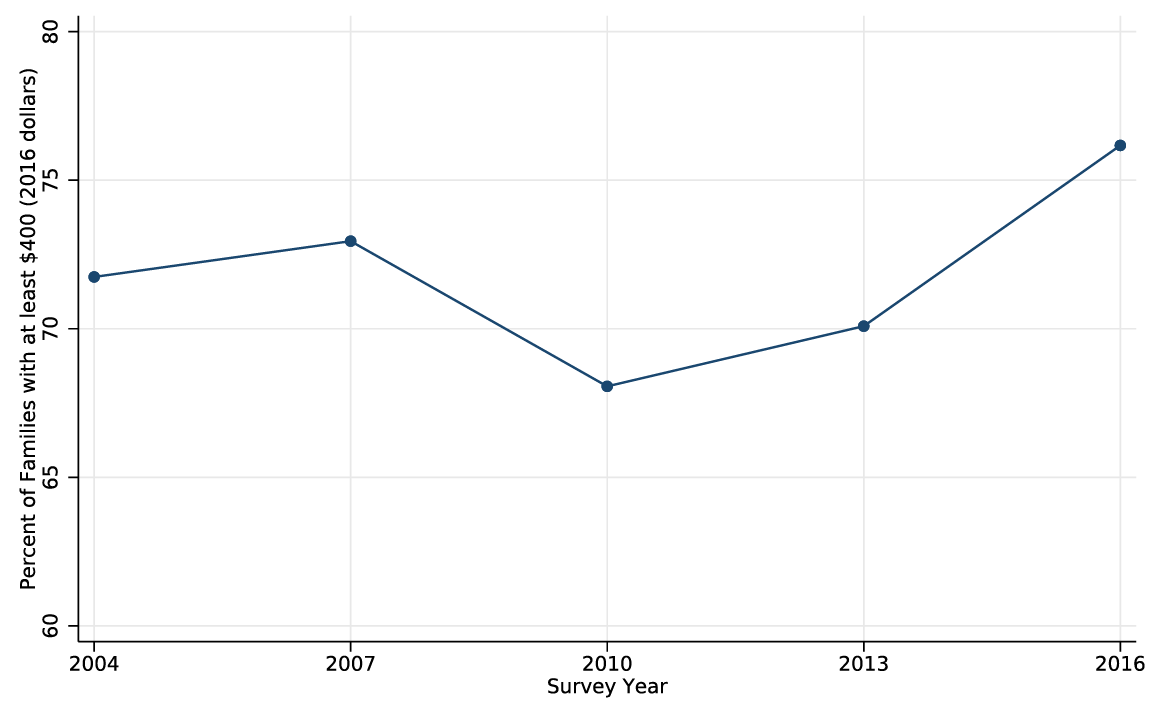
Source: Survey of Consumer Finances.
How many families have liquid savings of three to six months of their own expenses?
Our next exercise is to consider various rules of thumb for saving by expressing liquidity in terms of months of a family's own recurring expenses. Figure 2 shows the distribution of liquid savings in terms of months of expenses.12 For any given value on the horizontal axis, the graph shows our estimate of the share of families that have liquid savings of at least that many months of expenses. We highlight the values at two rules of thumb for saving: three months and six months. The graph indicates that only about 40 percent of families have liquid savings equal to three or more months of expenses, and just 28 percent have more than six months.13
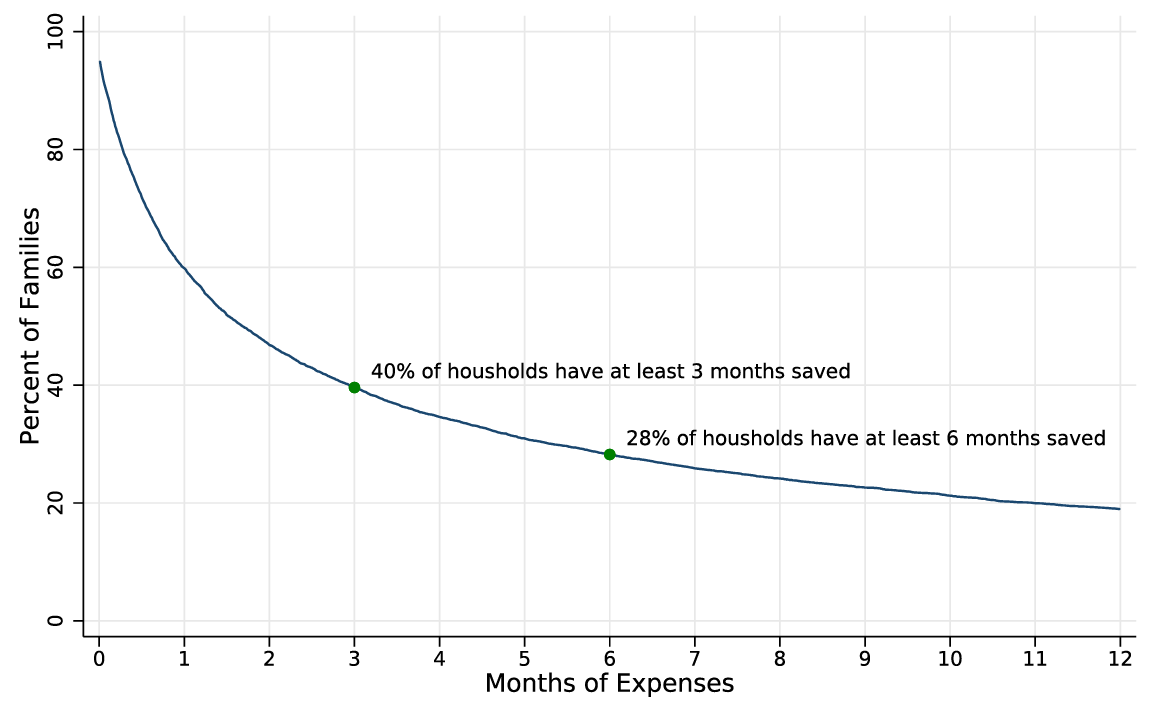
Source: Survey of Consumer Finances, 2016.
Liquidity by family characteristics
Table 1 shows how liquid savings vary across different types of families. First, we explore how liquidity varies with family income. The measure of income used here is "usual income," which describes a family's income in a usual year and smooths away temporary income fluctuations, such as those from an unexpected bonus or layoff. Focusing on the first column, we estimate that only about half of families in the lowest usual income quartile have at least $400 in liquid savings, while nearly all families (96 percent) in the highest usual income quartile have at least $400. But a significant fraction of families in the middle two quartiles do not have at least $400. Thus, among the nearly one-quarter of families overall found to lack $400, almost half come from outside the bottom quartile of normal income.
Turning to the second and third columns, many families across the income distribution do not have at least three or six months of expenses in liquid savings. Even in the top quartile of normal income, we estimate that almost one-third of families do not have at least three months, and nearly half do not have at least six months.
Table 1 indicates, perhaps surprisingly, that the likelihood of having at least $400 is similar across the age distribution. Larger differences by age arise in columns 2 and 3. Only 29 percent of families where the household head is under age 35 are found to have at least three months of expenses, while 50 percent of families over age 55 have at least three months of expenses.
Finally, table 1 also describes liquidity by family status. The majority of families with children do not have three months of expenses. Most notably, single parents have especially low levels of liquidity. For example, we find that just 15 percent of single parents have at least 3 months of expenses and more than 40 percent do not have $400.
Table 1: Liquid savings by selected characteristics of families
| At least $400 | At least 3 months saved | At least 6 months saved | |
|---|---|---|---|
| All Families | 76% | 40% | 28% |
| Usual Income | |||
| Quartile 1 | 51% | 17% | 11% |
| Quartile 2 | 72% | 31% | 20% |
| Quartile 3 | 86% | 43% | 28% |
| Quartile 4 | 96% | 68% | 54% |
| Age Group | |||
| Under age 35 | 73% | 29% | 16% |
| Age 35-55 | 75% | 33% | 21% |
| Over Age 55 | 79% | 50% | 39% |
| Family Status (under 55 only) | |||
| Single without Children | 72% | 34% | 22% |
| Married without Children | 78% | 34% | 21% |
| Married with Children | 79% | 35% | 21% |
| Single with Children | 59% | 15% | 8% |
Data Source: Survey of Consumer Finances, 2016
Other ways to cope with unexpected expenses: quasi-liquid savings in the SCF
In addition to liquid savings, some families have savings in "quasi-liquid" accounts, like account-type retirement plans (401k or IRA), certificates of deposit or savings bonds, or cash-value life insurance accounts. This type of savings can be accessed if needed, but there may be limitations, penalties, or taxes that have to be paid. Quasi-liquid savings, as opposed to liquid savings, may be optimal for some families. For example, if families have stable incomes and expenses, they may decide that the higher returns typically offered by such quasi-liquid accounts outweigh any potential fees or penalties. Recent research has documented that many households borrow from their retirement accounts (e.g. Beshears et al. 2011), although whether this behavior is optimal for all of the families who do so, or is instead the result of mistakes in financial planning, is not clear.
Figure 3 displays the distribution of quasi-liquid assets (again, in terms of families' own recurring expenses), separately for families with liquid savings of less than three months of expenses (the blue line) and at least three months of expenses (red line). This figure indicates that families with relatively low liquid savings tend to also have relatively low quasi-liquid savings, and vice versa. About half of the families with less than three months in liquid savings have no quasi-liquid savings at all, and nearly 70 percent have less than three months. That said, close to one-in-five families with less than three months in liquid assets have quasi-liquid assets in excess of one year's worth of expenses, which might reflect some families prioritizing saving in quasi-liquid accounts over saving in liquid accounts.
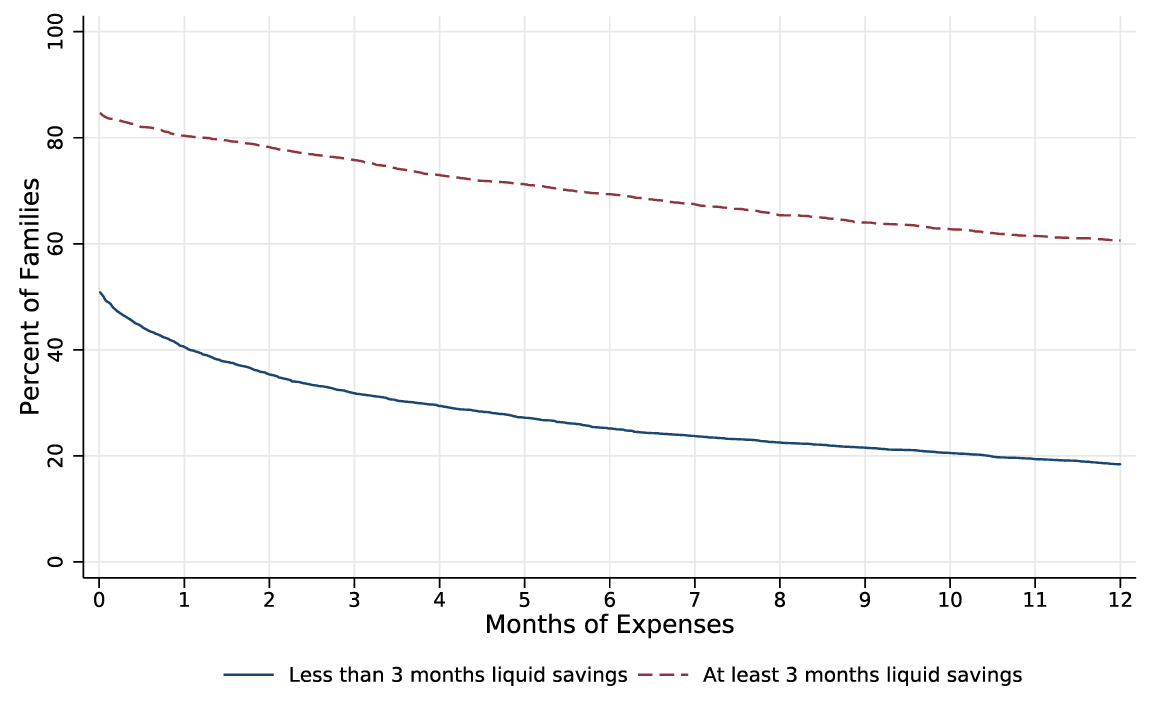
Source: Survey of Consumer Finances, 2016.
Concluding remarks
Families need to save for a variety of reasons. Research and public policy has often focused on saving for long run events such as retirement. But families need savings for both long and short horizons. In this note, we add to the literature on households' liquid assets that could be used to help deal with unexpected expenses and short-term disruptions to income. Using the 2016 SCF data, we find that nearly one-quarter of families have less than $400 in available liquidity and therefore may be highly vulnerable to income or expense shocks. Furthermore, while financial planners often recommend having a liquid savings cushion of at least 3 months of expenses, we find that about 60 percent of families do not satisfy this rule of thumb, including most married families with children and even many high income families.
References
Beshears, John, James J. Choi, David Laibson and Brigette Madrian (2012). "The Availability and Utilization of 401(k) Loans," in Wise, David A. ed., Investigations in the Economics of Aging Cambridge, MA: National Bureau of Economic Research, pp. 145-172.
Board of Governors of the Federal Reserve System (2017). Report on the Economic Well-Being of U.S. Households in 2016.
Bricker, Jesse, Lisa J. Dettling, Alice Henriques, Joanne W. Hsu, Lindsay Jacobs, Kevin B. Moore, Sarah Pack, John Sabelhaus, Jeffrey Thompson, and Richard A. Windle (2017). "Changes in US Family Finances from 2013 to 2016: Evidence from the Survey of Consumer Finances," Federal Reserve Bulletin 103: pp 1-80
Dettling, Lisa J., Sebastian J. Devlin-Foltz, Jacob Krimmel, Sarah J. Pack, and Jeffrey P. Thompson (2015). "Comparing Micro and Macro Sources for Household Accounts in the United States: Evidence from the Survey of Consumer Finances," Finance and Economics Discussion Series 2015-086.
Gabler, Neal (2016). "The Secret Shame of Middle-Class Americans" The Atlantic. Accessed at: https://www.theatlantic.com/magazine/archive/2016/05/my-secret-shame/476415/
Henriques, Alice M., and Joanne W. Hsu (2014). "Analysis of Wealth Using Micro and Macro Data: A Comparison of the Survey of Consumer Finances and Flow of Funds Accounts," in Jorgenson, Dale W., J. Steven Landefeld, and Paul Schreyer eds., Measuring Economic Sustainability and Progress, Studies in Income and Wealth, vol. 72. Cambridge, MA: National Bureau of Economic Research, pp. 245-274
Kaplan, Greg, Giovanni L. Violante and Justin Weidner (2014). "The Wealthy Hand-to-Mouth," Brookings Papers on Economic Activity, Spring 2014.
Larrimore, Jeff, Maximilian Schmeiser, and Sebastian Devlin-Foltz (2015). "Should You Trust Things You Hear Online? Comparing SHED and Census Bureau Survey Results," FEDS Notes, October 15, 2015.
Lusardi, Annamaria, Peter Tufano and Daniel Scheider (2011). "Financially Fragile Households: Evidence and Implications," Brookings Papers on Economic Activity, Spring 2011.
Pence, Karen (2011). "Comment on 'Financially Fragile Households: Evidence and Implications,'" Brookings Papers on Economic Activity, Spring 2011.
Sabelhaus, John, David Johnson, Stephen Ash, David Swanson, Thesia I. Garner, John Greenlees, Steve Henderson. (2015) "Is the Consumer Expenditure Survey Representative by Income?" in Improving the Measurement of Consumer Expenditures, Carroll, Crossley, and Sabelhaus.
1. Research assistance provided by Jackie Blair Return to text
2. For example, see https://investor.vanguard.com/emergency-fund/. Return to text
3. The 2017 Survey of Household Economics Decisionmaking (SHED) finds that about 40 percent of Americans would not cover an unexpected $400 expense using cash or its equivalent, and would instead borrow, sell something or be unable to finance the expense. (Board of Governors, 2017). In related work, Lusardi, Schneider, and Tufano (2011) find that nearly half of families in the U.S. say they probably could not manage a $2000 expense. However, using Survey of Consumer Finance data, Pence (2011) finds that a much smaller fraction families could not cope with a $2000 expense shock. Return to text
4. Our work is also related to Kaplan et al. (2014), which uses the SCF data to estimate how many families have very limited liquid wealth relative to their income despite having substantial illiquid wealth. Return to text
5. See Bricker et al. (2017) for more details on the SCF data. Return to text
6. Estimates from SHED on how few American families would pay a $400 emergency expense out of liquid savings have garnered considerable attention (for example, see Gabler 2016), as they raise serious concerns about the financial vulnerability of households. Return to text
7. We do not subtract out revolving credit or store card debt to construct our measure of liquid savings (as was done in Kaplan et al, 2014). We do this because we are interested in the amount of liquid assets a family could draw on in an emergency at a given point in time, rather than the concept of net "liquid wealth." If we do subtract this debt, we find that 69 percent of families have $400 in "liquid wealth." Return to text
8. Mortgage payments, rental payments, property taxes, home insurance, condo fees, vehicle lease and loan payments, student loan payments, credit card payments, other debt payments, and spending on food are reported in the SCF and represent two-thirds of our estimate of total monthly recurring expenses. We also add in the following estimated expenses, which represent one-third of total recurring expenses: utilities (electric, water, gas, etc.) equal 0.5 percent of the home value for homeowners annually, or 10 percent of rent for renters, unless the rent includes some (all) utilities, in which case it is 5 percent (nothing) of rent; home insurance, if not included in the mortgage payment, equals 0.5 percent of the home's value annually; internet and cable television equal $100 per month; cell phone expenses equal $50 a month per family member over age 16; housing maintenance for home owners equals 1 percent of the home's value, annually; vehicle maintenance equals $500 a year per vehicle; gas equals $1000 per year per adult family member; and car insurance equals $800 per year for one car and an additional $600 per year for each additional car. Health costs reflect average health insurance costs, drug costs and medical supply costs reported by the Bureau of Labor Statistics from their Consumer Expenditure Survey (CEX), by family size and family age. Only SCF families that report paying insurance costs are given the CEX average health insurance amount, which we inflate by group to account for zeros from families that do not pay for health insurance (typically because they are enrolled in government-provided insurance). This procedure implies that mean total monthly expenses in 2016 are $3105, which is extremely similar to mean CEX monthly expenses (excluding durables), which are $3016 in 2016. The estimates for the SCF and CEX also line up well for most of the income distribution. The exception is the very top of the distribution, where SCF expenses are much higher than CEX expenses, likely because the CEX has been shown to lack representation of the highest income families, whereas the SCF has coverage of whole distribution, including the very top (Sabelhaus et al., 2015). Return to text
9. More precisely, using data for groups (1) and (3), we regress a dummy variable for having $400 on the "saved last year" indicator, and use the estimated coefficient on "saved last year" to predict the probability that a family in group (2) has $400. Return to text
10. This adjusted SCF estimate exceeds the 56 percent of Americans who indicate they would cover an unexpected $400 expense with liquid savings in the 2016 SHED. We expect the SHED number to be the same or smaller than the SCF number, which describes the share of families that could cover an unexpected $400 expense with liquid savings. If we subtract out credit card debt to compute net liquid wealth, our adjusted estimate of the fraction of families with at least $400 drops to about 60 percent. Return to text
11. The SCF also collected information on prepaid cards for the first time 2016, so liquidity may have been undercounted in previous surveys. Return to text
12. For this exercise, we do not attempt to adjust for liquidity that may be earmarked for upcoming expenses. Thus, these estimates of liquid savings may be somewhat optimistic. Return to text
13. Notably, the SHED asks respondents whether they have an "emergency or rainy day fund" that would cover three months of expenses. In 2016, 48 percent of respondents said they have set aside an emergency fund of at least three months of expenses. Return to text
Bhutta, Neil, and Lisa Dettling (2018). "Money in the Bank? Assessing Families' Liquid Savings using the Survey of Consumer Finances," FEDS Notes. Washington: Board of Governors of the Federal Reserve System, November 19, 2018, https://doi.org/10.17016/2380-7172.2275.
Disclaimer: FEDS Notes are articles in which Board staff offer their own views and present analysis on a range of topics in economics and finance. These articles are shorter and less technically oriented than FEDS Working Papers and IFDP papers.