FEDS Notes
November 03, 2023
Assessing the Extent of Trade Fragmentation
Justin R. Pierce and David Yu *
Introduction
Globalization increased steadily for decades following the end of World War II, with trade as a percentage of global GDP rising from 20 percent in the early post-war period to nearly 60 percent just before the Global Financial Crisis (GFC) (Aiyar et al., 2023). Since the GFC, however, this move toward globalization has stalled, and recent events—U.S.-China trade tensions, the Covid-19 pandemic, and the Russian invasion of Ukraine—have raised the prospect of a reversal. One way that this reversal could occur is via "fragmentation" of trade into blocs of aligned countries. Indeed, in a recent speech, Secretary of the Treasury Janet Yellen called for a movement toward "friend-shoring", a process that entails ensuring that U.S. supply chains are based in "trusted countries" (U.S. Department of the Treasury, 2022). The implications of fragmentation are important as potential improvements in supply chain reliability may be accompanied with decreases in aggregate output (Javorcik et al., 2022; Georgieva, 2023) or inflation pressures (Lagarde, 2023).
Trade fragmentation could occur either because of perceived risks of future disruption of trade or in response to past events. In this note, we consider each of these channels, with a focus on trade involving the U.S. and China.1 We begin with a broad assessment of the extent of fragmentation currently visible in global trade flows. We find that while U.S.-China bilateral trade exhibits clear signs of a shift apart (Bown, 2022a; Freund et al., 2023; Alfaro and Chor, 2023), the available data show little evidence for widespread friend-shoring or realignment of trade along the lines of geopolitical blocs.
Next, we examine behavior of U.S. imports in advanced technology products (ATPs), which—due to their strategic nature—may be at higher risk of disruptive policy changes, and therefore more prone to fragmentation. We find that the decline in the intensity of U.S. imports from China is more pronounced for these goods. As in aggregate trade flows, however, this shift away from Chinese-sourced ATPs is primarily concentrated in the U.S., and not a broader group of aligned countries.
One potential explanation for the decline in U.S. imports of ATPs from China is that they were more affected by the tariffs imposed by the U.S. on goods from China since 2018. We examine U.S. imports from China by tariff and ATP status and find that both factors are associated with declines in import shares. The relevance of both factors suggests that U.S.-China trade is being affected both by events that have already occurred (tariffs), as well as the risk of future actions (which are likely to apply more to ATPs).
Worldwide Trade Flows
In this section, we examine the extent of trade fragmentation currently visible in global trade flows. We find that while the U.S. and China show clear signs of decreasing their reliance on one another, the available data offer little evidence for widespread friend-shoring or realignment of trade along geopolitical lines.
For this exercise, we use annual bilateral country-level imports from 2016 through 2022, taken from UN Comtrade.2 Consideration of this period allows us to observe how trade has evolved during events such as the U.S.-China trade war and the Covid-19 pandemic. We note, however, that our data end in 2022, and the longer-term effects of both events could differ from what has been observed thus far.3
We track shifts in trade reliance between country groups over time in Figure 1, which reports the indexed annual share of imports sourced from China (left) and the U.S. (right), for selected countries.4 We use country trade shares instead of trade values because shares highlight shifts in proportions of imports sourced from different countries, even as the nominal value of overall trade varies from year to year. Indexing allows for easier comparison across countries; actual import shares are provided in the notes for Figure 1.
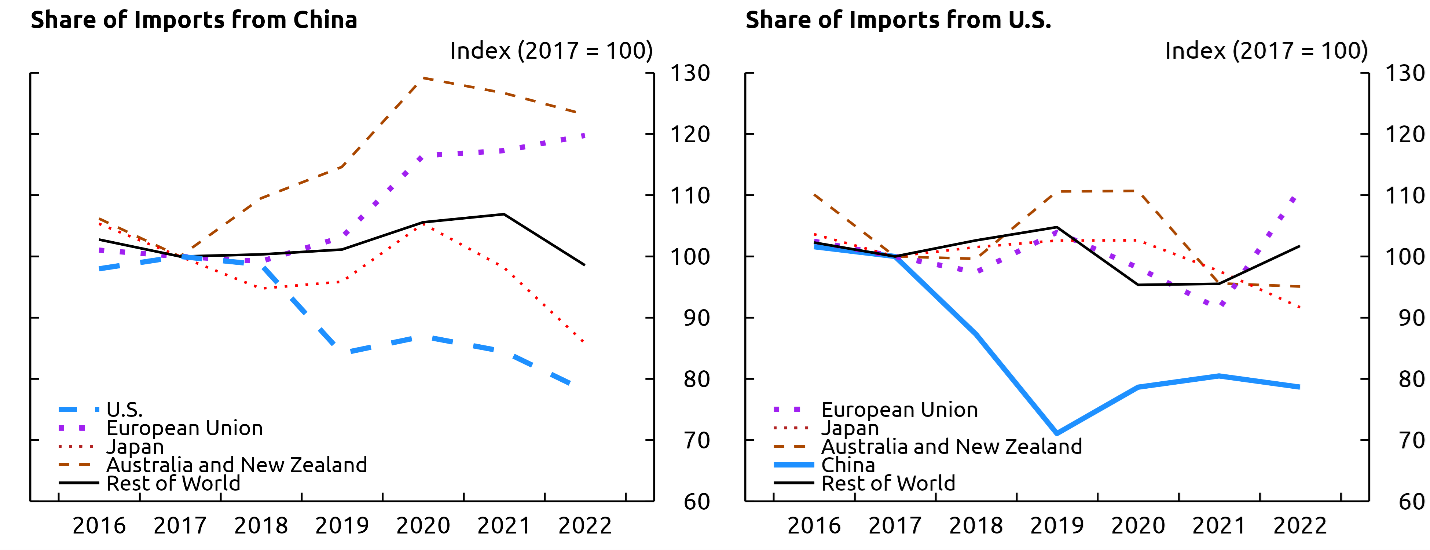
Note: The left panel displays the annual share of imports from China, for selected countries, with each country's Chinese import share indexed to be 100 in 2017. The level of import shares from China across countries varies substantially. The share of imports from China in 2016 (2022) was 23% (26%) for Australia and New Zealand, 8% (10%) for the European Union, 26% (21%) for Japan, 21% (17%) for the U.S., and 19% (19%) for the rest of the world. The share of imports from the U.S. (right panel) in 2016 (2022) was 11% (10%) for Australia and New Zealand, 9% (7%) for China, 6% (6%) for the European Union, 11% (10%) for Japan, and 13% (13%) for the rest of the world. When aggregating countries into the Rest of World group for this figure, we include a country only if it has reported imports for every year in the sample, in order to maintain a consistent baseline. EU trade data exclude Gibraltar.
Source: UN Comtrade.
The figure highlights a substantial reallocation of trade flows between the U.S. and China. The left panel shows that the U.S. has become less reliant on imports from China since the levying of bilateral tariffs in 2018, consistent with findings in Nicita (2019), Freund (2023), and others. A more subtle shift is also present for Japan, concentrated in 2022. However, over the same period, the EU and Australia and New Zealand have increased their reliance on China, as measured by import shares.
In the right panel, the share of Chinese imports sourced from the U.S. has declined, mirroring the left panel. By contrast, some U.S. allies—the EU, Japan, and Australia and New Zealand—have maintained roughly similar shares of imports from the U.S. since 2016, as have other countries.
In sum, Figure 1 points to a clear reallocation of U.S.-China trade since the imposition of tariffs in 2018. However, given the sustained—or even increased—reliance on imports from China among some U.S. allies, we do not find strong support for fragmentation of trade into geopolitical blocs.
Strategic Sectors
Next, we examine trade in strategic sectors (ATPs) that might be more responsive to increases in geopolitical risk (Caldara and Iacoviello, 2022), and therefore more prone to fragmentation. We find that strategic sectors play a large role in the decline of U.S. imports from China. However, we find that this decline in reliance on imports of strategic goods from China is largely isolated to the U.S.
We define strategic goods to be the set of goods defined as ATPs by the U.S. Census Bureau.5 Examples of ATPs include semiconductors, nuclear technology, and pharmaceutical products. Over the sample period, about 20% of global trade (by dollar value) is in ATPs.6
ATPs might be more prone to trade fragmentation for at least two reasons. First, they may be more specialized, on average, than non-ATPs, implying that they would be less substitutable with other goods in a crisis. We examine this possibility using Rauch (1999)'s classification of goods by categories of differentiation. As shown in appendix A, we find that ATPs tend to be disproportionately differentiated goods, which Broda and Weinstein (2006) show are less substitutable than the more homogeneous goods traded on organized exchanges. As such, firms may be more likely to take pre-emptive steps to secure supply chains of ATPs in instances when geopolitical risk is increasing. Second, given that ATPs include goods critical to national, military, and economic security, they face higher risks of governments imposing restrictions on their trade. Indeed, the U.S. government has recently imposed new restrictions on exports to China of some ATPs, including semiconductors, and many governments imposed restrictions on the export of medical supplies at the onset of the Covid-19 pandemic (Bown, 2022b).
Figure 2 displays indexed import shares from China for the U.S., Japan, and the rest of the world (ROW) for ATP and non-ATP goods. As shown in the figure, U.S. imports of ATPs (solid blue line) decrease by much more than U.S. imports of other goods (dashed blue line). In other words, while the U.S. experienced an overall decline in the share of imports from China (as shown in Figure 1), the change is much more apparent in ATPs. Among individual ATP categories (not shown), the decline in U.S. import share is primarily driven by a decline in the Information and Communications category.
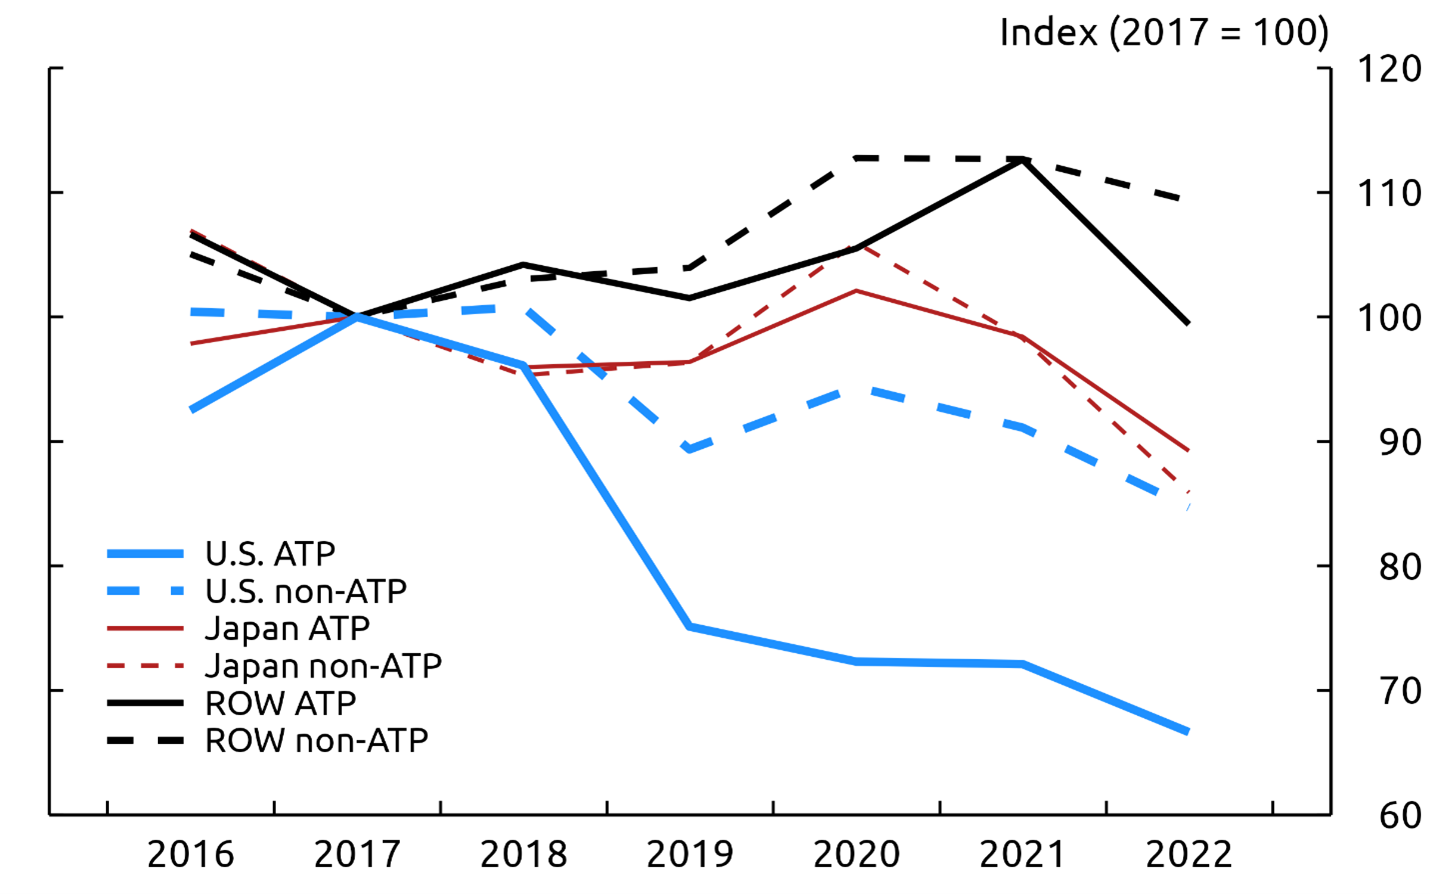
Note: Figure displays the share of imports from China for ATP and non-ATP goods, indexed to be 100 in 2017, for selected countries.
Source: UN Comtrade.
Although Japan showed some evidence of a shift away from Chinese imports in Figure 1, the data for Japan (red lines) do not indicate a differential response for ATPs. The same is true for the rest of the world, shown in the black lines. Therefore, while examining strategic sectors yields more details about U.S. fragmentation from China, it does not uncover additional evidence of fragmentation among other countries. This lack of a response for other countries could be because firms perceive the risk of restrictions on ATPs to be most salient for U.S.-China trade.
U.S.-China Trade: Tariffs and ATPs
While ATPs may be particularly susceptible to geopolitical risk, and therefore to trade fragmentation, it is well known that trade flows also responded to the economic forces arising from U.S-China tariffs (Freund, 2023). It's possible, therefore, that the decrease in imports of ATPs from China in Figure 2 may actually be the result of tariffs if they tended to be imposed disproportionately on ATPs. In this section, we account for the presence of tariffs within ATPs and non-ATPs to consider how each characteristic affects U.S. imports from China. We find that both tariffs and ATP status are linked to declines in the share of U.S. imports coming from China.
To examine the role of tariffs, we use data on U.S. imports from the U.S. International Trade Commission (USITC), which are available at the HTS10 level, and once again consider the sample period 2016 to 2022.7 We use two criteria to separate goods: whether or not a good is an ATP, and whether or not the good has faced additional tariffs on U.S. imports from China since 2018. This creates four distinct groups, which we examine in terms of indexed import shares, as before. We compare import changes pairwise within these four groups, which allows us to explore the interaction of tariff status and ATP status.
Figure 3 shows indexed shares of U.S. imports from China, disaggregated by both tariff status and ATP status into these four categories. We find that being in an ATP category is correlated with a decrease in U.S. import share from China, regardless of tariff status. Consider first just the two lines covering goods subject to tariffs (green lines). Since the ATP (solid green) line decreases by more than the non-ATP (dashed green) line, ATP status is associated with a larger drop in import shares from China within the set of goods subject to tariffs. While ATPs may be subject to higher tariff rates than non-ATPs, which could account for their larger decline in imports, clearer evidence of a distinct reaction for ATPs can be found by examining the brown lines, which display products that are not subject to tariffs. Here, once again, we find that imports of ATPs drop more than non-ATPs. In sum, U.S. firms appear to be shifting imports of ATP goods away from China, independent of tariff status.
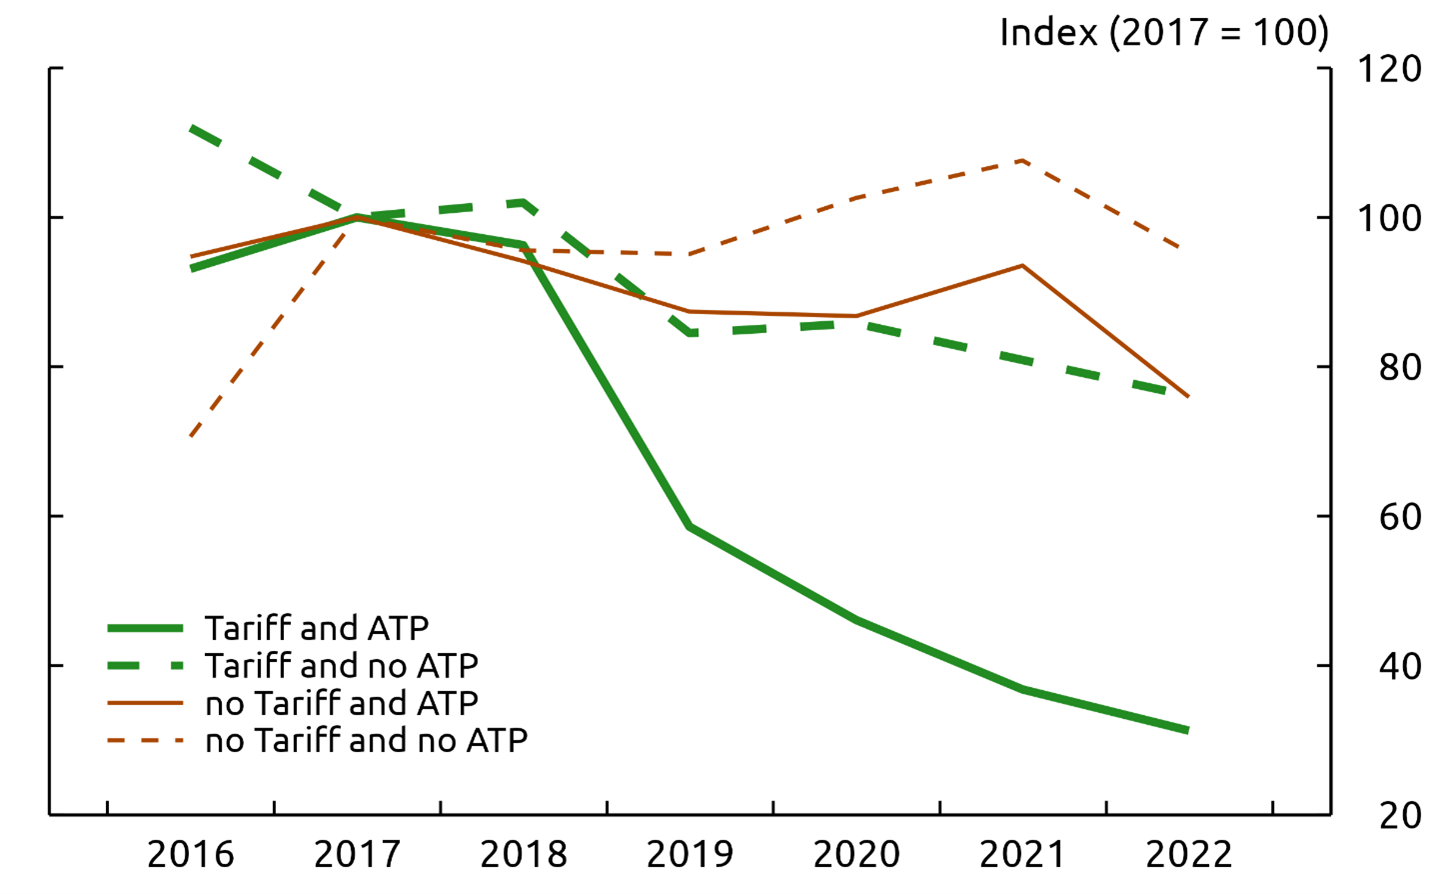
Note: Figure displays the share of U.S. imports from China, indexed to be 100 in 2017, for four categories of goods based on whether they are ATPs and whether they were subject to additional tariffs on U.S. imports from China since 2018.
Source: USITC.
We also find that if a good is subject to a new tariff on imports from China, its Chinese import share decreases, regardless of whether the good is an ATP. Observing only the two ATP (solid) lines reveals that having an import tariff is linked to lower import shares. A similar decline in imports for goods subject to tariffs is apparent when comparing the two non-ATP (dashed) lines. Overall, the steepest declines occur for ATPs that are subject to tariffs (solid green), whereas the Chinese import share of non-ATPs not subject to tariffs hardly declines (dashed brown).
In sum, these straightforward pairwise comparisons indicate that both ATP status and tariff status are correlated with decreases in the share of U.S. imports from China.8 This finding is important not only because it clarifies the reasons for shifting trade flows, but also because ATPs and tariffs reflect different potential causes of trade fragmentation. Namely, tariff-related fragmentation is a reaction to a realized policy change, while fragmentation among ATPs—independent of tariff status—relates more to the anticipation of potential future policy changes.
Conclusion
In this note, we consider the extent of trade fragmentation observable in bilateral trade flows, a topic of considerable importance given the potential benefits and costs associated with this phenomenon. Using annual bilateral trade data, we find some evidence of fragmentation—particularly with respect to U.S.-China trade—but do not see clear evidence of a broader split in global trade into separate blocs. We then use the U.S. Census Bureau's list of Advanced Technology Products as a proxy for strategic sectors and find that, between the U.S. and China, trade has fragmented more for ATPs than non-ATPs. We also examine U.S. import tariffs and find that both tariffs and ATP status are associated with decreases in the share of U.S. imports coming from China.
References
Aiyar, S., J. Chen, C. H. Ebeke, R. Garcia-Saltos, T. Gudmundsson, A. Ilyina, A. Kangur, T. Kunaratskul, S. L. Rodriguez, M. Ruta, et al. (2023). Geo-economic Fragmentation and the Future of Multilateralism. International Monetary Fund.
Alfaro, L. and D. Chor (2023, September). Global Supply Chains: The Looming "Great Reallocation". Working Paper 31661, National Bureau of Economic Research.
Bown, C. (2022a). Four Years Into the Trade War, are the US and China Decoupling. Working paper, Peterson Institute for International Economics.
Bown, C. P. (2022b). How COVID-19 Medical Supply Shortages Led to Extraordinary Trade and Industrial Policy. Asian Economic Policy Review 17 (1), 114–135.
Broda, C. and D. E. Weinstein (2006, 05). Globalization and the Gains From Variety*. The Quarterly Journal of Economics 121 (2), 541–585.
Caldara, D. and M. Iacoviello (2022, April). Measuring Geopolitical Risk. American Economic Review 112 (4), 1194–1225.
Freund, C., A. Mattoo, A. Mulabdic, and M. Ruta (2023). Is US Trade Policy Reshaping Global Supply Chains?
Georgieva, K. (2023, January). Confronting Fragmentation Where It Matters Most: Trade, Debt, and Climate Action.
IMF (2023). World Economic Outlook, April 2023: A Rocky Recovery. USA: International Monetary Fund.
Jansen, M. (2023). Managing Supply Chain Disruptions - A Global Perspective, presentation to Conference on the Effects of New Geopolitical Risks on Financial Markets and Firms.
Javorcik, B. S., L. Kitzmueller, H. Schweiger, and A. Yıldırım (2022). Economic Costs of Friend-shoring.
Lagarde, C. (2023, April). Central Banks in a Fragmenting World.
Nicita, A. (2019). Trade and Trade Diversion Effects of United States Tariffs on China. Working paper, UNCTAD Research Paper No. 37.
Rauch, J. E. (1999). Networks Versus Markets in International Trade. Journal of international Economics 48 (1), 7–35.
U.S. Department of the Treasury (2022, April). Remarks by Secretary of the Treasury Janet L. Yellen on Way Forward for the Global Economy.
Appendix A: Rauch Classification
The Rauch (1999) classification system categorizes goods into one of three categories: homogeneous, reference priced, and differentiated. Goods in the first category are traded on an organized exchange with a known global price. Goods in the second category are not traded on an exchange, but still have a widely known global price. Goods in the third category have too many varieties to be traded on an exchange or to have a standardized price (for instance, shoes). Rauch (1999) then defines which goods belong to which categories, using two different strategies: liberal and conservative. The liberal strategy favors the differentiated category, placing borderline goods in that category, and fewer goods in the homogeneous category. The conservative strategy works in the opposite way, placing borderline goods into the homogeneous or reference priced category.
In Figure 4, we study the breakdown of U.S. imports in 2017 by Rauch (1999) category for ATP and non-ATP goods under either the conservative (first two bars) or liberal (last two bars) classification procedures. Red, blue, and green portions of the bars show the share of U.S. imports belonging to each of the three Rauch (1999) categories.
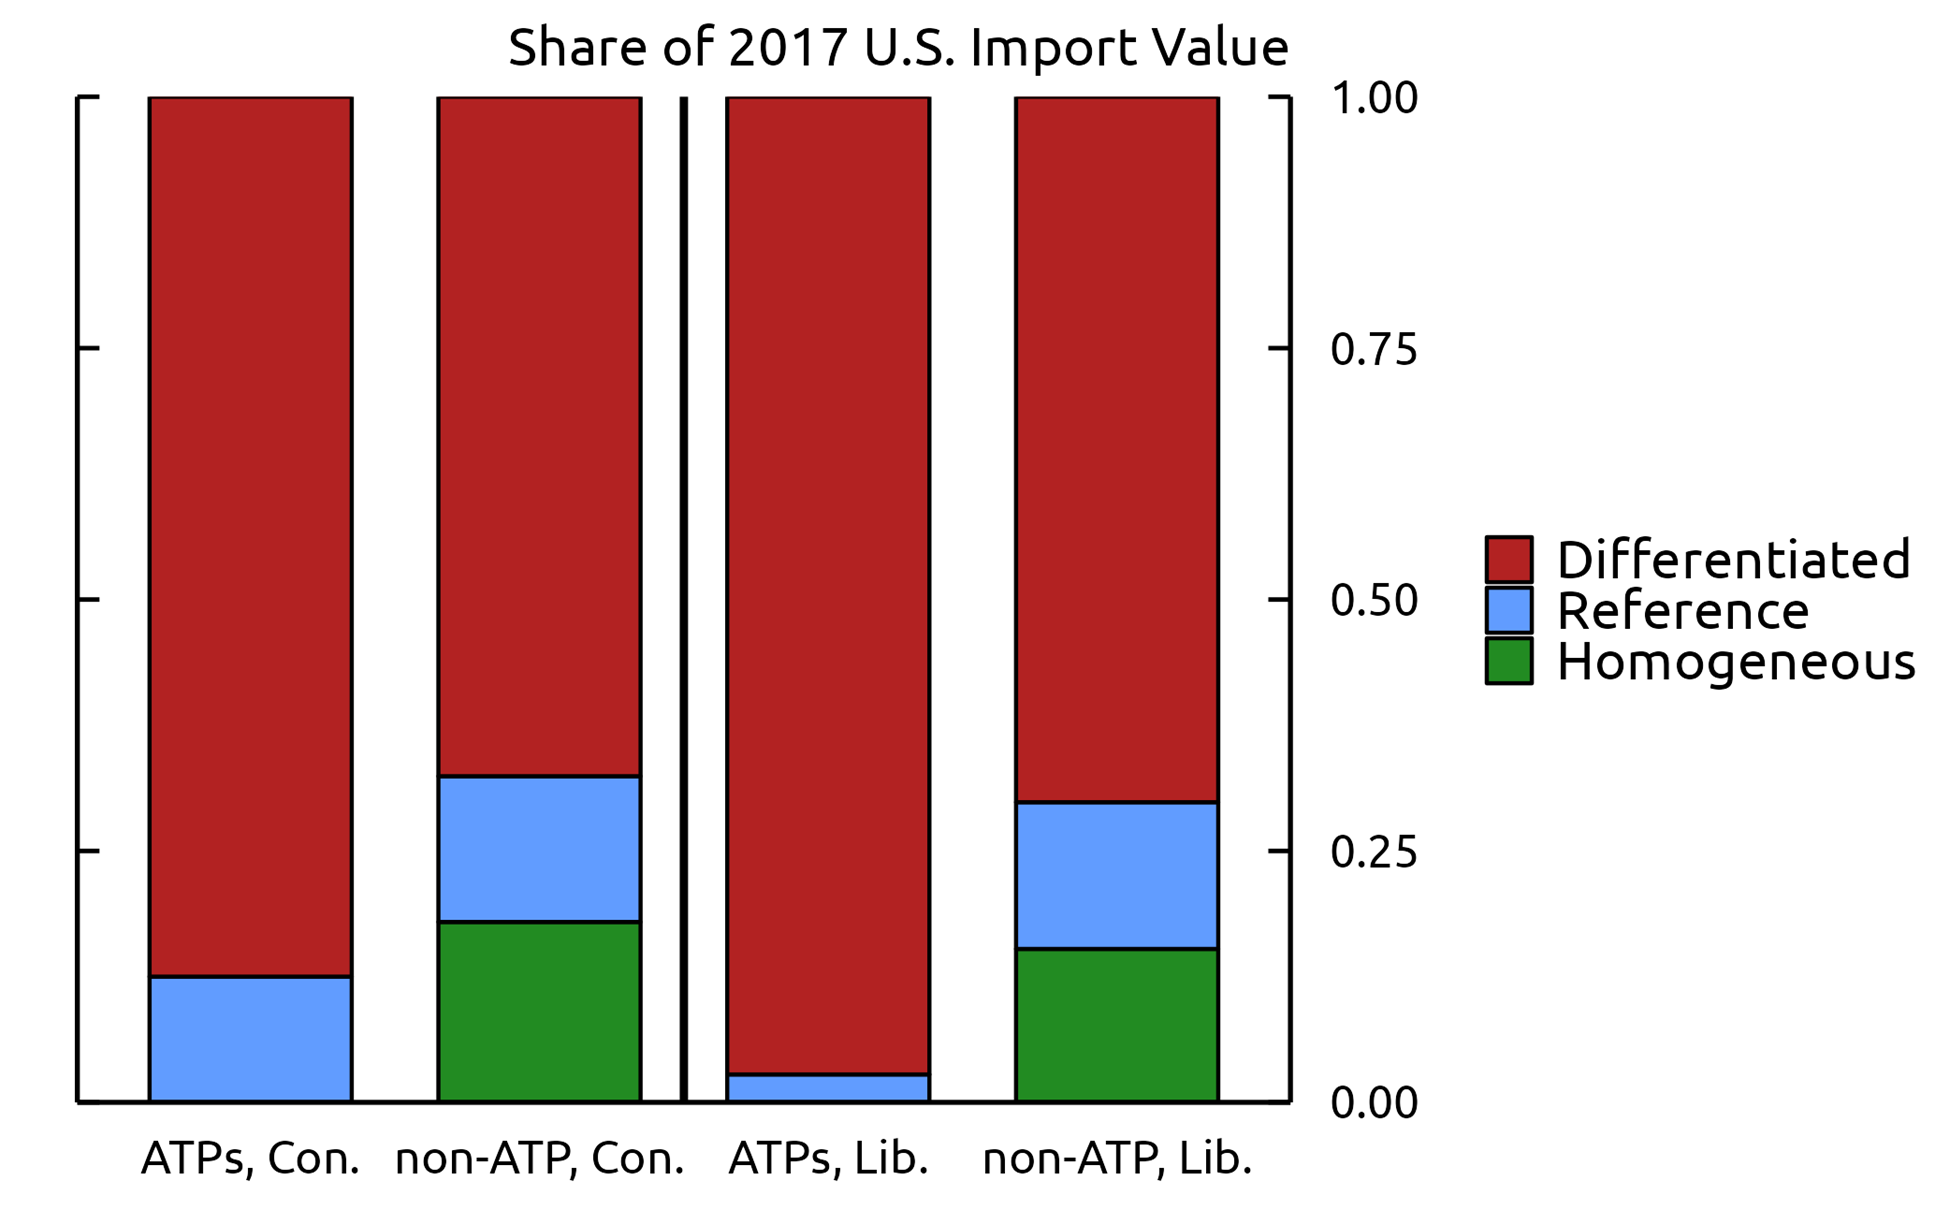
Note: Each bar shows, for a particular subset of 2017 HS codes, the share of 2017 U.S. imports belonging to each of the three Rauch categories. The left two bars use the conservative (con.) strategy, and partition the set of HS codes into ATPs and non-ATPs. The right two bars use the liberal (lib.) strategy and similarly partition HS codes into ATPs and non-ATPs. The key identifies bars in order from top to bottom.
Source: USITC.
Figure 4 shows that ATPs are disproportionately categorized as differentiated goods relative to non-ATPs. For instance, compare the conservative ATP bar (far left) and the conservative non-ATP bar (second from the left). No ATPs are traded on organized exchanges, and the share of import value in differentiated goods is over 10 percentage points greater for ATPs than non-ATPs. The two bars using the liberal classification scheme shows an even starker split. This result holds for the other years in our sample, and by share of HS codes, rather than share of US import value.
* Division of International Finance, Board of Governors of the Federal Reserve System. Pierce: [email protected], Yu: [email protected]. The views expressed in this paper are solely those of the authors and do not necessarily reflect the views of the Board of Governors of the Federal Reserve System. We thank Dario Caldara and Shaghil Ahmed for helpful comments. Return to text
1. With our focus being U.S.-China trade, we do not address potential fragmentation associated with other important events, such as the reallocation in trade in oil and natural gas that has occurred in response to Russia's invasion of Ukraine. Return to text
2. In some cases, we aggregate country-level imports together to form natural groupings. We do this for the EU (which includes the UK, in this case), and for Australia and New Zealand. Return to text
3. Jansen (2023), for example, argues that lagged and otherwise insufficient data may understate the extent of fragmentation. Return to text
4. In the literature—for example, Chapter 4 of the recent World Economic Outlook (IMF, 2023)—trade fragmentation scenarios typically consist of organizing countries into two blocs, led by the U.S. and China. Other countries are classified into these blocs according to their similarity of voting patterns on U.N. General Assembly Resolutions. To examine whether trade has fragmented along geopolitical lines, we choose countries that are usually classified as being close to the U.S. Return to text
5. This is an annually updated list of ten-digit U.S. Harmonized Tariff Schedule codes (HTS10s) partitioned into ten groups: biotechnology, life science, opto-electronics, information and communications, electronics, flexible manufacturing, advanced materials, aerospace, weapons, and nuclear technology. Return to text
6. The UN Comtrade data are at the HS6 level, while ATPs are HTS10. We define an HS6 to be an ATP if it contains any HTS10 which is an ATP. 98% of HS6 codes are either entirely made up of ATPs or have no ATPs at all. Return to text
7. The U.S. imported an annual average of about $500 billion worth of goods from China over this period, and about $2.6 trillion from the world (nominal USD). Roughly 20% of U.S. imports from the world is in ATPs. The share of U.S. imports from China in ATPs has declined from just over 30% in 2016 to about one quarter in 2022. Return to text
8. We note that this descriptive analysis does not control for other differences in product characteristics that may be present across these categories or differing pre-existing trends in U.S. imports. Return to text
Pierce, Justin R., and David Yu (2023). "Assessing the Extent of Trade Fragmentation," FEDS Notes. Washington: Board of Governors of the Federal Reserve System, November 03, 2023, https://doi.org/10.17016/2380-7172.3387.
Disclaimer: FEDS Notes are articles in which Board staff offer their own views and present analysis on a range of topics in economics and finance. These articles are shorter and less technically oriented than FEDS Working Papers and IFDP papers.