FEDS Notes
December 17, 2021
Bank Branches and COVID-19: Where are Banks Closing Branches during the Pandemic?
Kimberly Kreiss
In the decade prior to the COVID-19 pandemic, bank branches were closing at a steady rate. Additionally, households with a bank account increasingly adopted mobile or online banking for at least a portion of their banking needs. As COVID-19 dramatically changes the desire and willingness for consumers to have in-person interactions, it may accelerate both of these trends and lead to a permanent shift in how people access financial services. This note analyzes where bank branches closed during COVID-19 and provides a discussion of potential effects for consumers.
Using SNL's Bank Branch Analytics data, I show that bank branches for commercial banks, credit unions, savings banks, and savings and loan association banks have been steadily closing since 2011, reversing trends in previous years. Moreover, bank branches have closed at record rates during the COVID-19 crisis. Closures during COVID-19 have been concentrated in metropolitan areas, while there is little difference between low-to-moderate income (LMI) and middle-to-upper-income (MUI) areas.1 Lastly, the vast majority of closures had a branch nearby, though a small number of new "banking deserts"—census tracts that had no branch within a ten-mile radius of the center—were created as a result of these closures.
Pre-COVID-19 Trends
For this analysis, I use S&P Global Intelligence's SNL Branch Analytics data, a comprehensive dataset of bank branches that is updated daily and provides information on branches from company websites, filings, merger news and government sources.2 This dataset provides a fuller snapshot of the market than other branch data, such as the FDIC's Summary of Deposits data, by including additional institutions such as credit unions.3 Since these institutions offer consumer banking services, such as taking deposits and making loans, they are important in an analysis of bank branch closures and financial services access.
Following a period of strong branch growth, branches of commercial banks, credit unions, savings banks, and savings and loan associations have been steadily closing since 2011. Figure 1 shows the number of brick and mortar and full retail branches of institutions in the SNL sample for each year from 1990 to 2020. Between 1990 and 2008, bank branches increased steadily, barring a steep drop in the year 2000 that was likely due to a reporting change.4 Bank branches saw a slight decrease from 2008–2009, followed by a plateau, and since 2011, have steadily decreased (figure 1).
Figure 1. Number of Branches of Commercial Banks, Credit Unions, Thrifts, and Savings and Loan Association Banks, 1990-2020
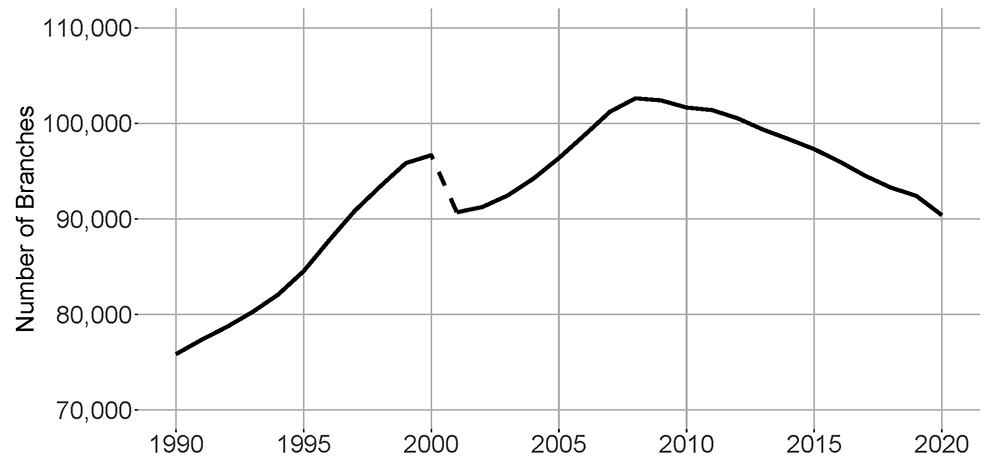
Note: Count reflects the number of branches as of the last day of each year.
Source: Author's calculations using S&P Global Intelligence, SNL Branch Analytics
Bank Branch Closures During COVID-19
COVID-19 represents a unique circumstance in that people may be reluctant or unable to conduct business face-to-face. Consequently, consumers may have increased interest in mobile or online banking options, and banks may subsequently be more inclined to offer these services. This is in line with trends in recent years, where consumers increasingly report higher usage of online or mobile banking services and banks have steadily closed branches.5 Given the unique nature of COVID-19, these trends may be even more pronounced because both banks and consumers have more incentive to adopt online or mobile banking services.
This could lead to a higher number of bank branch closures and a departure from pre-pandemic banking practices, potentially affecting access to financial services for consumers. Though there is currently no survey data that asks about consumers' banking usage during COVID-19 and thus no information that could confirm increases in online or mobile banking usage during COVID-19, SNL Branch Analytics data provides current information on branch closures through COVID-19. By observing this snapshot of bank branch supply, we can potentially observe banks' responses to changes in consumer behavior during the pandemic. Analyzing bank branch closures during COVID-19 is thus a useful starting point.
Bank branches have closed at high rates during the COVID-19 crisis. First, the total number of branches closed in 2020 exceeds both the number of branches closed during the most recent recession and the number of branches closed in any year between 2011–2019. Just under 3,700 branches shut their doors in 2020 compared with about 3,000 in the recent years with the next highest numbers of closures (2009 and 2017). Moreover, figure 2 shows the average number of closures for each month for the years 2011–2019 and three-month rolling averages for each month for both 2020 and 2021. The 2020 closures show a similar trend to previous years until late summer, followed by a large jump in closures starting in October 2020 and continuing through at least June 2021. Additionally, while total nonfarm private payroll employment has shown signs of rebounding, overall employment for the depository credit intermediation and commercial banking industry continued to decline (see figure 3), further corroborating trends in the S&P data.
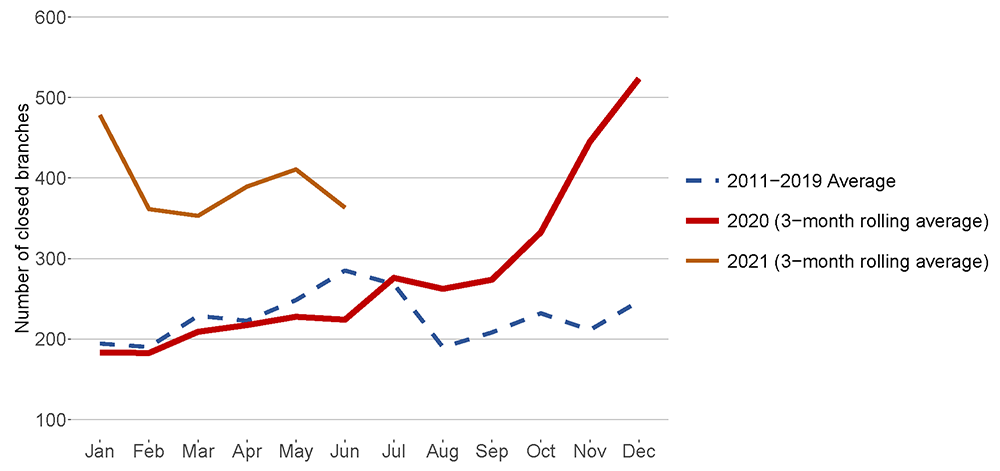
Note: Data is updated through June 2021
Source: Author's calculations using S&P Global Intelligence, SNL Branch Analytics
Figure 3. Indexed Total Nonfarm Private Payroll, Depository Credit Employees, and Commercial Banking Employees
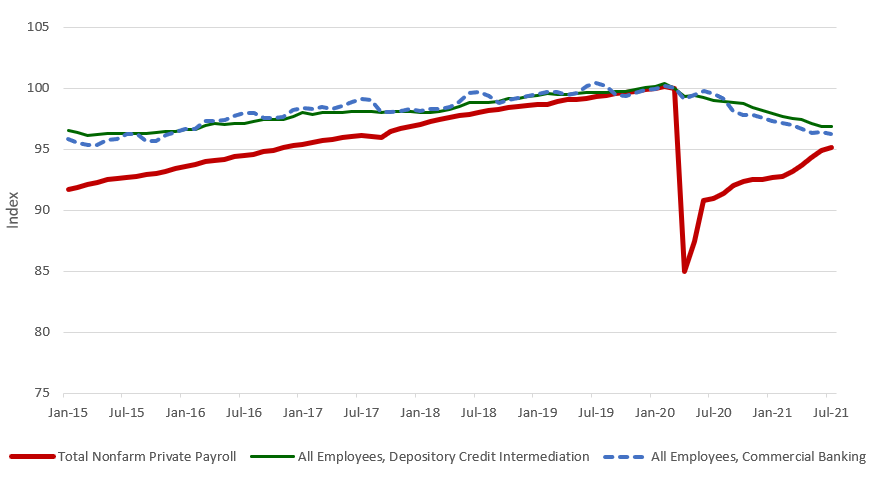
Note: Indexed to March 2021
Source: U.S. Bureau of Labor Statistics. Retrieved from FRED, Federal Reserve Bank of St. Louis.
Branch closures during COVID-19 have been concentrated in metropolitan areas, continuing a similar trend in previous years. At the end of 2019, 80% of branches were located in metropolitan areas, but during the COVID-19 crisis, 87% of branch closures occurred in metropolitan areas.6 Figure 4 shows the year-over-year net decline (after accounting for branch openings) in branches and the percent change in the number of branches by metropolitan and non-metropolitan designation.7 Since 2011, a majority of the net decline in branches have occurred in metropolitan areas, and the concentration of closures in metropolitan areas was particularly pronounced in 2020 (figure 4 panel A). In part, this reflects that most branches are in metropolitan areas. However, since 2014 the percent decline in branches in metropolitan areas has been greater as well. Panel B of figure 4 shows the percent decline in the number of branches.8 From 2019 to 2020, there was a 2.7 percentage point decline in branches in metropolitan areas (a rate of closure that is 1.5 percentage points faster than in 2019). In nonmetropolitan areas, the pace of closures also accelerated, although by a smaller amount. In these areas, there was a 1.7 percentage point decline in the number of branches in 2020, which was 0.9 percentage points faster than the rate of closure in the previous year.
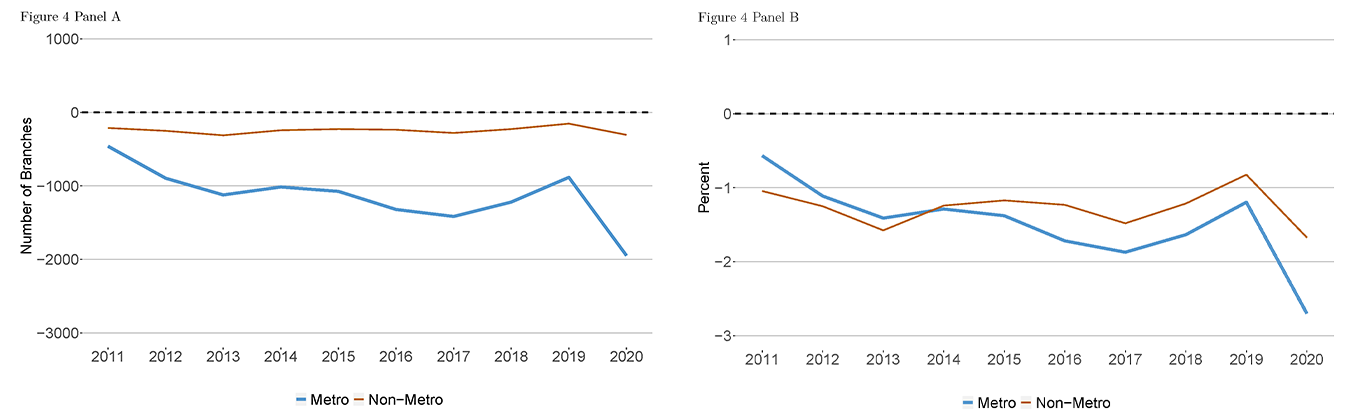
Source: Author's calculations using S&P Global Intelligence, SNL Branch Analytics
Unlike the differences seen by metropolitan status, branch closures during COVID-19 are not markedly different for LMI and MUI areas, and trends in previous years do not show a discernable pattern. The distribution of branch closures across LMI (22%) and MUI (78%) areas in 2020 and the first half of 2021 was similar to the distribution of open branches in LMI (24%) and MUI (76%) areas at the end of 2019.9 Figure 5 shows the year over year net change in the number of branches and the percent change in the number of branches by LMI designation. Though the net decline in branches has generally been smaller in MUI areas (figure 5 panel A), this simply reflects that LMI areas had fewer initial branches. The percent decline in the number of branches was larger in magnitude for LMI areas through 2015 and shows only small or no differences from that seen in MUI areas since then (figure 5 panel B).10 From 2019 to 2020, the pace of branch closures accelerated in both LMI and MUI areas. Although there was a larger decline in the number of branches in MUI areas, reflecting the pre-existing concentration of branches in those areas, the percent decline in branches in 2020 was similar across these geographies.
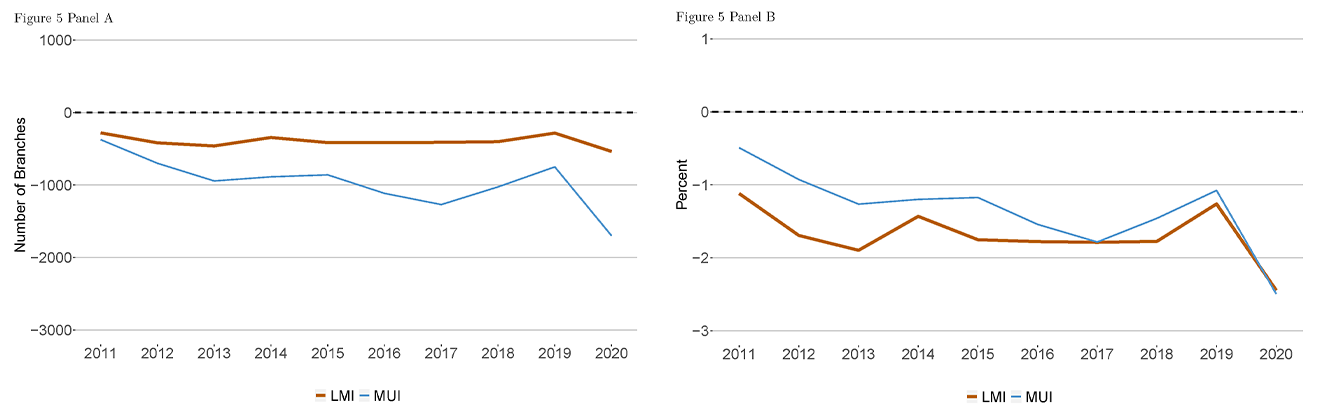
Source: Author's calculations using S&P Global Intelligence, SNL Branch Analytics
An additional metric for considering the effect of branch closures is whether there are any additional branches nearby. Table 1 shows the number of branch closure locations during COVID-19 that had at least one other branch within 10 miles. Overall, the results show that a large majority (78%) of branch closures had another branch within half a mile of the closure. When increasing the distance to one mile, the vast majority (90%) of branch closure locations had a branch within this distance. Only 34 of the 5,231 branch closures did not have another branch within ten miles. This follows a trend outlined by Dahl, Franke, and Fuchs (2021) that branch closures in recent years are concentrated in areas with branch duplication, rather than those depending on a single branch. Still, there are ramifications for consumers whose branch has closed. They may face the hassle of switching to another bank that may not be their preference or they may pay higher fees for services at a bank that is not their own.
Table 1: Number of Closures with at least One Nearby Branch
| Distance | Number of closures with at least one other branch within distance | Percent of closures with at least one other branch within distance |
|---|---|---|
| .5 miles | 4,086 | 78% |
| 1 mile | 4,683 | 90% |
| 2 miles | 4,973 | 95% |
| 5 miles | 5,098 | 97% |
| 10 miles | 5,197 | 99% |
Note: Total number of closed branches during covid is 5,231. Open branches include those that were opened either before COVID-19 and remained open, or opened during COVID-19 and were still open at the time of data retrieval (July 20, 2021).
Source: Author’s calculations using S&P Global, S&P Market intelligence
Nevertheless, a small number of closed branches resulted in a newly formed banking desert.11 By June 2021, there were 1,610 banking deserts, which contained an estimated 5.6 million people (1.7% of the total population), and an increase of 48 new deserts from 2019. Banking deserts (either preexisting or newly formed) are disproportionately likely to be in non-metropolitan areas and just under one quarter were considered low- or moderate-income tracts. Of those living in a banking desert, approximately 31% identify as a racial or ethnic minority.12 Figure 6 maps the locations of newly formed and preexisting banking deserts that remained banking deserts.13
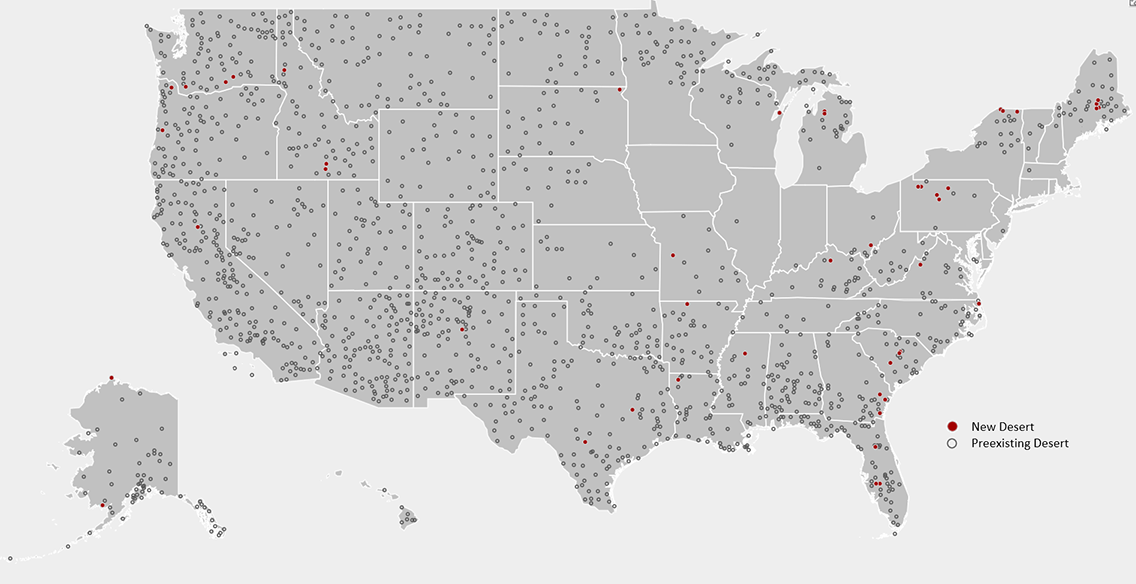
Note: Each point on the map corresponds to a tract centroid. Data is updated through July 20, 2021.
Source: Author's calculations using S&P Global Intelligence, SNL Branch Analytics and 2019 U.S. Census Bureau data.
Branches that closed during COVID-19 were disproportionately more likely to be branches of commercial banks and/or banks with large asset sizes. Over 90% of branches that closed during COVID-19 were branches of commercial banks, compared with 83% of commercial bank branches that were open at the onset of the pandemic. Almost 60% of branches that closed were branches of institutions with over $50 billion in assets, compared with 40% of branches of institutions of this size that were open at the start of COVID-19 (table 2). Table 2 shows the share of branches open at the start of COVID-19 and the share of branches closed during COVID-19 by institution type and asset size.
Table 2: Branches Open at the start of COVID-19 and Branch Closures during COVID-19 by Institution Type and Asset Size
| Share of branches open at the start of COVID-19 | Share of branches closed during COVID-19 | |
|---|---|---|
| Institution Type | ||
| Bank | 83% | 92% |
| Credit Union | 12% | 5% |
| Savings Bank | 3% | 2% |
| Thrift | 2% | 1% |
| Asset Size | ||
| <$1B | 26% | 8% |
| $1B-$10B | 22% | 17% |
| $10B-$50B | 13% | 17% |
| >=$50B | 40% | 59% |
Note: The share of branches open at the start of COVID-19 is calculated from the sample of branches open on March 11, 2020, when the World Health Organization declared COVID-19 a pandemic. The shares of branches closed during COVID-19 is calculated from the sample of branches that had a closing date between March 11, 2020, and July 20, 2021.
Source: Author's calculations using S&P Global Intelligence, SNL Branch Analytics
How will Increased Closures affect Access to Financial Services?
In recent years, community groups and consumer advocates have voiced concerns about the effect of branch closures on financial services access, particularly for underserved areas such as minority, low-income or rural communities. The rapid and unprecedented shifts to virtual environments as a result of COVID-19 may also result in an increase in online or mobile banking usage and away from physical branches. This, coupled with the record number of closures during the COVID-19 crisis, makes it important to consider how these changes may affect access to financial services going forward.
My analysis suggests that branch closures during COVID-19 resulted in few additional banking deserts and a relatively small share of consumers live in a new or preexisting banking desert. Still, these consumers are of particular concern in considering access to financial services. The extent of consumer harm on those who live in these areas will depend on a variety of factors such as the extent to which they use online banking and how frequently they visit a branch. While online banking has become more prevalent for the population as a whole, usage rates remain low for some groups, such as those living outside of metropolitan areas or those aged 65 or older.14 Similarly, while most households report visiting a branch infrequently in the last year, these same groups are more likely to report frequent bank branch visits (ten or more times in the last year).15 This suggests that some groups still strongly value the bank branch and should be kept in mind when evaluating the effect of branch closures.
Additionally, there is some evidence that bank branches are important, and this is particularly true for LMI communities in accessing credit.16 Physical bank branches may serve as important channels for soft information and preexisting relationships may be important and hard to replace (Nguyen, 2014). Thus, even though there is a branch near the closure, closures may negatively impact access to credit.17 Finally, bank branch closures can cause consumer harm in areas that are not deserts by reducing competition.
References
Dahl, D., Franke, M., & Fuchs J. (2021). "How Branch Closures Affect Access to Banking Services," St. Louis Fed, Federal Reserve Bank of St. Louis.
Ergungor, O. & Moulton, S. (2014). "Beyond the Transaction: Banks and Mortgage Default of Low‐Income Homebuyers," Journal of Money, Credit, and Banking, Blackwell Publishing, vol. 46(8), pages 1721-1752, December.
Ergungor, O. (2010). "Bank Branch Presence and Access to Credit in Low- to Moderate-Income Neighborhoods," Journal of Money, Credit and Banking, 42(7), 1321-1349.
Federal Deposit Insurance Corporation. (2013). 2013 Survey of Household Use of Banking and Financial Services. Retrieved from https://www.economicinclusion.gov/surveys/
Federal Deposit Insurance Corporation. (2017). 2017 Survey of Household Use of Banking and Financial Services. Retrieved from https://www.economicinclusion.gov/surveys/
Federal Deposit Insurance Corporation. (2019). 2019 Survey of Household Use of Banking and Financial Services. Retrieved from https://www.economicinclusion.gov/surveys/
Morgan, D., Pinkovskiy, M., & Yang, B. (2016). "Banking Deserts, Branch Closings and Soft Information," Liberty Street Economics, Federal Reserve Bank of New York, July 12, 2016.
Nguyen, H. L. Q. (2014). "Do Bank Branches Still Matter? The Effect of Closings on Local Economic Outcomes." Cambridge: Department of Economics, Massachusetts Institute of Technology.
S&P Global Intelligence, SNL Branch Analytics. (2021). "Branch Analytics," S&P Global Market Intelligence.
U.S. Bureau of Labor Statistics, All Employees, Depository Credit Intermediation [CES5552210001], retrieved from FRED, Federal Reserve Bank of St. Louis; https://fred.stlouisfed.org/series/CES5552210001, September 1, 2021.
U.S. Census Bureau, Gazetteer File (2019). Retrieved from: https://www.census.gov/geographies/reference-files/time-series/geo/gazetteer-files.2019.html
Appendix A
Table 3: Brick and Mortar/Full Retail Branches missing both an open and closing date or was listed as closed but had no close date, by type
| Bank | Credit Union | Savings Bank | Thrift | NA | Total | |
|---|---|---|---|---|---|---|
| Missing | 1,063 | 9,500 | 60 | 49 | 691 | 11,363 |
| Full dataset | 128,108 | 29,706 | 3,758 | 3,050 | 699 | 165,321 |
| % | 0.01% | 32% | 1.60% | 1.60% | 99% | 6.70% |
A branch was omitted from the analysis if it either (1) was missing both opening and closing dates or (2) its branch status was "Closed" and it had no closing date listed.
If a branch was missing just an opening date (7,093 branches), it is included in closure analysis, but not net analysis. If branch is missing a closing date but not an open date, it is assumed to still be open.
Table 4: Sample dataset missing just an open (not missing close date), by type
| Bank | Credit Union | Savings Bank | Thrift | NA | Total | |
|---|---|---|---|---|---|---|
| Missing | 3,430 | 3,426 | 49 | 187 | 1 | 7,093 |
| Sample dataset | 127,045 | 20,206 | 3,698 | 3,001 | 8 | 153,958 |
| % | 2.70% | 17% | 1% | 6% | 13% | 5% |
1. I follow the Community Reinvestment Act in designating LMI areas as areas where the median family income is less than 80 percent of the area median income and MUI areas as areas where the median family income is at least 80 percent of the area median income. See https://www.federalreserve.gov/consumerscommunities/cra_resources.htm for more detail. Return to text
2. See https://www.marketplace.spglobal.com/en/datasets/snl-us-bank-branch-data-(38) Return to text
3. I limit the dataset to brick and mortar or full retail banking branches. Additionally, some observations are missing both an open date and a close date or have closed status but no close date. I omit these from the analysis. These omitted branches are disproportionately likely to be credit unions. See Appendix A for more details. Return to text
4. This drop likely reflects new reporting requirements for credit unions, leading to a large number of credit unions closed before the year 2000 only showing up in the data as closed starting in 2000. See https://www.ncua.gov/about-ncua/historical-timeline#1990s Return to text
5. In 2017, 65% of banked households report using online or mobile banking, an increase from 54% in 2013 (Source: author's calculations from the FDIC's Survey of Household Use of Banking and Financial Services). Though FDIC's most recent survey was June 2019, the 2017 survey is the most recent survey that asks about online or mobile banking usage. Return to text
6. Source: author's calculations using S&P Global Intelligence, SNL Branch Analytics Return to text
7. I use the Office of Budget and Management's (OMB) most recent metropolitan and micropolitan delineations. I define metropolitan areas as counties that are within a metropolitan statistical area (MSA) and non-metropolitan (non-metro) areas as counties outside of an MSA. Data come from the US Census Bureau's most recent release. See https://www.census.gov/programs-surveys/metro-micro.html Return to text
8. The proportion of net closures by metro and non-metro areas are statistically different from each other at the 5% level for every year except 2014. Return to text
9. Source: author's calculations using S&P Global Intelligence, SNL Branch Analytics Return to text
10. The proportion of net closures by LMI and MUI areas are statistically different from each other at the 1% level for these years. Return to text
11. I follow other studies in defining a "banking desert" as a census tract with no branch within a ten-mile radius of the center of the tract (Morgan, Pinkovskiy & Yang (2016); Ergungor (2010)). I omit any tracts that have a population estimate of zero from the final count and map. These generally correspond to uninhabitable areas such as lakes or wilderness. Return to text
12. A person is considered to identify as a racial or ethnic minority if they do not identify as White, Non-Hispanic. All population estimates are the author’s calculations using 2015-2019 American Community Survey 5-year estimates. Return to text
13. Out of 1,570 deserts in 2019, only 8 transitioned out of being a branch desert (a new branch opened within ten miles of the tract center). Return to text
14. Only 54% of those living outside of metropolitan areas and 40% of those aged 65 or older report using online or mobile banking in the last year compared with 65% overall (source: author's calculations using FDIC's 2017 Survey of Household Use of Banking and Financial Services). Return to text
15. 41% of those living outside of metropolitan areas and 34% of those aged 65 or older visiting a branch more than 10 times in the last year compared with 28% overall (source: author's calculations using FDIC 2019 Survey of Household Use of Banking and Financial Services). Return to text
16. For example, Ergungor (2010) shows that when there is a bank branch located in a LMI neighborhood, mortgage originations increase and interest spreads decline. Return to text
17. Nguyen (2014) shows that branch closures have a negative effect on local credit supply when lending is information intensive and lender-specific relationships are difficult to replace. Ergungor and Moulton (2014) discuss the importance of soft information on mortgage performance for low-income homebuyers. They also show that those who receive a loan from a local bank branch are significantly less likely to become delinquent or default than other bank or nonbank borrowers, emphasizing the role of soft information. Return to text
Kreiss, Kimberly M. (2021). "Bank Branches and COVID-19: Where are Banks Closing Branches during the Pandemic?," FEDS Notes. Washington: Board of Governors of the Federal Reserve System, December 17, 2021, https://doi.org/10.17016/2380-7172.3027.
Disclaimer: FEDS Notes are articles in which Board staff offer their own views and present analysis on a range of topics in economics and finance. These articles are shorter and less technically oriented than FEDS Working Papers and IFDP papers.