FEDS Notes
October 16, 2020
Beyond imports: the supply chain effects of trade protection on export growth1
Kyle Handley, Fariha Kamal2, Ryan Monarch3
The United States imposed a series of wide-ranging increases in import tariffs from 2018 through 2019. By August of 2019, $290 billion of U.S. imports - about 12% of the total - were subject to an average tariff increase of 24 percentage points.4 The scale of these tariffs against specific products and countries, and the subsequent retaliation, has drawn comparisons to the Depression-era tariff wars of the 1930s.5
Since then, however, globalization has transformed the structure of world trade. Lower trade costs and new communications technology (Baldwin, 2016) mean that global supply chains are now a pervasive feature of world trade (Hummels, Ishii, and Yi 2001, Johnson and Noguera 2017) These cross-border supply linkages are a potentially important channel for measuring the impact of import tariffs, because they can amplify shocks to trade costs and demand across locations (Almunia, Antras, Lopez-Rodriguez, Morales, 2018; Boehm, Flaaen, Pandalai-Nayar, 2019; Yi, 2003). Indeed, Caldara, Iacoviello, Molligo, Prestipino, and Raffo (2019) find that when firms discussed tariffs and policy uncertainty on earnings calls in recent years, the primary concern cited was their supply chains. The importance of these supply chains means that tariffs on imports can, in turn, hurt export performance. In this note, we report on work exploring this channel, which finds that the supply chain effects of import tariffs account for a substantial portion of the 2018-2019 slowdown in U.S. exports.
Using a product imported by the United States from a source country as the unit of observation, Figure 1 demonstrates that the number of these product-country pairs affected by the multiple waves of new tariffs is substantial. Indeed, by the end of 2019, over 10,000 product-country pairs with positive imports in 2016 faced new tariffs. Each of them represents a decision by at least one firm (and likely more) regarding potentially higher costs of doing business: finding a new supplier, producing the product domestically, paying the tariffs, negotiating with existing suppliers over prices, etc.
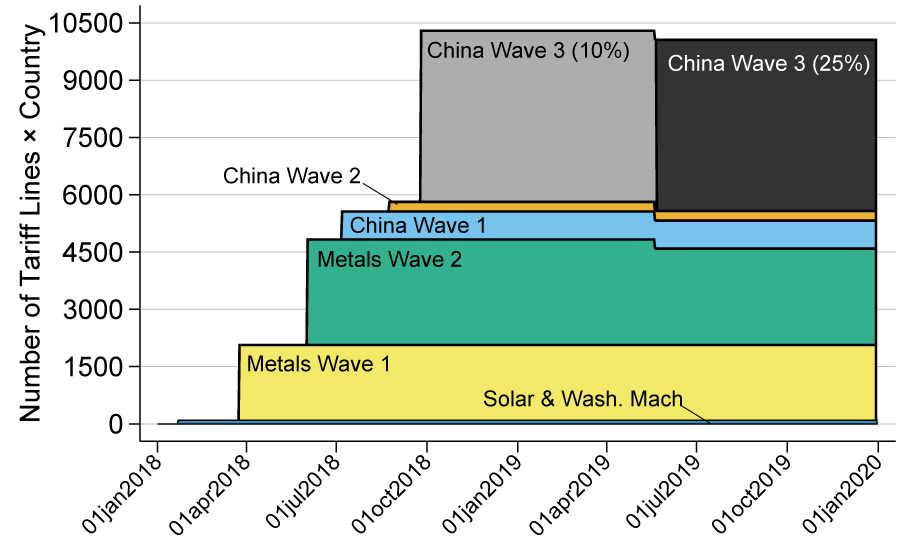
Notes: New U.S. import tariffs from January 2018 to December 2019 matched to 2016 import data with positive annual exports. Observations are at the country-tariff line (HS8) level. Metals Wave 2 reduction reflects country exemption granted in 2019. Product list for China Wave 3 at 10% and 25% is unchanged.
In a new paper (Handley, Kamal, Monarch 2019), we leverage confidential microdata on the universe of U.S. trading firms to demonstrate that supply chain spillovers from the import tariffs dampened U.S. export growth over 2018-2019. As seen in Figure 2, U.S. export growth was weak from mid-2018 through late 2019. The drop in export growth extends beyond the major products and countries that were the focus of 2018-2019 trade tensions: the decline is clear even when progressively excluding products that ultimately face foreign retaliatory tariffs; all remaining exports to China, Mexico, and Canada; and finally all remaining trade with Asia and Europe. The weakness in U.S. export growth and the potential role for import tariffs underlines the importance of quantifying supply chain spillovers.
Figure 2. Average Quarterly Country-Product Export Growth 2017Q1-2019Q4 (year-on-year): Total Growth and Progressively Excluding Groups
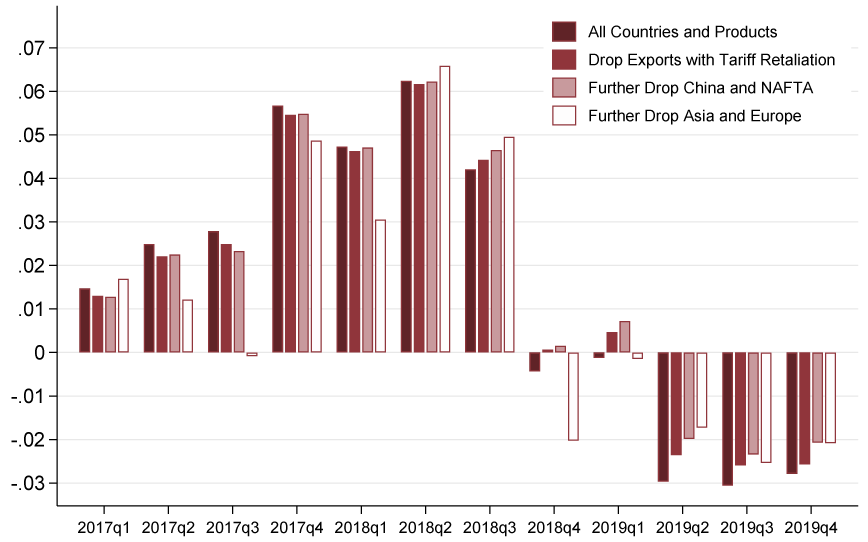
Notes: Bars are average monthly log export growth (year-on-year) within each quarter from 2017Q1-2019Q4. Observations are at the country-product (HS6) level. Key identifies bars in order from left to right.
Firm-Level Exposure to U.S. Import Tariffs
We link publicly available information on new import tariffs to data on the operations of firms importing those products that would ultimately face tariff increases. About a third of all U.S. importers in 2016 traded product categories that would be exposed to the new import tariffs in 2018-2019 and these firms employed 32% of all non-farm, private sector workers. Moreover, a non-trivial share of trade value was subject to tariff increases at the typical affected firm: 46% of an affected importer's purchases were subject to U.S. import tariffs. U.S. importers facing import tariff increases employed twice as many workers compared to the average importing firm and about nine times as many workers as the average firm. Thus, the tariff increases hit the very largest trading firms in the U.S. economy.
The implied tariff costs are significant for the average firm in the economy. Assuming that tariffs remained in place for a full year and firms continued to import the tariffed products, the implied duties paid were $900 per worker overall and about $1,600 per worker in the manufacturing sector. Workers in manufacturing and retail were most exposed to the import tariff increases: 65% of employment in manufacturing and 60% of employment in retail was at firms facing higher import tariffs.
U.S. exporting firms were also impacted by the new import tariffs. U.S. exporters exposed to import tariffs in the same broad product category as their exports - products mostly likely to be part of a supply chain - accounted for 43% of total U.S. exports and 13% of all U.S. exporters. The share of export value affected by import tariffs is almost a third when considering only those exports by U.S. firms subject to import tariffs in the exact same 6-digit product category and nearly doubles to 84% when considering exports in any product category.
The Supply Chain Effects of U.S. Import Tariffs on Export Growth
We use this insight to construct product-level measures of exposure to import tariffs based on the linked firm-trade transactions data. Under our baseline measure of import tariff exposure, for the average HS6 exported product, 11% of exporters import products that both (a) face import tariff increases in 2018-2019 and (b) are in the same HS4 category as that exported product. The most exposed products according to our baseline measure are related to chemicals (HS Chapter 29), machinery (HS Chapters 84 and 85), and metals (HS Chapters 72 and 73).6
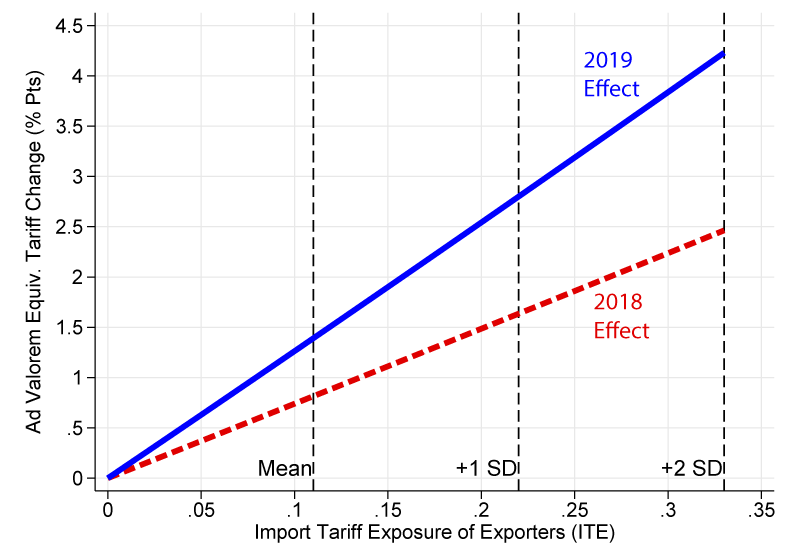
Using the baseline measure of import tariff exposure by exporters in a HS 6-digit product, we estimate the impact on U.S. export growth in a generalized difference-in-differences framework.7 We control for foreign retaliatory export tariffs, destination-time, destination-sector, and product-time unobservable factors. The quarterly coefficients are graphed in Figure 3. We find that average bilateral export growth at the country-product level was lower in products with a higher share of exporters subject to import tariff increases. We find that exposure depressed export growth in 2018 and especially 2019. The larger impacts in late 2019 are consistent with additional tariff waves being added throughout 2018 and large tariff increases on Chinese goods in early 2019. Exported products with average exposure had a growth rate of about ¾ percentage points lower than an unaffected product in 2018 and about 1¼ percentage points lower in 2019. By 2019, the magnitude of the effect on exports from import tariffs is equivalent to what would happen with a direct ad valorem tariff on U.S. exports of almost 1.5% for the average country-product export. And, as shown in Figure 4, for sectors with exposure two standard deviations above the mean, this implies an ad valorem equivalent tariff of about 2.5% (in 2018) to 4% (in 2019), close to the average, statutory MFN tariff rates imposed on trade partners by the U.S. and E.U. Our estimates further suggest that export growth reductions would have been 35% smaller if the new import tariffs were not levied on products likely to be part of the average firm's supply chain.
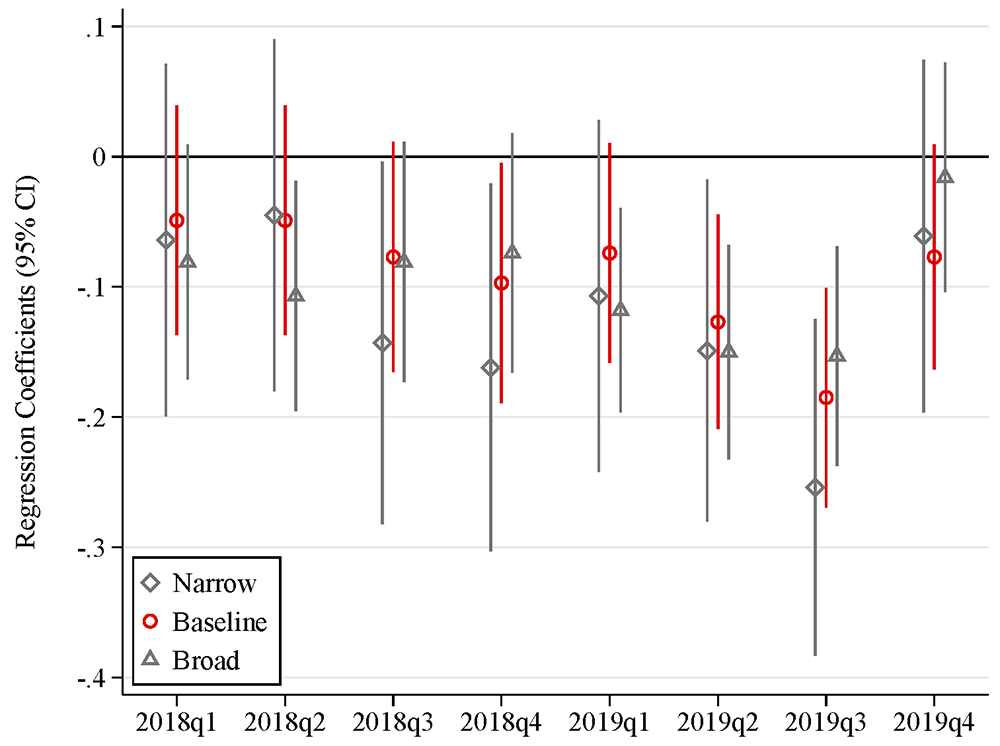
Notes: Coefficients and 95% confidence intervals from separate regressions of export growth on each ITE measure.
Notes: New U.S. import tariffs from January 2018 to December 2019 matched to 2016 import data with positive annual exports. Observations are at the country-tariff line (HS8) level. Metals Wave 2 reduction reflects country exemption granted in 2019. Product list for China Wave 3 at 10% and 25% is unchanged.
The magnitude of the estimated effects may seem large compared to what appears to be a fairly small cost shock in the aggregate - total customs duties collected in 2018 was $53.3 billion or only about 2% of total merchandise imports (BEA 2019). However, our import tariff exposure measure captures not just the effect of actually paying the tariffs, but the comprehensive set of activities that need to be undertaken to re-optimize supply chains in response to the tariffs and accompanying uncertainty.
Anecdotally, U.S. firms have described these effects as significant to their operations, perhaps even more important than the actual direct increase in costs from the tariffs themselves. For example, in U.S. Senate testimony, the CEO of Learning Resources wrote: "We have business reasons for the assignment of products to specific factories, whether in the United States or in other countries. [...] We have also made repeated attempts to develop a U.S.-based supply chain but cannot do so on any basis, even inefficiently. We have no known realistic alternative to our current supply chain." (U.S. Senate Committee on Finance 2018). If exporters choose to drop out of importing and exporting altogether in response to new tariffs on intermediate inputs, our measure would still capture the effects of that decision on total export growth. Thus, even though we do not take a position on precisely how the increase in costs transmits through the supply chains of affected firms, our estimated effects encompass a wide range of potential responses by U.S. exporters to the new import tariffs.
References
Almunia, Miguel, Pol Antras, David Lopez-Rodriguez, and Eduardo Morales, 2018. "Venting Out: Exports During a Domestic Slump," mimeo.
Baldwin, Richard, 2016. The Great Convergence: Information Technology and the New Globalization, Harvard University Press.
Boehm, Christoph E. Boehm, Aaron Flaaen, and Nitya Pandalai-Nayar, 2019. "Input Linkages and the Transmission of Shocks: Firm-level Evidence from the 2011 Tohoku Earthquake," Review of Economics and Statistics 101(1), 60-75.
Bown, Chad P. and Melina Kolb, 2019. "Trump's Trade War Timeline: An Up-to-Date Guide," Trade & Investment Policy Watch, Peterson Institute of International Economics.
Caldara, Dario, Matteo Iacoviello, Patrick Molligo, Andrea Prestipino, and Andrea Raffo, 2019. "The Economic Effects of Trade Policy Uncertainty," mimeo.
Handley, Kyle, Fariha Kamal, and Ryan Monarch. 2019. "Rising Import Tariffs, Falling Export Growth: When Modern Supply Chains Meet Old-Style Protectionism," NBER Working Paper 26611.
Hummels, David, Jun Ishii, and Kei-Mu Yi, 2001. "The Nature and Growth of Vertical Specialization in World Trade," Journal of International Economics 54(1), 75-96.
Irwin, Douglas A., 1998. "The Smoot-Hawley Tariff: A Quantitative Assessment," Review of Economics and Statistics 80(2), 326-334.
Johnson, Robert and Guillermo Noguera, 2017. "A Portrait of Trade in Value-Added Over Four Decades," Review of Economics and Statistics 99(5), 896-911.
U.S. Bureau of Economic Analysis, 2019. "Taxes on Production and Imports, Table 3.5," National Income and Product Accounts.
U.S. Senate Committee on Finance, 2018. "Hearing Before the Committee on Finance United States Senate 115th Congress Second Session (PDF)," accessed December 19, 2019.
Yi, Kei-Mu, 2003. "Can Vertical Specialization Explain the Growth of World Trade," Journal of Political Economy 111(1), 52-102.
1. The Census Bureau's Disclosure Review Board and Disclosure Avoidance Officers have reviewed this data product for unauthorized disclosure of confidential information and have approved the disclosure avoidance practices applied to this release (DRB Approval Numbers: CBDRB-FY19-519, CBDRB-FY20-104, CBDRB-FY20-CES006-004, CBDRB-FY20-CES006-005). Return to text
2. Any opinions and conclusions expressed herein are those of the authors and do not necessarily represent the views of the U.S. Census Bureau. Return to text
3. The analysis and conclusions set forth are those of the authors and do not indicate concurrence by other members of the research staff at the Board of Governors or the Board of Governors of the Federal Reserve System. Return to text
4. The dollar value of tariffed imports is calculated on an annual basis using 2017 data, and the average tariff increase is weighted using the same data. For a timeline of tariffs on U.S. imports and foreign retaliatory export tariffs, see Bown and Kolb (2019). Return to text
5. The Smoot-Hawley tariffs increased import duties by about 20% on average and set off a wave of worldwide protectionism (Irwin 1998). Return to text
6. We measure exposure of an HS2 sector by taking the share of HS6 products in each HS2 with an import tariff exposure greater than the 75th percentile of the distribution (i.e. chapters with a large number of highly exposed products). Return to text
7. For example, we estimate whether export growth in industries with higher exposure to import tariffs (the first difference) is lower in 2018-2019 relative to 2016-2017 (the second difference). Return to text
Handley, Kyle, Fariha Kamal, and Ryan Monarch (2020). "Beyond imports: the supply chain effects of trade protection on export growth," FEDS Notes. Washington: Board of Governors of the Federal Reserve System, October 16, 2020, https://doi.org/10.17016/2380-7172.2751.
Disclaimer: FEDS Notes are articles in which Board staff offer their own views and present analysis on a range of topics in economics and finance. These articles are shorter and less technically oriented than FEDS Working Papers and IFDP papers.