FEDS Notes
September 08, 2023
Corporate Profits in the aftermath of COVID-191
Overview
This note documents the behavior of corporate profit margins during and in the aftermath of the pandemic. As the traditional measure of corporate profit margin is heavily affected by fiscal support and its withdrawal, it also proposes an alternative measure. The note also provides insights on the dynamics of profit margin at firm level.
In the aftermath of COVID-19, inflation increased to levels that the U.S. economy has not witnessed for more than 40 years. This phenomenon has spurred a large quantity of policy commentary and academic research discussing its causes.2 One popular narrative goes as follows: in the aftermath of the COVID-19 pandemic, and amid a surge in demand and contemporaneous supply chain bottlenecks, corporate businesses increased the price of their final goods and services above and beyond what was justified by changes in labor costs and input prices. The outcome was a marked increase in profit margins that has contributed to overall inflation.3
But were corporate profit margins abnormally high in the aftermath of the COVID-19 pandemic? The answer depends on measurement. Using a measure of nonfinancial corporate profits from the national income accounts–before tax profits with capital consumption adjustment–we find that nonfinancial corporate profit margins, or profits over gross value added, increased sharply to about 19% in 2021q2 and slipped back to 15% in 2022q4, compared to about 13% in 2019q4. This contrasts sharply with the steep dive in margins that normally occurs during a severe economic contraction.
Our analysis shows that much of the increase in aggregate profit margins following the COVID-19 pandemic can be attributed to (i) the unprecedented large and direct government intervention to support U.S. small and medium sized businesses and (ii) a large reduction in net interest expenses due to accommodative monetary policy. Once we adjust for fiscal and monetary interventions, the behavior of aggregate profit margins appears much less notable, and by the end of 2022 they are essentially back at their pre-pandemic levels.
Given the non-negligible effect of government intervention on the overall corporate profit margin, we highlight a different measure of corporate profitability. Specifically, we calculate the nonfinancial corporate net capital share, that is, the amount that remains for debt as well as equity holders after paying labor costs and the cost associated with the wear and tear of installed capital. This profitability measure tells quite a different story. First, the net capital share plummeted at the onset of the COVID-19 pandemic, as one would expect in a recession. Second, the net capital share rebounded to a value only 2.5 percentage points higher than its pre-pandemic level (while the aggregate profit margin rebounded to a value 6 percentage points higher than its pre-pandemic level) and then declined to its 2019q4 level by the end of 2022.
In the second part of this note, we explore the profit margins of a large pool of publicly traded nonfinancial U.S. firms. The benefit of focusing on these firms is twofold. First, the large majority of firms did not directly benefit from the large fiscal intervention and, as a consequence, their profit margins dynamics are more in line with what happened line during past recessionary episodes. Second, having firm-level profit margins allows us to explore differences in corporate profit margins dynamics across firms. We find that for the largest firms (as measured by their total revenues) profit margins have not deviated significantly from their pre-COVID-19 trend, while for middle- sized firms, profit margins have remained significantly lower in the aftermath of the COVID-19 pandemic. Overall, the firm-level analysis supports the view that nonfinancial corporate profits margins were not abnormally high in the aftermath of COVID-19.
An aggregate perspective
In our analysis, we use a measure of before tax profit margins that includes an adjustment for capital consumption.4 In particular, this profit margin measure can be recovered following:5
$$$$ 1 - \frac{Unit\ Labor\ Costs}{Price} - \frac{Unit\ Non \text{-} Labor\ Cost}{Unit\ Price} - \frac{IVA}{GV\ A} $$$$
In the above expression, price, unit labor costs and unit non-labor costs are expressed in units of gross value added for the non-financial corporate business sector. The first three terms deliver the before tax non-financial corporate business profit margin with capital consumption and inventory valuation adjustment. The last term subtracts the inventory valuation adjustment (as a percentage of gross value added) to make this measure of profit margin more comparable with that measured in financial reports.
The way of calculating profit margins is particularly useful for the purpose of this note as it allows us to uncover the role played by non-labor costs in shaping corporate profitability in the aftermath of COVID-19. Specifically, unit non labor cost is the sum of:
- Consumption of fixed capital, which accounts for the decline in the value of installed capital due to wear and tear;
- Taxes on production and imports less subsidies plus business current transfer payments;
- Net interest and miscellaneous payments.
Figure 1 reports the non-financial corporate profit margin for the period 1980q1-2022q4. The large increase in profitability following the COVID-19 pandemic stands out. The profit margin increased from 11.3% in 2020q1 to 19.2% in 2021q2. Thereafter, this quantity steadily declined and reached 15.1% in the last quarter of 2022, a value comparable to the one immediately after the Global Financial Crisis.
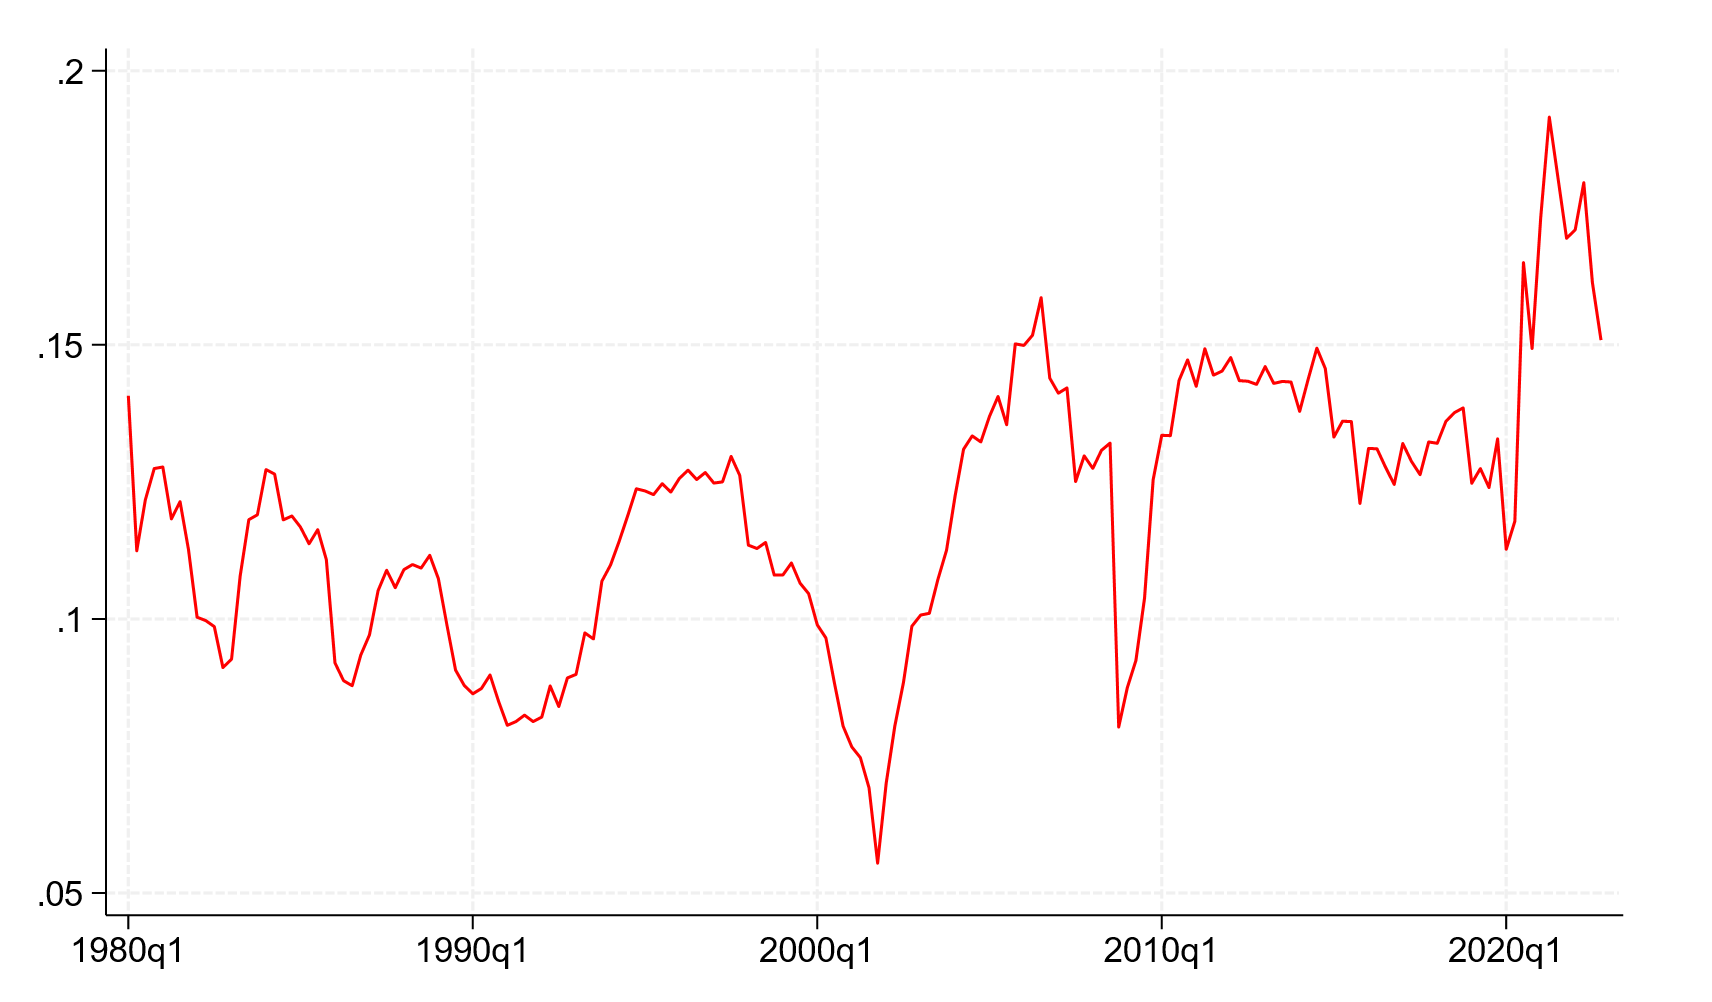
Note: This figure depicts the aggregate non-financial corporate profit margins adjusted for capital consumption for the period 1980q1-2022q4.
Source: U.S. Bureau of Economic Analysis.
Why do we observe such a large increase in profit margins? Figure 2 provides some clues. Because of the COVID-19 pandemic, there was unprecedented support for U.S. businesses via the Coronavirus Aid, Relief and Economic Security Act (CARES) of 2020, the Paycheck Protection Program and Health Care Enhancement Act of 2020, and the American Rescue Plan Act of 2021.6 These programs greatly increased the subsidy component of non-labor cost, thus providing a large boost to corporate profits. The top panel of Figure 2 shows that over the period 1980q1-2019q4, the government-related component of non-labor cost fluctuates between 8 percentage points and 10 percentage points, with an average value of 9.4 percentage points. In 2020q2 this component drops to 3.8 percentage points, about 13 standard deviations below the average value over the previous 40 years.7 The dramatic movement in the government-related component post-2019 almost perfectly correlates with the government subsidy-to-GDP ratio (dashed black line, top panel), thus leaving little doubt that higher subsidies contributed to higher profit margins.
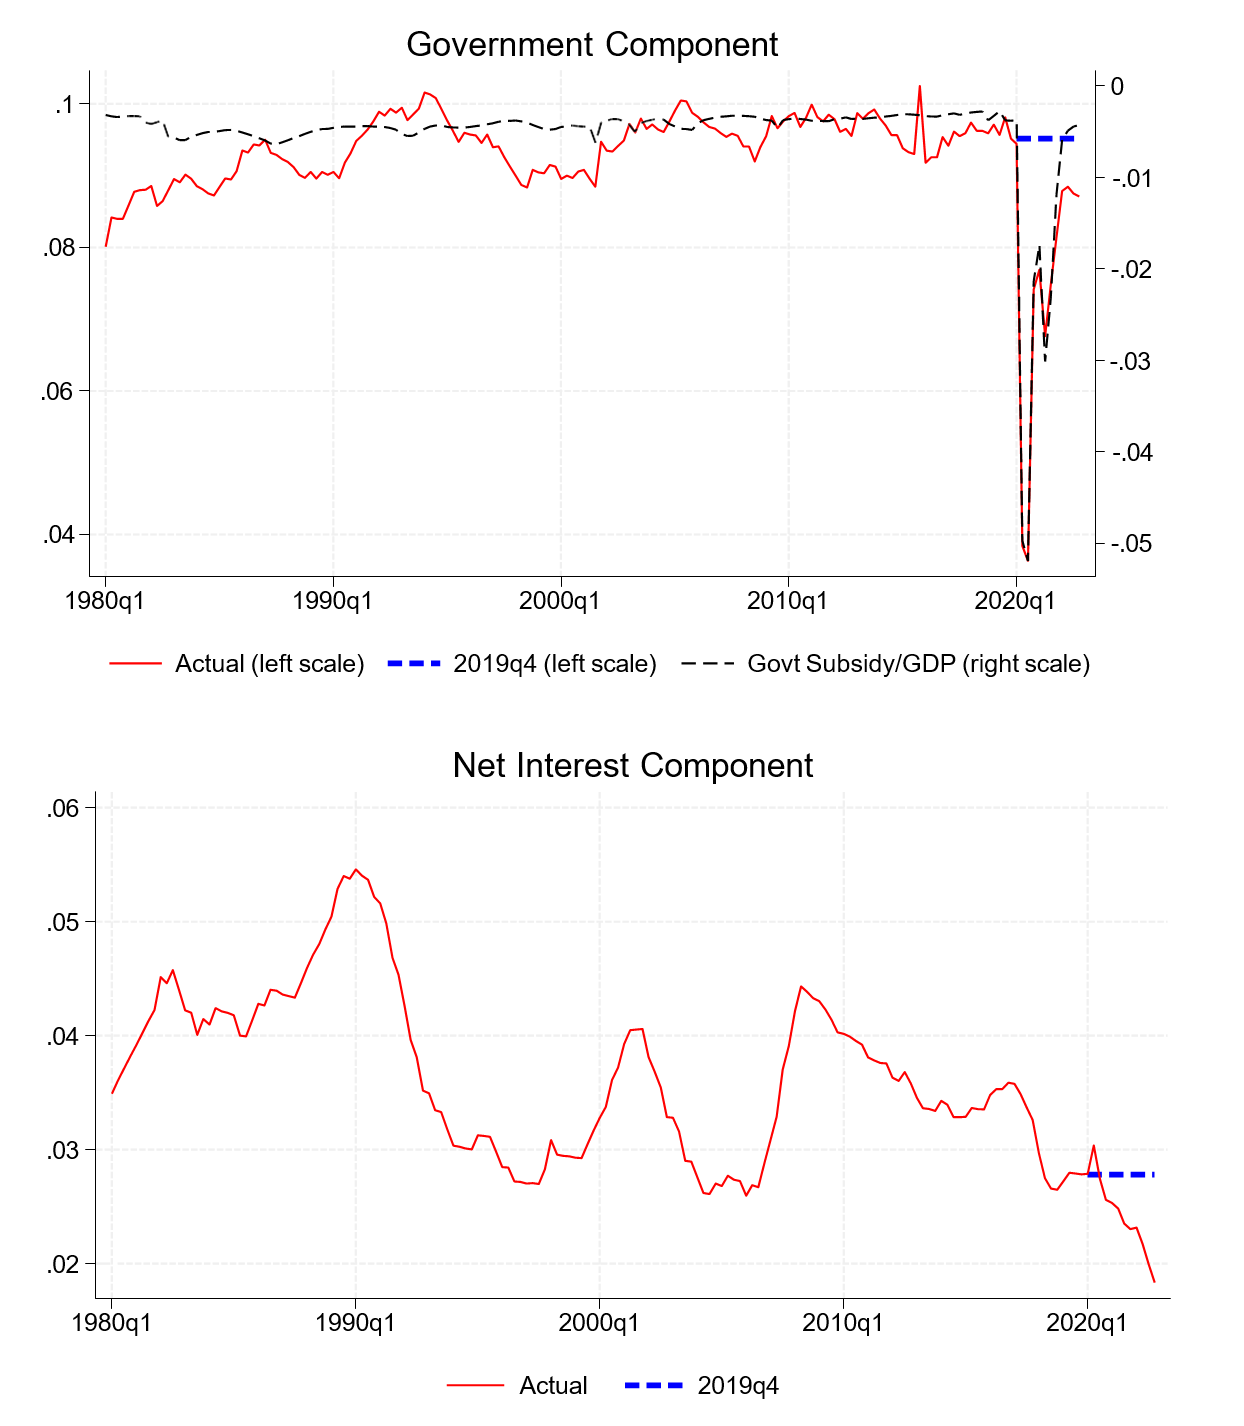
Note: This figure depicts the government-related (top panel solid red line) and the net interest (bottom panel solid red line) components of non-labor costs over the period 1980q1-2022q4. The government-related component includes taxes on production and imports less subsidies plus business current transfer payments. The dashed black line in the top panel depicts the negative of government subsidies over GDP. In both panels, the dashed blue lines are the 2019q4 values.
Source: U.S. Bureau of Economic Analysis.
At the same time, profit margins also received a boost over the 2020q1-2022q4 period by a rapid decline in interest expenses (bottom panel of Figure 2). The decline was driven by many companies refinancing their obligations to ensure lower interest payments going forward.8 As a consequence, the interest share of value added declined from by about 2.8 percentage points in 2019q4 to 1.8 percentage points in 2022q4, thus contributing to an increase in profit margins of 0.01 (or 1 percentage point) during that period.
To properly account for the effect of firms' market power on the aggregate profit margin dynamics, one should adjust the latter quantity for the unprecedented government intervention, especially because this intervention almost exclusively benefited smaller firms, which admittedly have very little market power. To this end, we recalculate the latter value assuming that (i) the government component had remained fixed at its 2019q4 value over the period 2020q1-2022q4 (dashed blue line in top panel of Figure 2) and (ii) the net interest component would have stayed fixed at its 2019q4 value over the period 2020q1-2022q4 (dashed blue line in bottom panel of Figure 2).
We report this adjusted profit margin together with the actual profit margin in Figure 3. Without the historically outsized government fiscal intervention and accommodative monetary policy, non-financial profit margins during 2020-2021 would have been more in line with past episode of large economic downturns. Overall, profits margins would have been, on average, 0.025 lower during the period 2020q2-2021q4.9
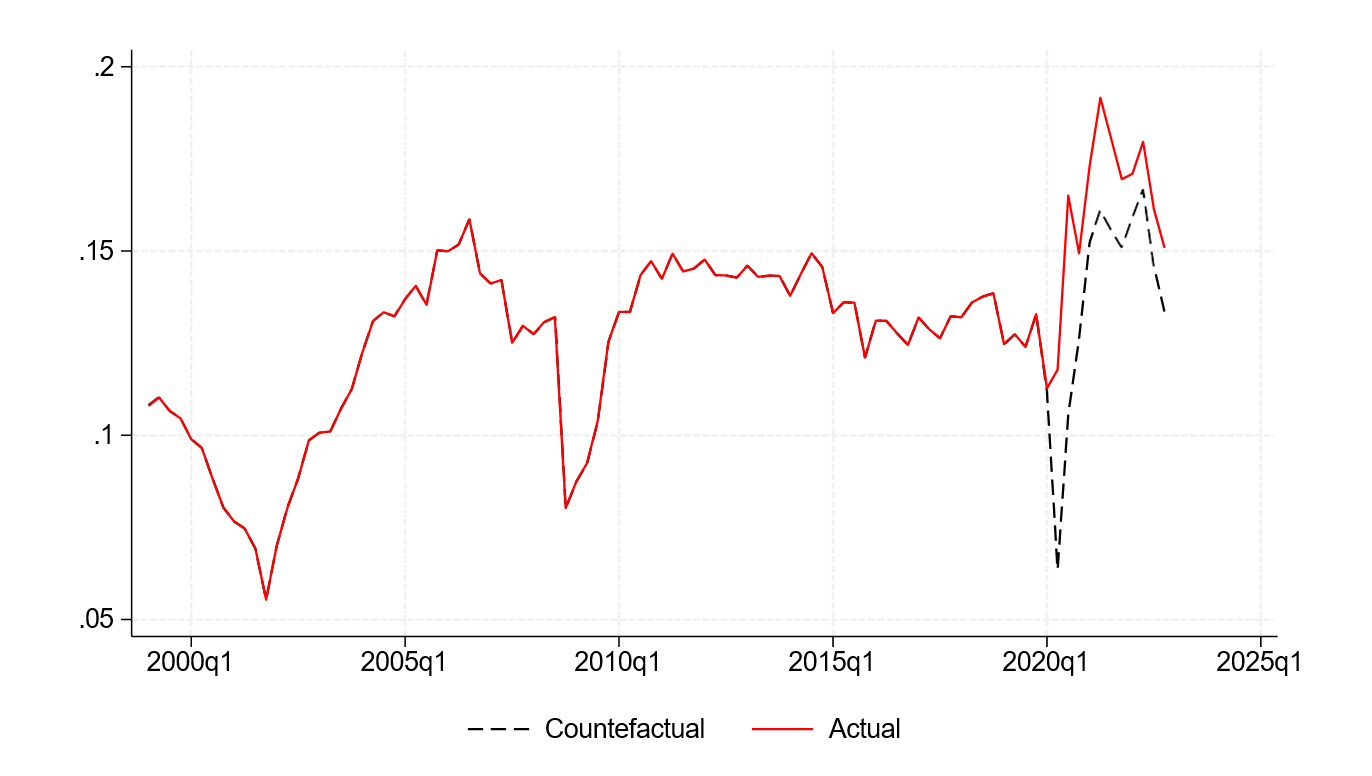
Note: This figure reports the aggregate non-financial corporate profit margins (red line) together with the adjusted profit margins under the assumption of constant (i.e., 2019q4 value) government and net interest components (dashed black line) for the period 2020q1-2022q4. To facilitate the comparison, we restrict the sample to the period 1999q1-2022q4.
Source: U.S. Bureau of Economic Analysis and author’s calculations.
The analysis performed so far makes clear that the massive government intervention during the period 2020-2021 affects aggregate non-financial corporate profit margins to an extent that makes it difficult (i) to perform historical comparisons and (ii) to properly assess how economic forces like market power, productivity, supply chains bottlenecks, and increases in energy prices, among other forces, have shaped the aggregate profit margin in the last couple of years. For this reason, we shift to an alternative profitability measures that is not directly affected by fiscal and monetary policies might be necessary.
In particular, we focus on the net capital share, defined as the difference between revenues and the sum of labor cost and capital consumption scaled by revenues, that is:
$$$$ 1- \frac{Unit\ Labor\ Costs}{Price} - \frac{Consumption\ of\ Fixed\ Capital}{Price} $$$$
The net capital share is what all capital owners (debt and equity holders together) are left with after paying labor costs and the cost associated to the wear and tear of installed capital. Figure 4 reports the net capital share for the period 1980q1-2022q4. We can see that the sudden COVID-19 recessionary episode caused a sharp drop in the net capital share which is much more pronounced than the drop in profit margins. This result is not surprising since the capital share is unaffected by a change in net government subsidies or net interest expense. After the sharp drop, the capital share rebounded to higher levels than just before the Covid-19 pandemic, but it has remained well below its historically high values witnessed in the aftermath of the Global Financial Crisis. Moreover, the net capital share at the end of 2022 (0.260) is almost back to its value immediately before the COVID-19 pandemic (0.254 in 2019q4).
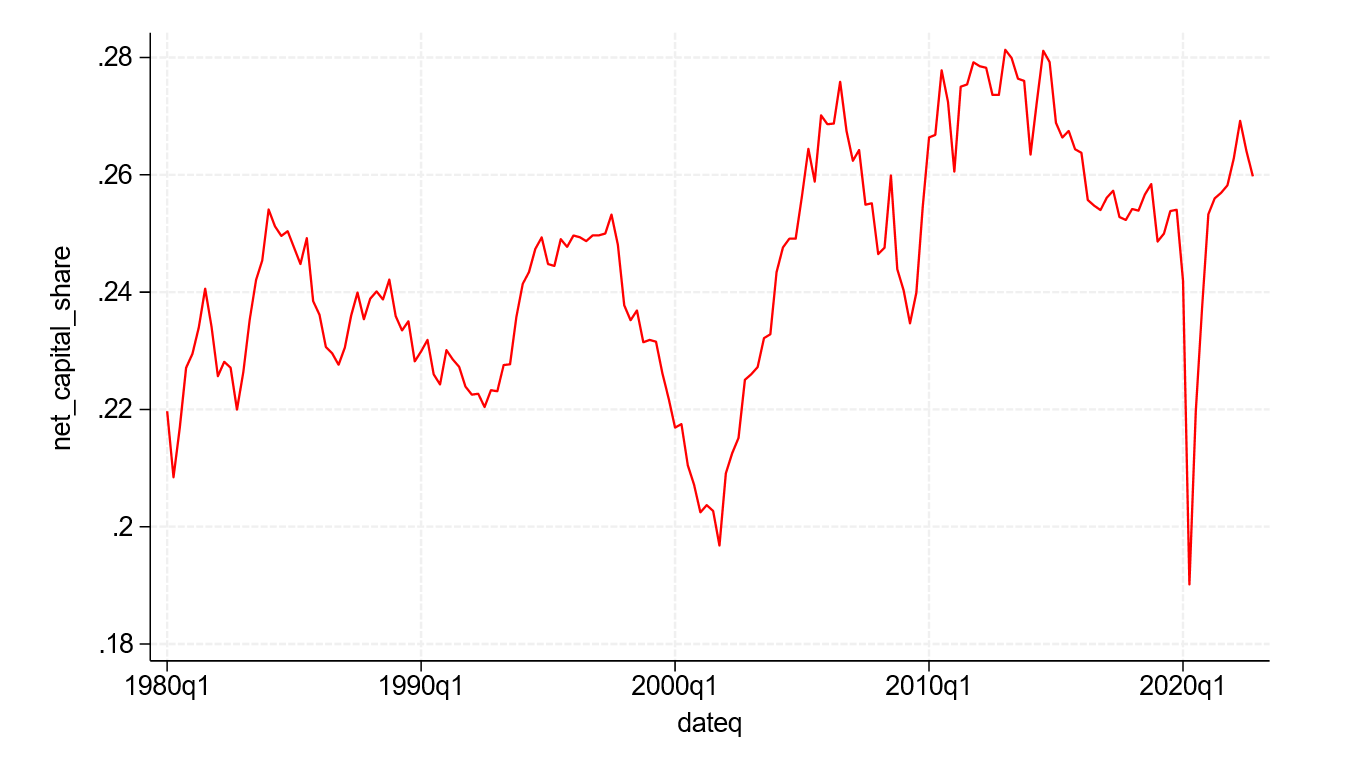
Note: This figure reports the net capital share for non-financial corporations forNet Capital Share the period 1980q1-2022q4.
Source: U.S. Bureau of Economic Analysis.
To summarize, the profit margin dynamics in the aftermath of COVID-19 is heavily affected by unprecedented government intervention, which contributed to a substantial in- crease in profit margins adjusted for capital consumption. When we focus on the net capital share, which is not directly affected by government intervention, we do see a rebound in profitability after a sharp collapse, but this rebound does not look historically abnormal.
A firm-level perspective
Another perspective on profit margins can be gained by focusing on the financial accounting data of publicly-traded nonfinancial corporations. These firms are very likely to have market power and most of them did not benefit directly from the extraordinary fiscal packages, which were targeted to small and medium sized firms.
We calculate the firm-level profit margin as:
$$$$ 1 - \frac{COGSQ}{SALEQ} - \frac{XSGAQ}{SALEQ} - \frac{XINTQ}{SALEQ} $$$$
where COGSQ is cost of goods sold; XSGAQ is Selling, general and administrative expenses; XINTQ is interest and related expenses.10
To take advantage of the firm-level data, we calculate the median profit margin by size categories over the period 1980q1-2022q4. We calculate size categories using quintiles of the total sales distribution in the quarter that precedes the calculation of the profit margin. In Figure 5 we compare the median profit margins for the largest firms (top 20% of the size distribution, red solid line), large firms (fourth quintile of the size distribution, dashed- dot blue line), and median firms (third quintile of the size distribution, dashed black line). The profit margins across these three size categories moved very close together until the beginning of the 2010s, after that we see three distinct patterns: the largest firms profit margins display an increasing trend, the large firms profit margins are flat, and the medium firms profit margins follow a decreasing trend.
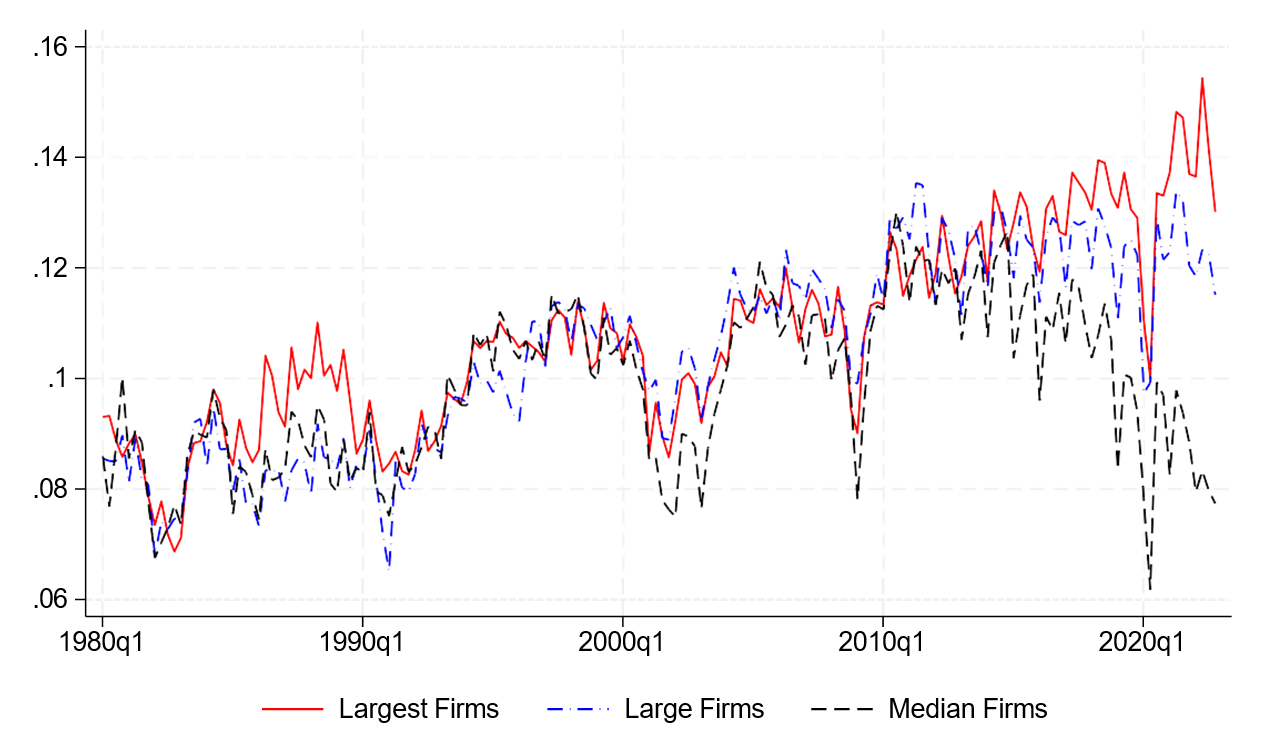
Note: This figure depicts the profit margins for the largest firms (top 20% of the size distribution, solid red line), large firms (fourth quintile of the size distribution, dashed-dot blue line), and medium firms (third quintile of the size distribution, dashed black line) for the period 1980q1-2022q4.
Source: Standard & Poors Global Market Intelligence: Compustat Unrestated Quarterly Data, (June 2023)
Did profit margins deviate significantly from these trends during the period 2022q1- 2022q4? To answer this question, we estimate a time trend for the three different size categories over the period 2010q1-2019q4 and compare in Figure 6 the deviations of profit margins from their time trend in the 2022q1-2022q4 period. While for the firms in the two largest groups we do not see a pronounced deviation from their pre-COVID19 trend, we see a clear deviation from trend for the medium-sized firms. In the latter case, profit margins have remained constantly below their pre-COVID19 trend and they have diverged dramatically from the profit margins of the largest firms. In 2010q1, the profit margins of the largest and middle firms where both around 11 percent, while in 2022q4 the profit margins of the largest firms increased to 13 percent, while the profit margins of middle firms decreased to 8 percent.
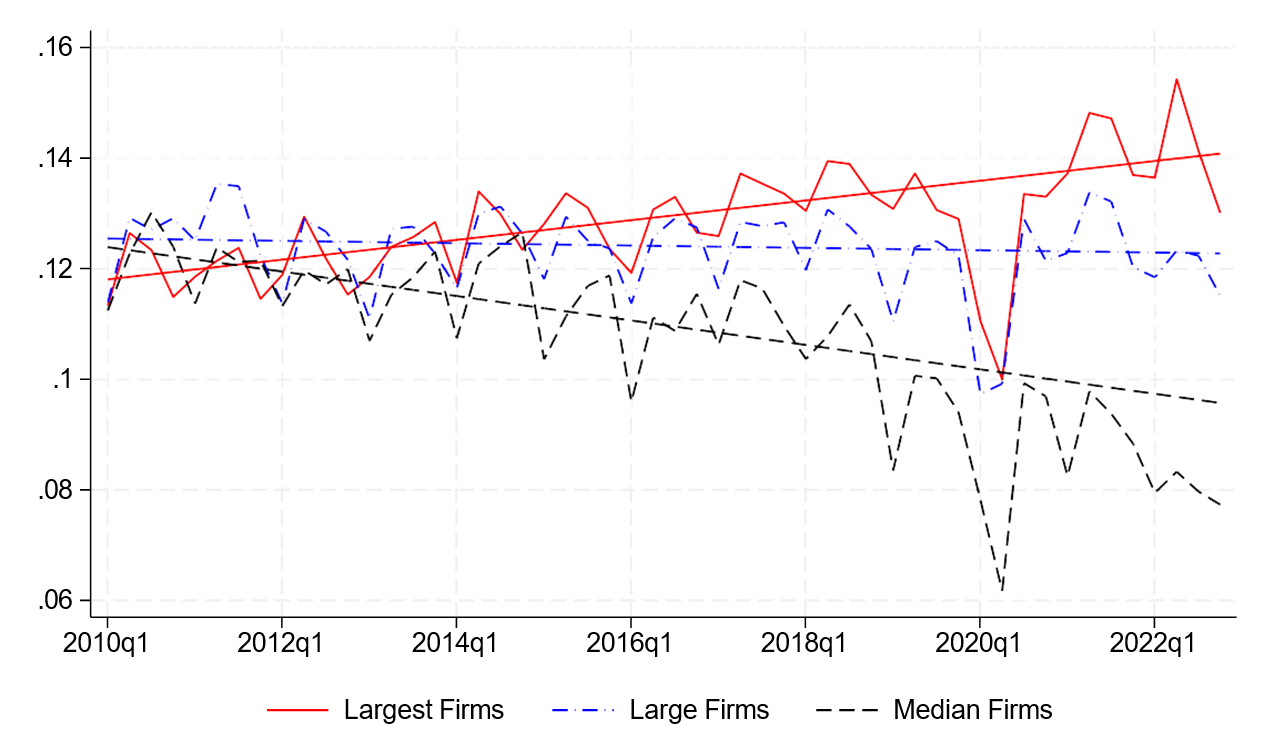
Note: This figure depicts the profit margins for the largest firms (top 20% of the size distribution, solid red line), large firms (fourth quintile of the size distribution, dashed-dot blue line), and medium firms (third quintile of the size distribution, dashed black line) for the period 2010q1-2022q4 together with their linear time trend estimated over the period 2010q1-2019q4.
Source: Standard & Poors Global Market Intelligence: Compustat Unrestated Quarterly Data, (June 2023) and author’s calculations.
Concluding remarks
Corporate profit margins were not abnormally high in the aftermath of the COVID- 19 pandemic, once fiscal and monetary interventions are accounted for. This conclusion is supported by the behavior of the net capital share, which remained well below its historical high levels, and by firm-level profit margins across different size categories, which behaved broadly in line with their pre-COVID trends. If there is any anomaly to note, it should probably be that the aftermath of the COVID-19 pandemic has been characterized by a persistent weakness in the profitability of middle-sized publicly traded firms.
References
Andler, M. and A. Kovner (July 13, 2022). Do corporate profits increase when inflation increases? Federal Reserve Bank of New York. https://libertystreeteconomics.newyorkfed.org/2022/07/do-corporate-profits-increase-when-inflation-increases.
Bernanke, B. and O. Blanchard (2023). What caused the us pandemic-era inflation? Hutchins Center Working Papers.
Bianchi, F., R. Faccini, and L. Melosi (2023). A fiscal theory of persistent inflation. The Quarterly Journal of Economics, forthcoming.
Bivens, J. and A. Banerjee (April 13, 2023). Lessons from the inflation of 2021-202(?). Economic Policy Institute. https://www.epi.org/publication/lessons-from-inflation/
Brauning, F., J. L. Fillat, and G. Joaquim (2022). Cost-price relationships in a concentrated economy. Federal Reserve Bank of Boston Research Paper Series Current Policy Perspectives Paper (94265).
Comin, D. A., R. C. Johnson, and C. J. Jones (2023). Supply chain constraints and inflation. National Bureau of Economic Research WP 31179
Conlon, C., N. H. Miller, T. Otgon, and Y. Yao (2023). Rising markups, rising prices? In AEA Papers and Proceedings, Volume 113, pp. 279–283. American Economic Association 2014 Broadway, Suite 305, Nashville, TN 37203.
Glover, A., J. Mustre-del Rio, and A. von Ende-Becker (2023). How much have record corporate profits contributed to recent inflation? The Federal Reserve Bank of Kansas City Economic Review.
Konczal, M. and N. Lusiani (June 21, 2022). Prices, profits, and power: An analysis of 2021 firm-level markups. Roosevelt Institute. https://rooseveltinstitute.org/publications/prices-profits-and-power/.
Weber, I. M. and E. Wasner (2023). Sellers inflation, profits and conflict: why can large firms hike prices in an emergency? Review of Keynesian Economics 11 (2), 183-213
† [email protected]. Return to text
1. We thank Francisco Palomino, Michael Palumbo, Steve Sharpe, Nitish Sinha, and Michael Smolyansky for comments and suggestions. The views expressed are those of the authors and do not necessarily reflect those of the Federal Reserve Board and Federal Reserve System. Return to text
2. Bivens and Banerjee (2023) provide a list of likely drivers of the inflation surge. Comin, Johnson, and Jones (2023) propose a New-Keynesian framework to study the role of supply chain constraints and find that these constraints can explain about half of the price level increase. Bernanke and Blanchard (2023) link the surge in inflation to increase in commodity prices and sectoral shortages, consistent with the findings in Comin et al. (2023). Bianchi, Faccini, and Melosi (2023) relate the persistent high inflation to unfunded fiscal policy shocks. Return to text
3. Weber and Wasner (2023), Konczal and Lusiani (2022), Br¨auning, Fillat, and Joaquim (2022), Glover, Mustre-del R´ıo, and von Ende-Becker (2023), among many others, study the link between the 2021-2022 inflation surge and corporate profits. During the same period, Andler and Kovner (2022) find that the relationship between inflation and corporate profits was not unusual in historical terms and Conlon, Miller, Otgon, and Yao (2023) find little empirical support for a strong correlation between firm-level markups and price changes. Return to text
4. The BEA uses a different capital depreciation measure from the one reported by businesses in their tax returns. The capital consumption adjustment takes care of this discrepancy. Return to text
5. This measure is equivalent to the ratio of before tax non-financial corporate business profits, (BEA account code A464RC1), plus the capital consumption adjustment, (B456RC1), over the non-financial corporate business gross value added, (A455RC1). Return to text
6. Federal government subsidies amounted to about $1.1 trillion over the period 2020q1-2021q4. The lion share of these subsidies, about $800 billion, were allocated for Paycheck Protection Program (PPP) loans to small businesses. Return to text
7. An increase in the subsidy component generates a decrease of the item "Taxes on production and imports less subsidies plus business current transfer payments", thus contributing to an increase in the overall profit margin due to a lower non-labor cost component. Return to text
8. http://www.wsj.com/articles/pandemic-supercharged-corporate-debt-boom-record-11623681511?page=1 Return to text
9. We are aware that this is a partial equilibrium analysis and that corporate profit margins might have been actually different under the adjusted scenario. It is very likely that without government interven- tion, profitability would have deteriorated further and that the adjusted profit margin we calculate can be considered an upper bound for such a case. Return to text
10. If XSGAQ is missing, we use the difference between operating expenses (XOPRQ) and cost of goods sold. if XINTQ is missing, we replace the missing value with zero. We also exclude from our sample firms that are not incorporated in the U.S. (FIC code different from US), and firms belonging to the financial sector (SIC codes between 6000 and 7000), utilities (SIC codes between 4900 and 5000) and quasi-government firms (SIC codes larger or equal to 9000). Furthermore, we only consider firms traded in the three major stock exchanges. Return to text
Palazzo, Berardino (2023). "Corporate Profits in the aftermath of COVID-19," FEDS Notes. Washington: Board of Governors of the Federal Reserve System, September 08, 2023, https://doi.org/10.17016/2380-7172.3364.
Disclaimer: FEDS Notes are articles in which Board staff offer their own views and present analysis on a range of topics in economics and finance. These articles are shorter and less technically oriented than FEDS Working Papers and IFDP papers.