FEDS Notes
August 03, 2023
Dealers' Treasury Market Intermediation and the Supplementary Leverage Ratio
Paul Cochran, Sebastian Infante, Lubomir Petrasek, Zack Saravay, Mary Tian1
Treasury market intermediation by dealers, including Treasury securities market making and financing, requires regulatory capital. In particular, the six largest U.S. Treasury securities dealers are subsidiaries of large U.S. bank holding companies (BHCs),2 which are required to maintain a supplementary leverage ratio (SLR) of at least 5 percent at the BHC level.3 The SLR is a non-risk weighted capital requirement and is measured as the ratio of a banking organization's Tier 1 capital to its total leverage exposure (TLE).4 As a non-risk weighted capital requirement, the SLR is particularly affected by high-volume, low-risk activities such as Treasury market intermediation. For most of the period since the start of 2018 when the SLR was implemented, most of the big six U.S. BHCs maintained SLRs well above the 5 percent minimum level. However, as shown in Figure 1, the SLRs have trended down in recent quarters, approaching the 5 percent minimum level, as TLEs (Figure 2) have increased faster than Tier 1 capital (Figure 3). For a few large BHCs, especially those with large dealer subsidiaries, the SLR rule has implied higher capital requirements than risk-based capital rules in recent years (the diamonds in Figure 1), making it possible that the SLR may affect their willingness and ability to intermediate in Treasury markets, especially during periods of increased demand for intermediation.
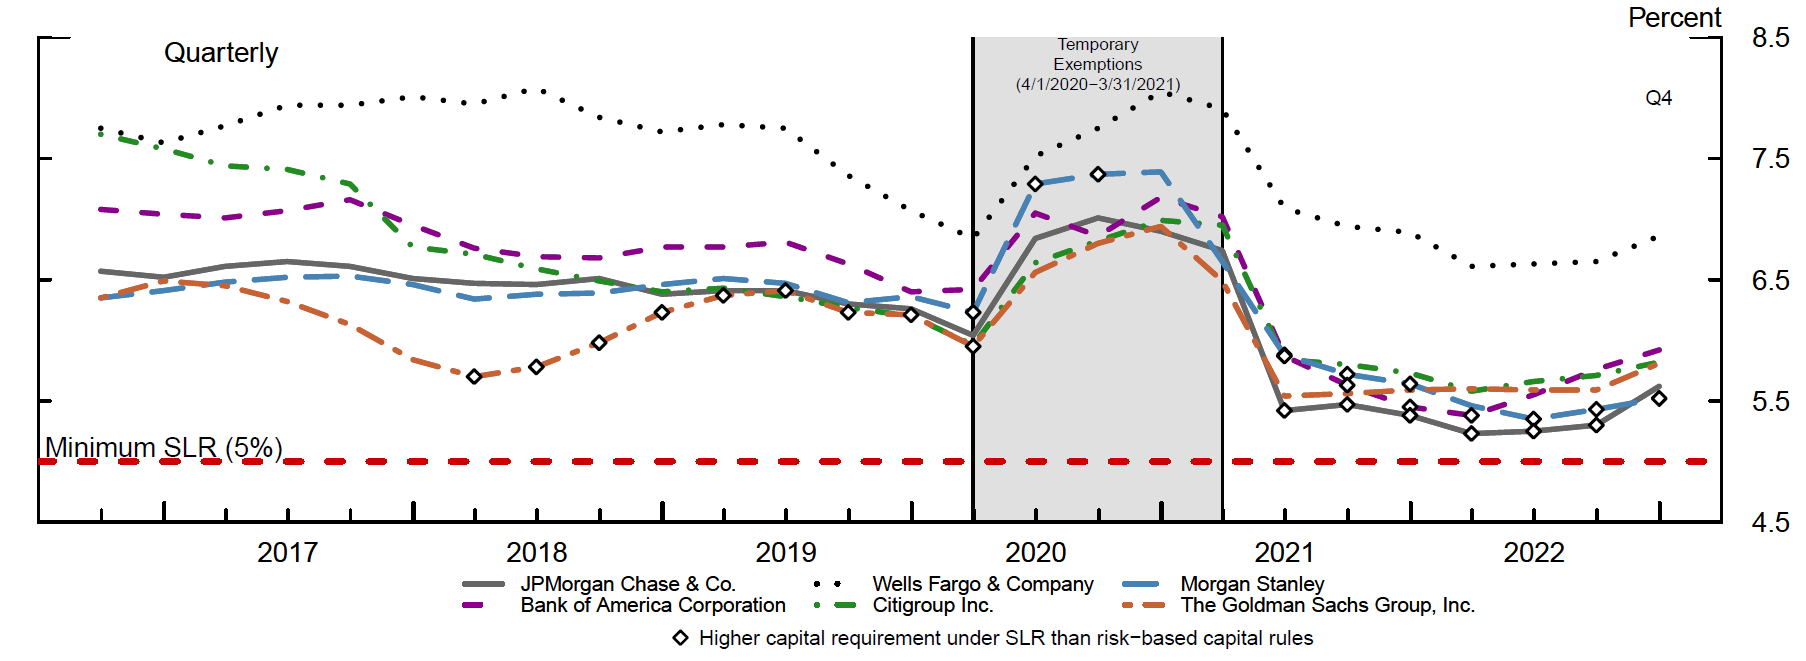
Source: Board of Governors of the Federal Reserve System, Consolidated Financial Statements for Holding Companies (Form FR Y-9C)
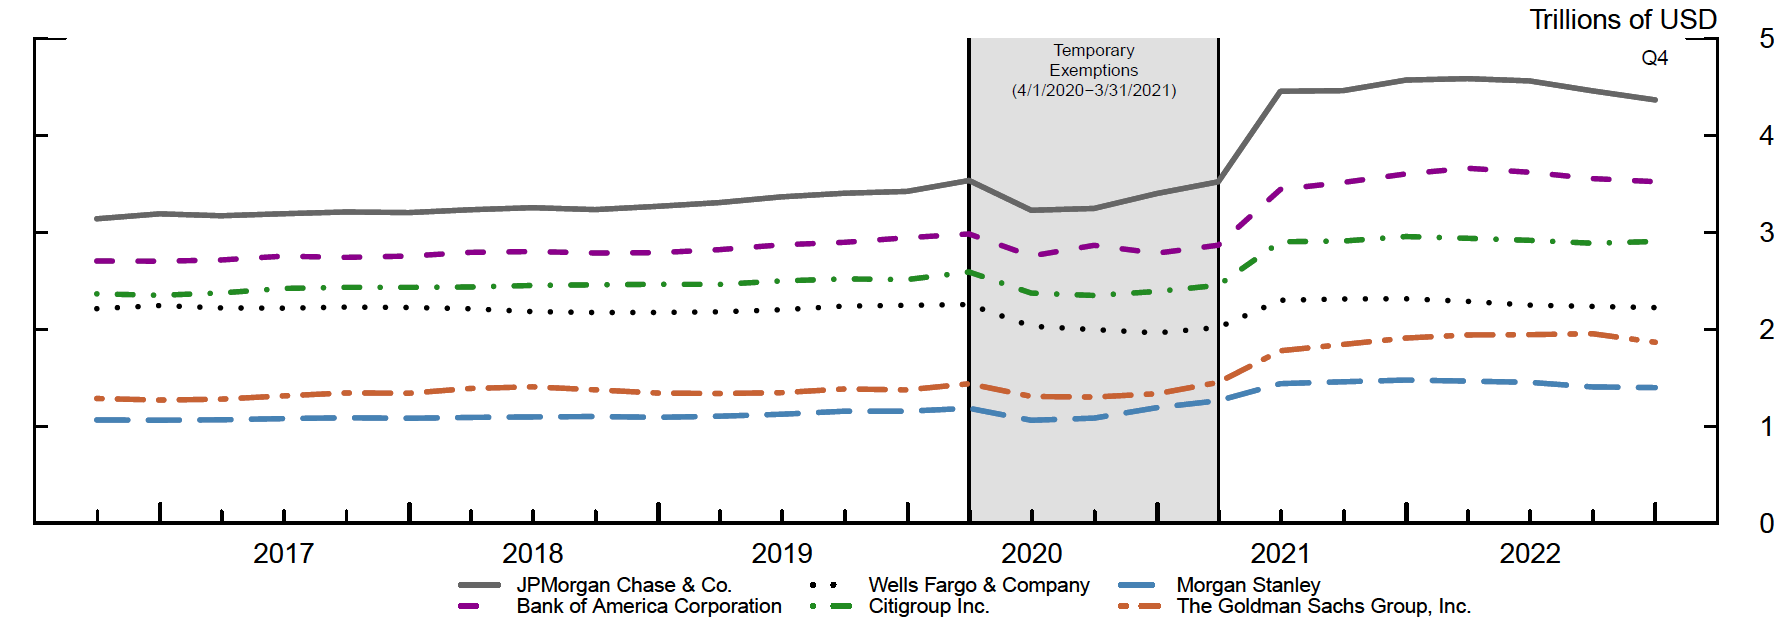
Note: Total leverage exposure is the sum of on-balance sheet exposures, derivatives transactions, repo-style transactions, and off-balance sheet exposures, with certain adjustments.
Source: Federal Financial Institutions Examination Council, Regulatory Capital Reporting for Institutions Subject to the Advanced Capital Adequacy Framework (Form FFIEC 101)
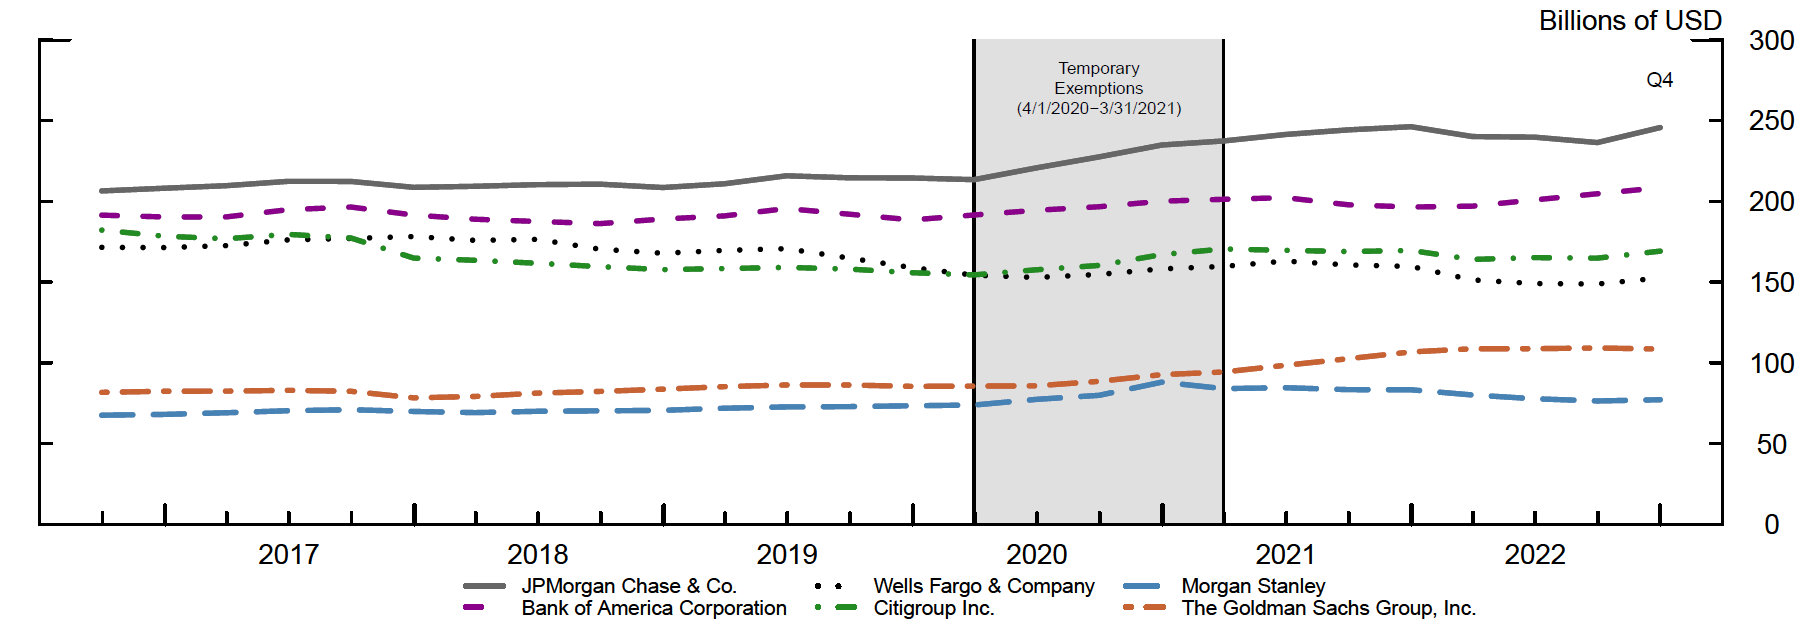
Source: Federal Financial Institutions Examination Council, Regulatory Capital Reporting for Institutions Subject to the Advanced Capital Adequacy Framework (Form FFIEC 101)
In this note, we examine the contribution of dealer Treasury market intermediation to the leverage exposure of U.S. Global Systemically Important Banks (GSIBs) under the SLR rule. Using regulatory filings of the big six U.S. BHCs and data of their dealer subsidiaries, we estimate that Treasuries held at dealer subsidiaries account for less than 2 percent of TLE, while their Treasury secured financing transactions (SFTs)5 account for about 6 percent of TLE. The share of dealers' TLE due to Treasury intermediation activities has changed little in recent years. While these contributions to TLE are modest, it is possible that dealers could limit their Treasury intermediation in response to SLR pressures emerging from an increase in BHCs' overall balance sheet size. To provide insights into the effect of changes in the SLR constraint on intermediation, we examine the temporary exclusions of Treasury securities and reserves from TLE between April 2020 and March 2021. We do not observe any noticeable effect of the exclusions on dealers' direct holdings of Treasuries or their SFTs backed by Treasuries.
Treasury Intermediation Is One of Many Factors Affecting Total Leverage Exposure
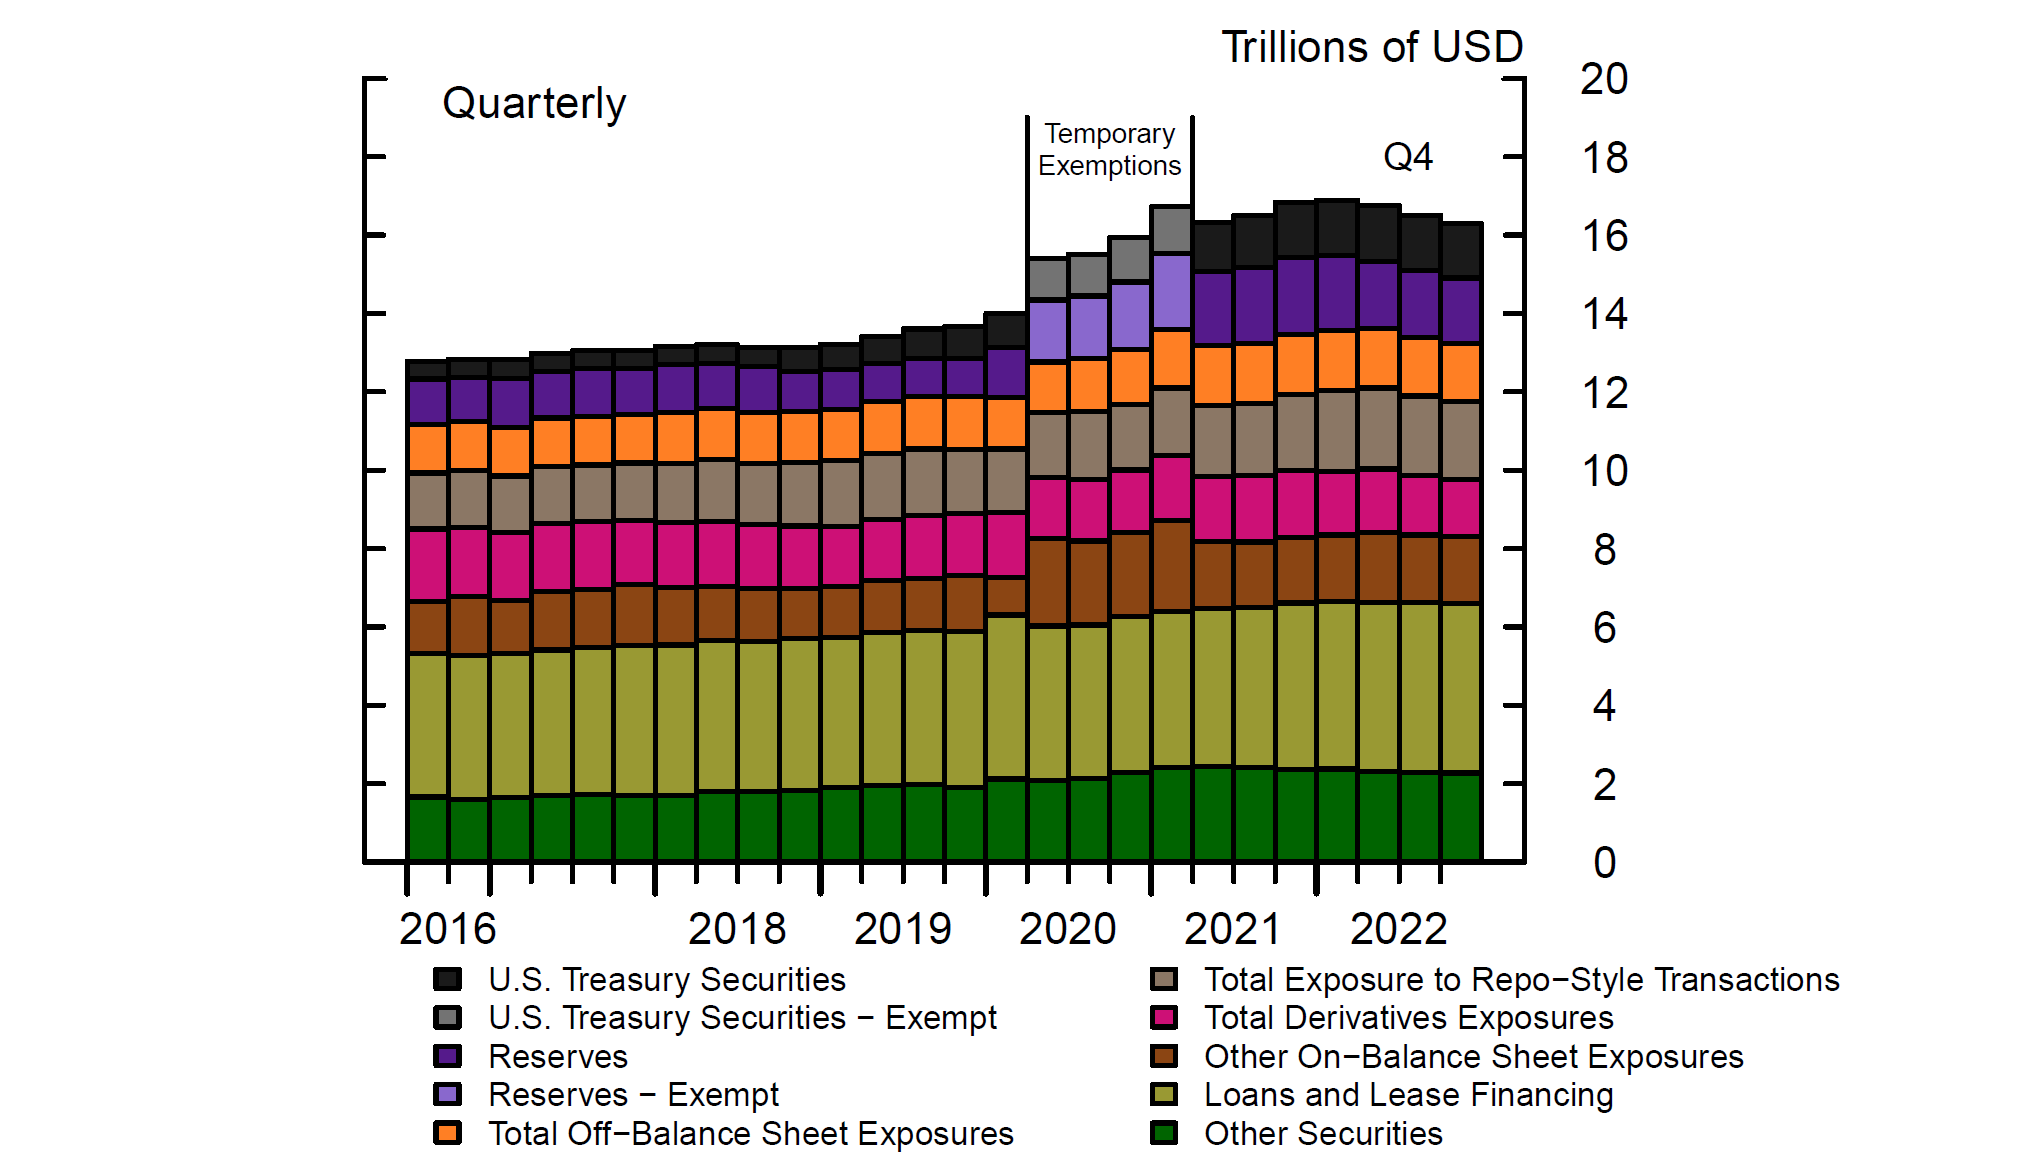
We start by examining the footprint of Treasury market activities on BHCs' reported SLRs, as measured by the contribution of these activities to TLE. Figure 4, panels (A) and (B) show the contributions to TLE of different on-balance sheet items, including reserves, Treasury securities holdings, other securities, and loan and lease financing, as well as total derivative exposures (both on- and off-balance sheet), exposures for repo-style transactions (both on- and off-balance sheet), and other off-balance sheet exposures such as loan commitments, as reported in banks' regulatory disclosures.6 Overall, for the big six U.S. BHCs, reserves account for just under 10 percent of their TLE (dark purple bars). Outright Treasury holdings account for about 8 percent, with this share having doubled since 2019 (black bars). Total repo-style transactions, including repo backed by Treasury securities and other collateral classes, account for 13 percent of TLE (light brown bars), approximately half of which is estimated to be backed by Treasury collateral. The bulk of TLE is related to non-Treasury market activities, especially loan and lease financing (25 percent) and non-Treasury securities holdings (13 percent).
Total Contributions to TLE (Panel A).
Percent Contributions to TLE (Panel B).
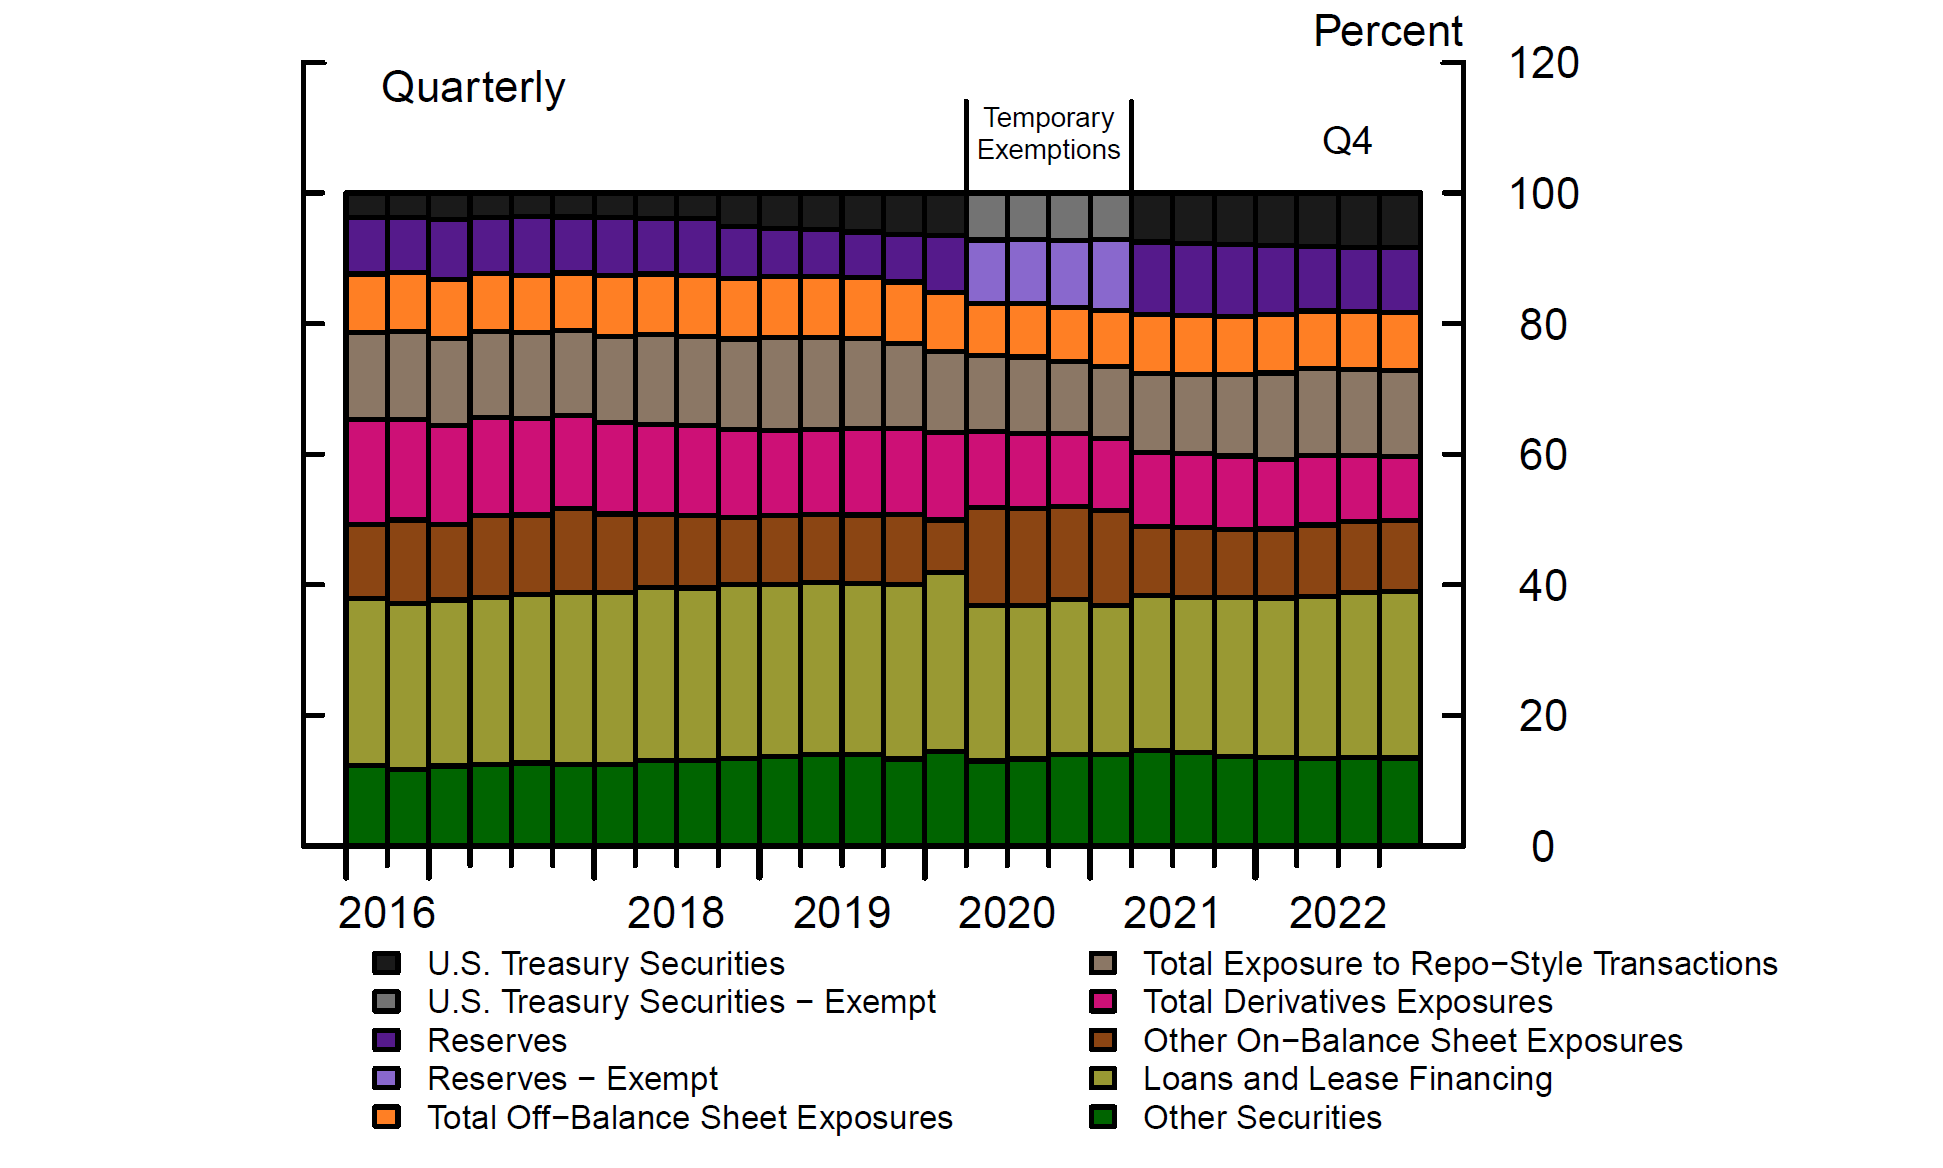
Note: “Other Securities” includes GSE obligations, municipal securities, MBS, structured financial products, and other debt securities. “Other On-Balance Sheet Exposures” includes the balance sheet carrying value of all on-balance sheet assets less Treasuries, reserves, assets for derivative transactions, and assets for repo-style transactions. In panel (B) , contributions to TLE during the exemption period are calculated as percentage of TLE including the exempt categories. The key identifies bars in order from top to bottom.
Source: Federal Financial Institutions Examination Council, Regulatory Capital Reporting for Institutions Subject to the Advanced Capital Adequacy Framework (Form FFIEC 101) and Board of Governors of the Federal Reserve System, Consolidated Financial Statements for Holding Companies (Form FR Y-9C)
The decrease in SLRs shown in Figure 1, which accelerated in late 2019, was largely driven by a broad-based expansion of BHC balance sheets, including loans and securities holdings. The temporary exclusions of Treasury holdings and reserves from TLE led to a notable increase in SLRs between April 2020 and March 2021, even as banks' reserves and Treasury holdings expanded. After March 2021, the reinstatement of banks' Treasuries holdings and reserves was the main factor contributing to the increase in TLE (decrease in SLR). Going forward, the contribution from reserve holdings is likely to decrease as the Federal Reserve reduces the size of its balance sheet. However, demand for dealer intermediation in the Treasury cash and repo market is likely to rise with the amount of Treasury securities that are privately held, increasing the contribution of Treasury market activities.
Dealers' Treasury Positions Make Only Modest Contributions to the SLR
Although dealers' Treasury securities holdings and financing are only a small fraction of TLE, the high-volume, low-margin, and high frequency nature of Treasury market intermediation might make it more sensitive to the SLR constraint than lending and other banking activities. Therefore, we next examine the relation between dealers' Treasury market intermediation activities—including market making and secured financing—and the SLR. Dealers provide immediacy in Treasury securities markets by taking long and short Treasury positions to accommodate client order flow. Treasury market making by BHC-affiliated dealers thus requires balance sheet capacity and proportionately contributes to TLE. In addition, depository institutions (DIs) hold Treasuries and other securities on their balance sheets for their own investment purposes, with the bulk of these securities held-to-maturity. Activity at both the dealer and DI levels therefore contribute to banks' SLR at the BHC level. Using data from FR Y-9C, Consolidated Financial Statements of Holding Companies, Figure 5, panels (A) and (B) show the contributions to the TLE from BHCs' securities holdings, including Treasury and non-Treasury securities, for the banks in our sample.7 Security holdings are split into trading securities, which are more likely to be held at the dealer level, versus other securities (held-to-maturity and available-for-sale), which are mostly held at the DI level. Among Treasury securities, those that are held for trading (black bars) have been roughly flat since early 2019, while other Treasury holdings, including those held-to-maturity and those available-for-sale (grey bars), doubled over the period. The share of Treasuries held for trading (black bars), as a percentage of total securities holdings, has been declining since March 2020 (panel B). The current share of Treasury securities held for trading accounts for about one-quarter of total Treasury holdings, suggesting that dealers' Treasury security holdings account for about 2 percent of TLE.
Total Contributions by Security Type (Panel A).
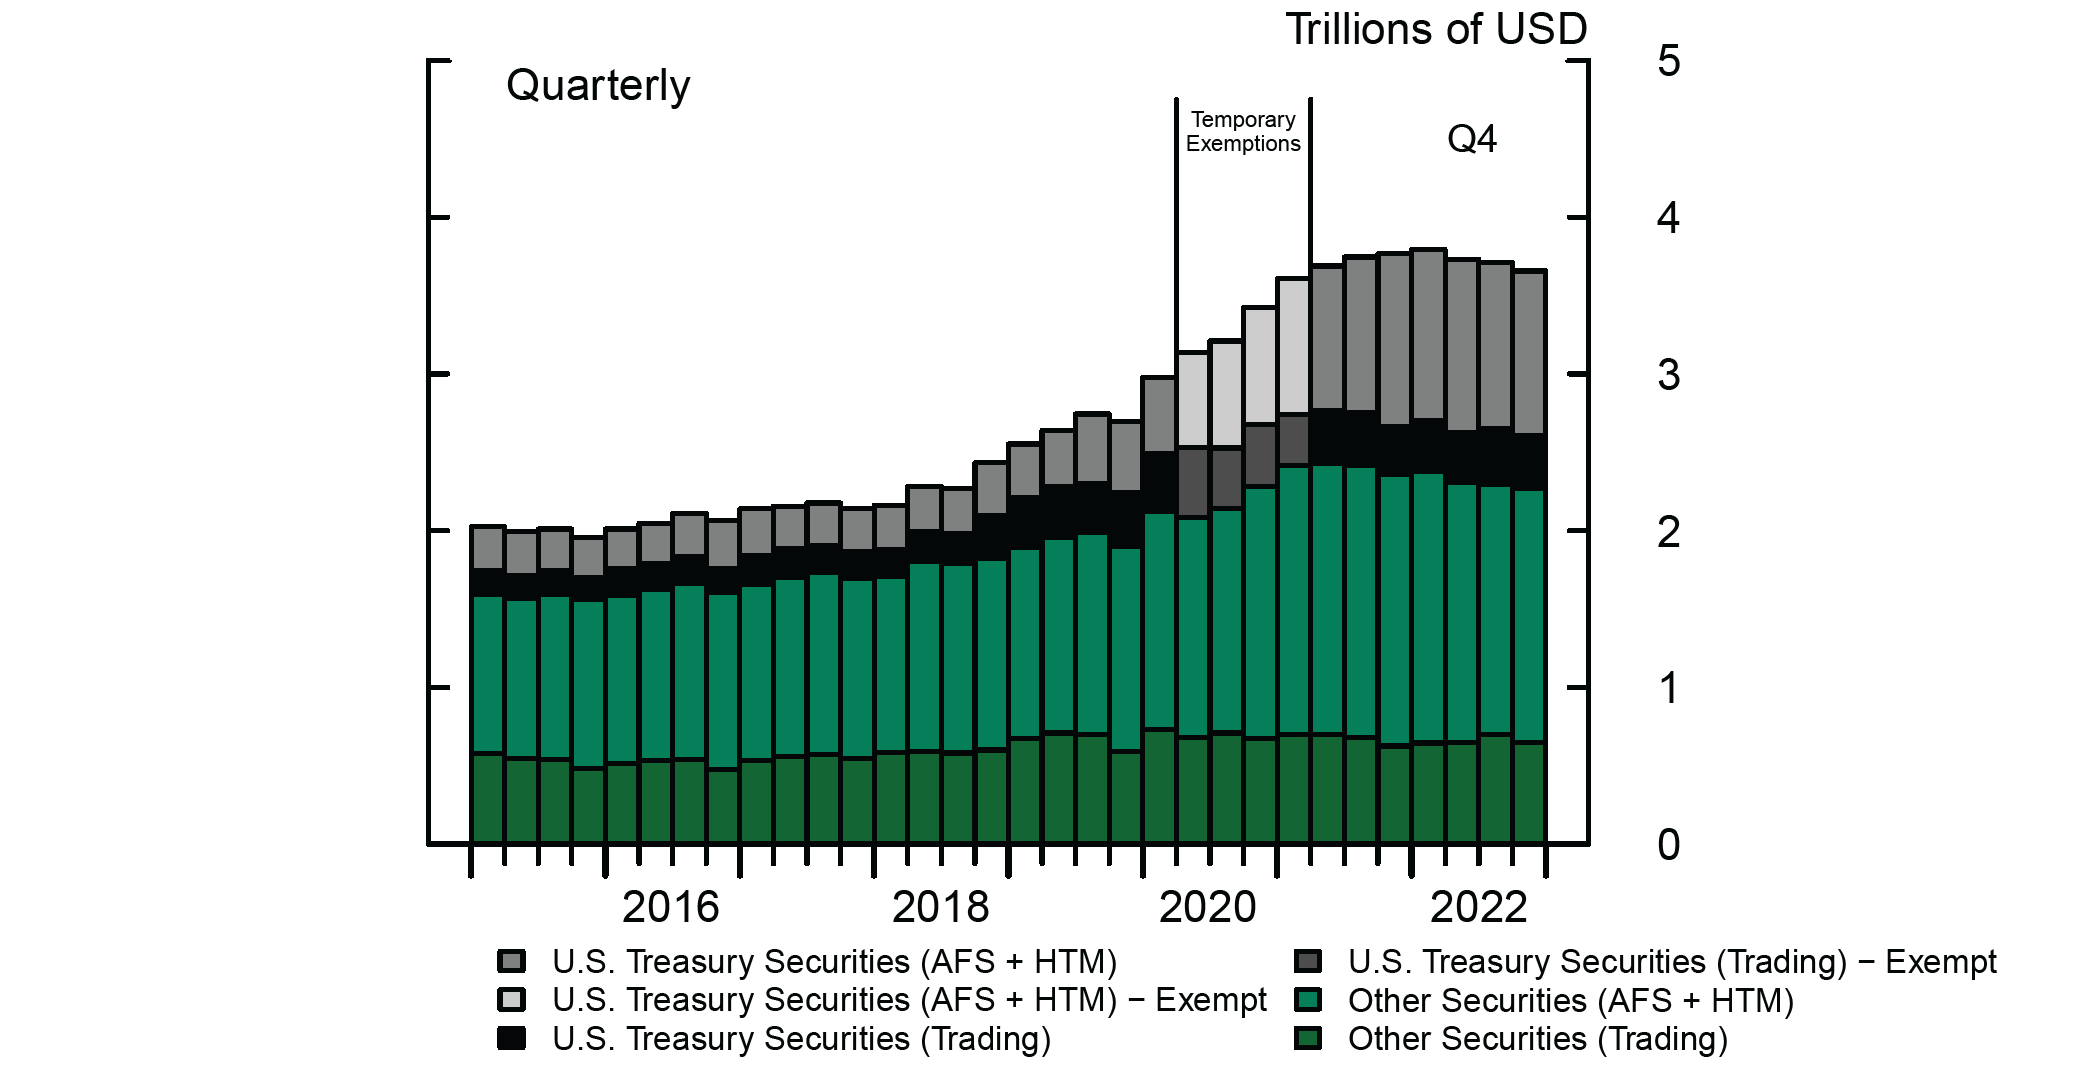
Percent Contributions by Security Type (Panel B).
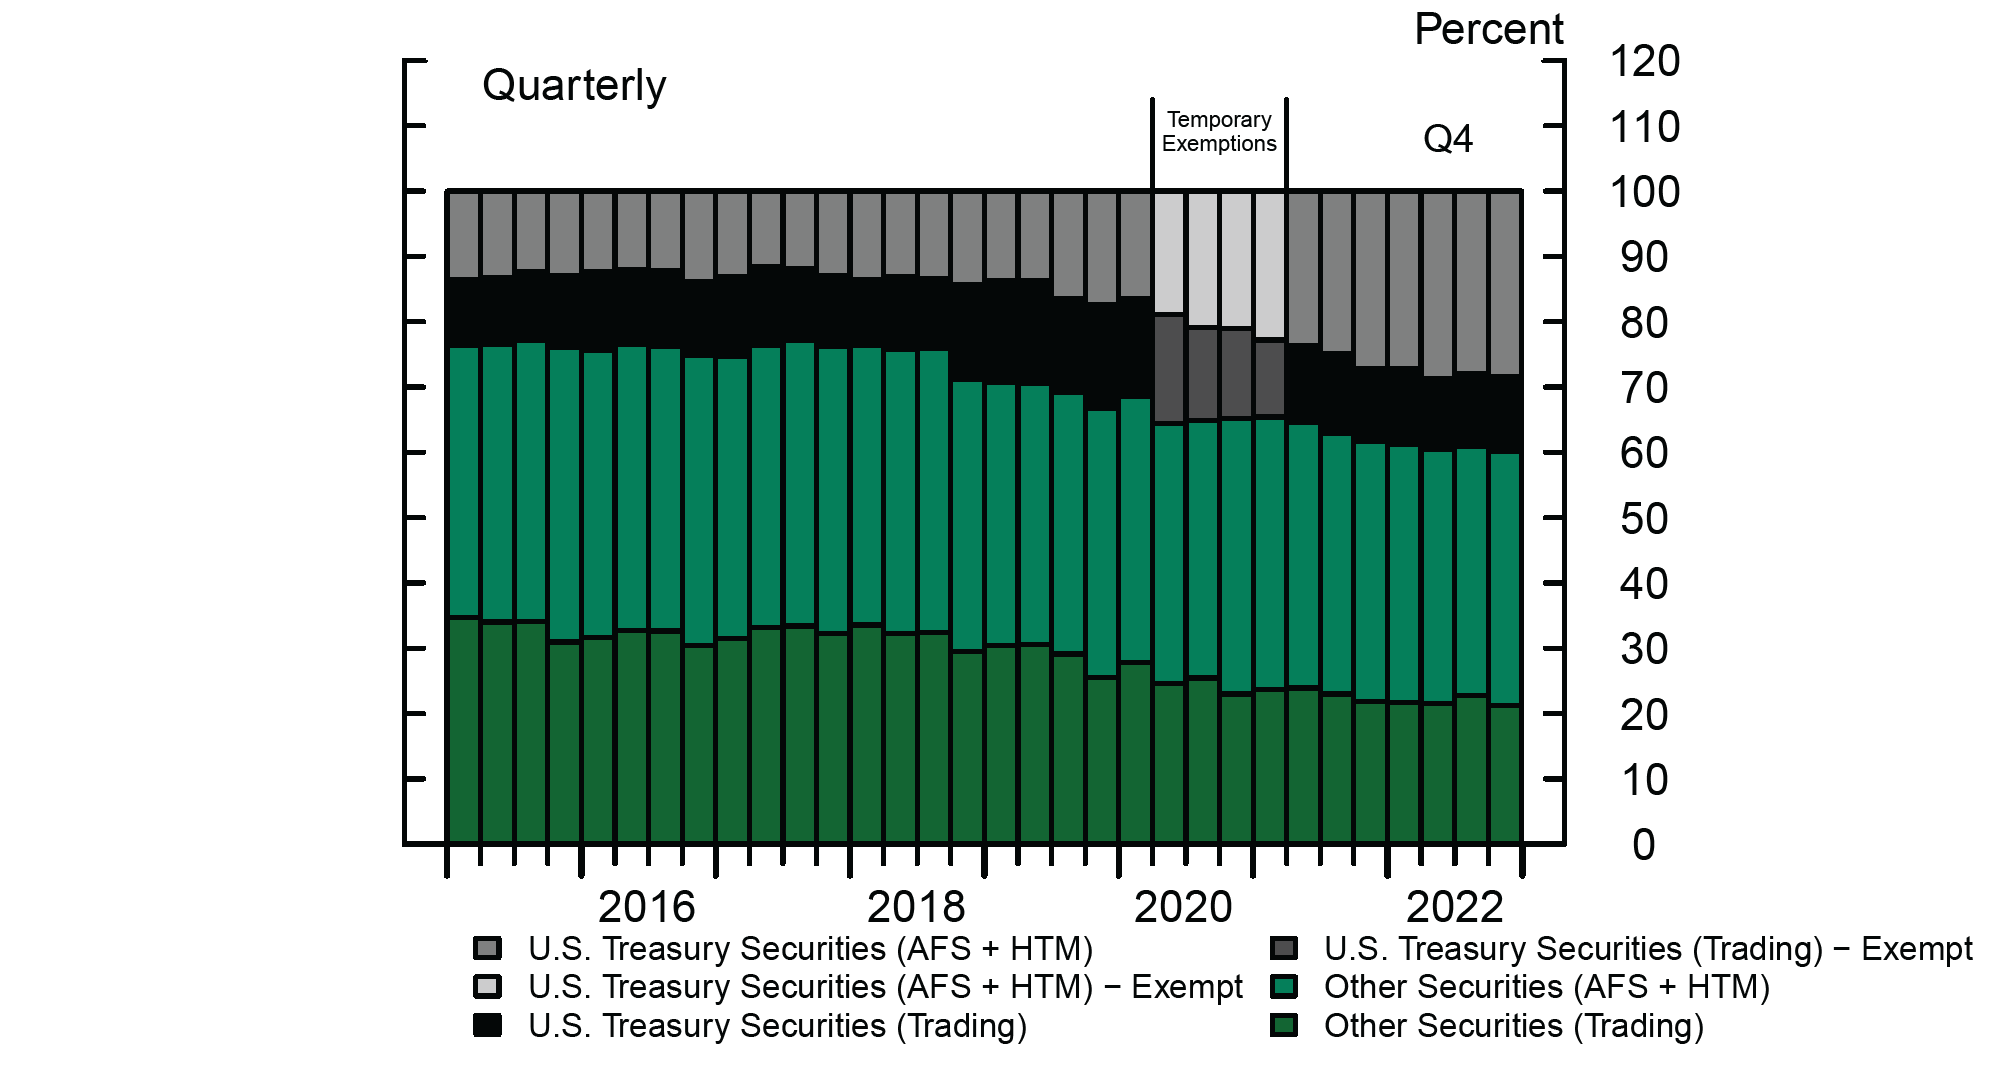
Note: The accounting type of each security is in parenthesis. “Other Securities” is a sum of ABS, structured financial products, MBS, and other debt securities. In panel (B), contributions to TLE during the exemption period are calculated as percentage of TLE including the exempt categories. The key identifies bars in order from top to bottom.
Source: Board of Governors of the Federal Reserve System, Consolidated Financial Statements for Holding Companies (Form FR Y-9C)
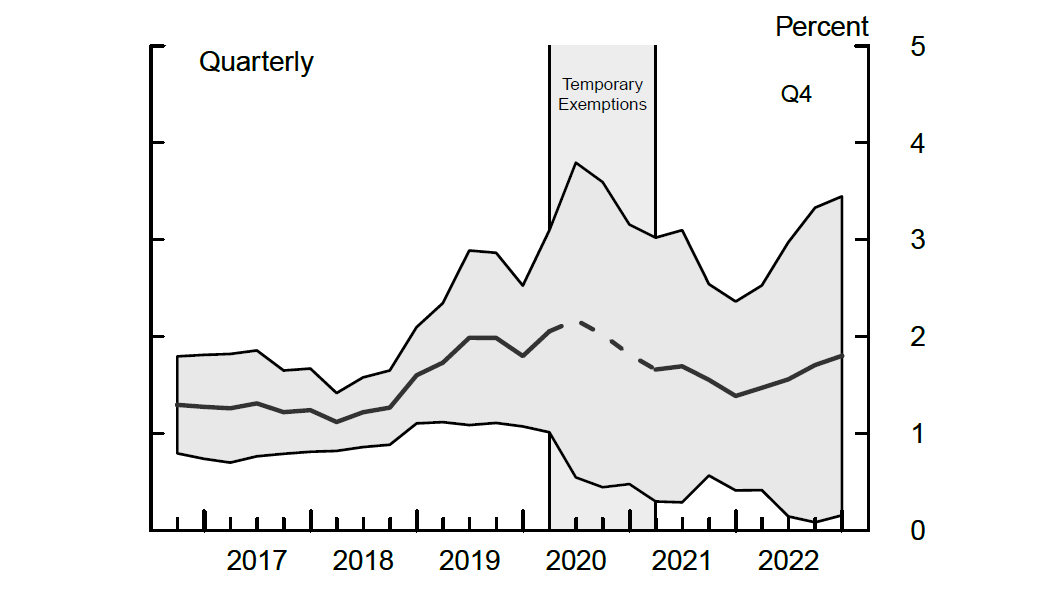
More granular data from the Complex Institution Liquidity Monitoring Report (FR 2052a), reported at the BHC and dealer levels, confirm that the majority of Treasury securities are held outside of the dealer subsidiary.8 The grey line in Figure 6 shows the average share of Treasury long positions held at the dealer level relative to those at the BHC level, with the shaded grey area representing the cross-sectional standard deviation of the six BHCs in our sample. Consistent with observations from the FR Y-9C data, dealers' share of Treasury long positions is small, currently at around 22 percent on average across the big six dealers. This share has declined notably since 2016, with the steepest declines occurring during the temporary exemptions of Treasuries and reserves from the TLE, as DIs absorbed some of the increased Treasury issuance into their investment portfolios in the face of large deposit inflows and limited lending opportunities. Since 2021, the dealer share has increased slightly. The cross-sectional standard deviation in the share of Treasury positions is large, implying a range for the contribution from dealers' Treasury holdings between 0.02 percent and 3.7 percent of TLE, with a mean close to 2 percent (Figure 7). Thus, the contribution from dealer's Treasury market making to the SLR appears limited. While dealers' Treasury market making is an important component of dealers' intermediation in Treasury markets, a large fraction of dealer activity is providing financing to clients through SFTs. We next turn to the effect of dealers' Treasury SFTs on the SLR.
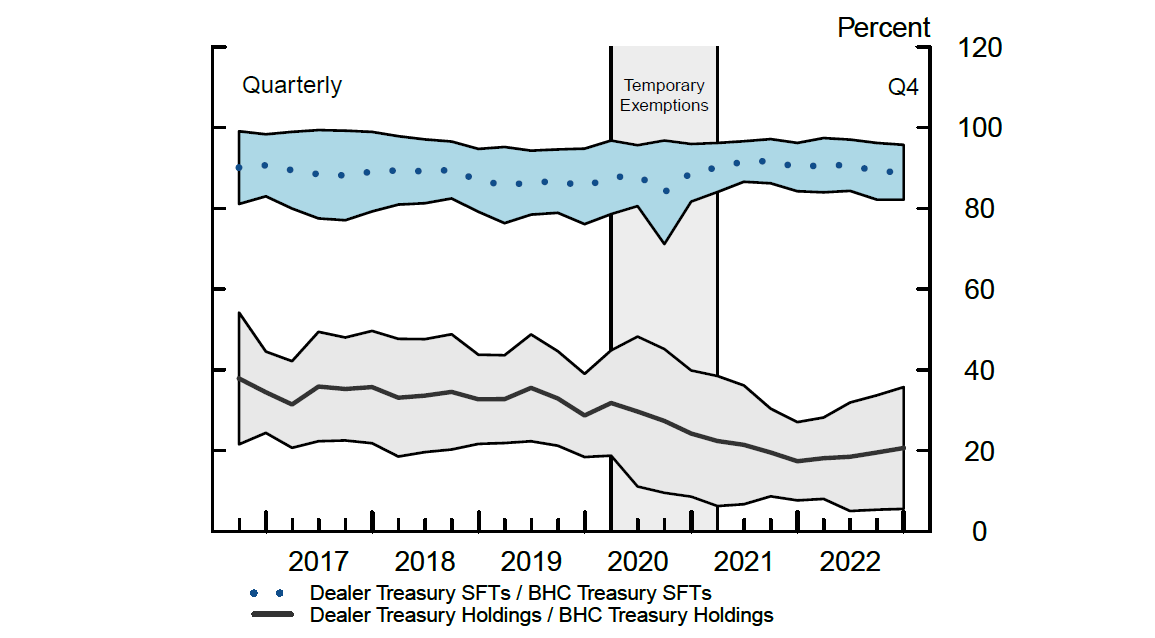
Note: The figure shows estimated dealer Treasury activities relative to BHC Treasury activities. Shading shows ± 1 standard deviation and the solid lines show the average across the big six dealers. The key identifies the lines in order from top to bottom.
Source: Board of Governors of the Federal Reserve System, Complex Institution Liquidity Monitoring Report (Form FR 2052a), Federal Financial Institutions Examination Council, Regulatory Capital Reporting for Institutions Subject to the Advanced Capital Adequacy Framework (Form FFIEC 101), and Board of Governors of the Federal Reserve System, Consolidated Financial Statements for Holding Companies (Form FR Y-9C)
Note: Contributions to TLE during the exemption period are calculated as percentage of TLE including the exempt categories and are shown dashed as Treasuries were exempt during this period. Shading shows ± 1 standard deviation and the solid lines show the average across the big six dealers.
Source: Board of Governors of the Federal Reserve System, Complex Institution Liquidity Monitoring Report (Form FR 2052a)
Dealers' Treasury Financing Makes Significant Contributions to the SLR
Figure 4 panel (B) indicates that repo style transactions (SFTs) account for approximately 13 percent of large BHCs' TLE (light brown bars). SFTs play several important roles that support Treasury market functioning. First, SFTs allow banks to borrow and lend funds collateralized by Treasuries. Second, SFTs allow banks to source and distribute Treasury securities as collateral. These activities allow dealers, and their counterparties, to take on leveraged long and short positions in Treasury securities, enhancing overall market liquidity and price discovery. The contribution of SFTs to TLE is reduced by the effect of balance sheet netting, which allows BHCs to offset, under certain conditions, the value of reverse repo receivables by the value of repo payables.9
We use the more granular data reported in the FR 2052a and focus on Treasury SFTs. As shown in Figure 8, Treasury-backed SFTs account for about one-half of the total SFTs at the BHC level (dotted blue line). Turning to dealers' roles in these markets, the dotted blue line in Figure 6 shows the average fraction of Treasury SFTs at the dealer level relative to the total amount of Treasury SFTs at the BHC level. As before, the shaded area around both lines shows the cross-sectional standard deviation of these fractions across the six banks in our sample. The figure shows the average fraction of dealers' SFT activity relative to the entire BHC, which is a little under 90 percent.10 The high level of average dealer SFT Treasury holdings, and the relatively tight standard deviation around it, indicate that the majority of this activity is concentrated at dealer subsidiaries. This underscores the outsized role dealer subsidiaries play in BHCs' provisioning of funds via SFTs. Overall, combining these estimates with the fraction of SFTs backed by Treasury collateral, we estimate that dealers' SFTs backed by Treasury securities contribute about 6 percent to total TLE, and their share of TLE has changed little in recent years (Figure 9).
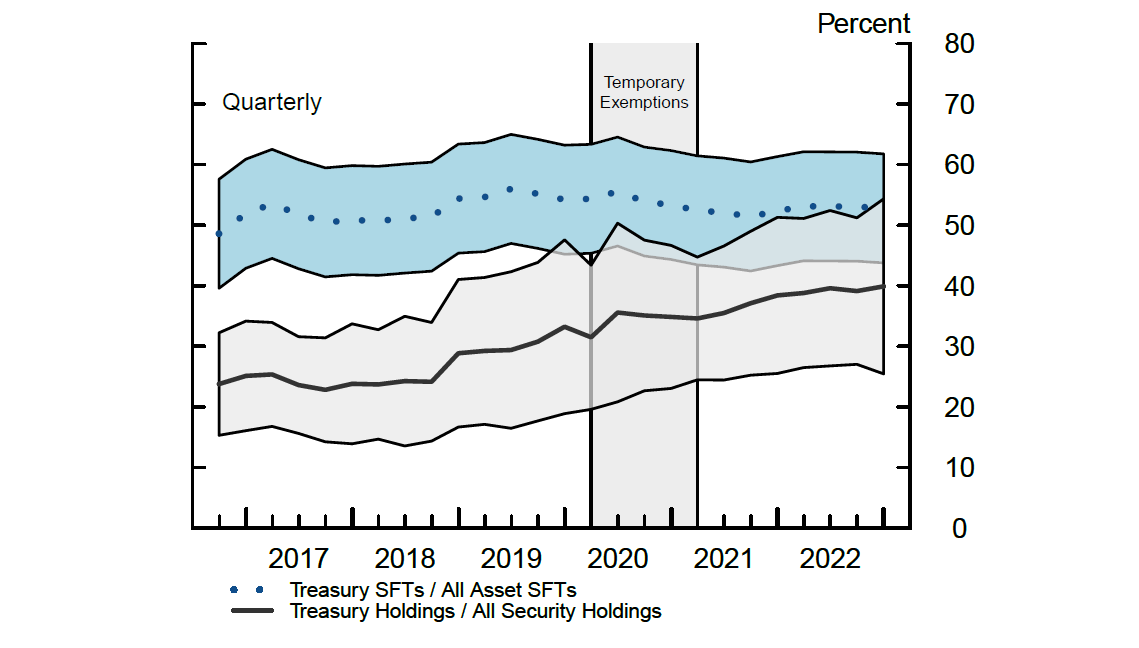
Note: Figure shows estimated BHC Treasury activities relative to total BHC securities activities. Shading shows ± 1 standard deviation and the solid lines show the average across the big six BHCs. The key identifies the lines in order from top to bottom.
Source: Board of Governors of the Federal Reserve System, Complex Institution Liquidity Monitoring Report (Form FR 2052a) and Board of Governors of the Federal Reserve System, Consolidated Financial Statements for Holding Companies (Form FR Y-9C)
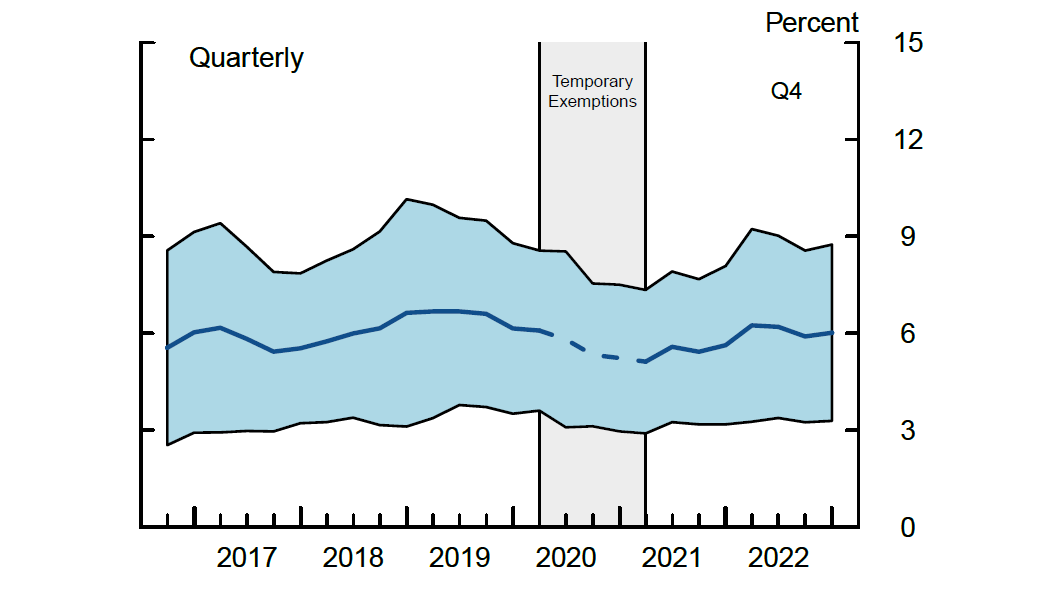
Note: Contributions to TLE during the exemption period are calculated as percentage of TLE including the exempt categories and are shown dashed as Treasuries were exempt during this period. Shading shows ± 1 standard deviation and the solid lines show the average across the big six dealers.
Source: Federal Financial Institutions Examination Council, Regulatory Capital Reporting for Institutions Subject to the Advanced Capital Adequacy Framework (Form FFIEC 101) and Board of Governors of the Federal Reserve System, Complex Institution Liquidity Monitoring Report (Form FR 2052a)
Temporary Changes in the SLR Rule Did Not Have a Noticeable Effect on Bank and Dealer Behavior
Despite the modest contribution from dealers' Treasury market making and financing to TLE, it is possible that dealers could limit their Treasury intermediation in response to SLR pressures emerging from increases in BHCs' balance sheet size.11 For example, as bank balance sheets grew due to increased reserve levels and widespread selling of Treasuries during the COVID-19 outbreak in March 2020, there were concerns that dealers' intermediation abilities could become constrained by the SLR requirement. Amid a significant deterioration in Treasury market liquidity, the Fed announced a temporary change to the SLR, which excluded reserves and Treasury security holdings from the SLR denominator.12 The change to the SLR, which lasted from April 1, 2020, to March 31, 2021, was intended to ease the stress in Treasury markets by mitigating the possibility that the SLR was constraining dealers' intermediation activity.
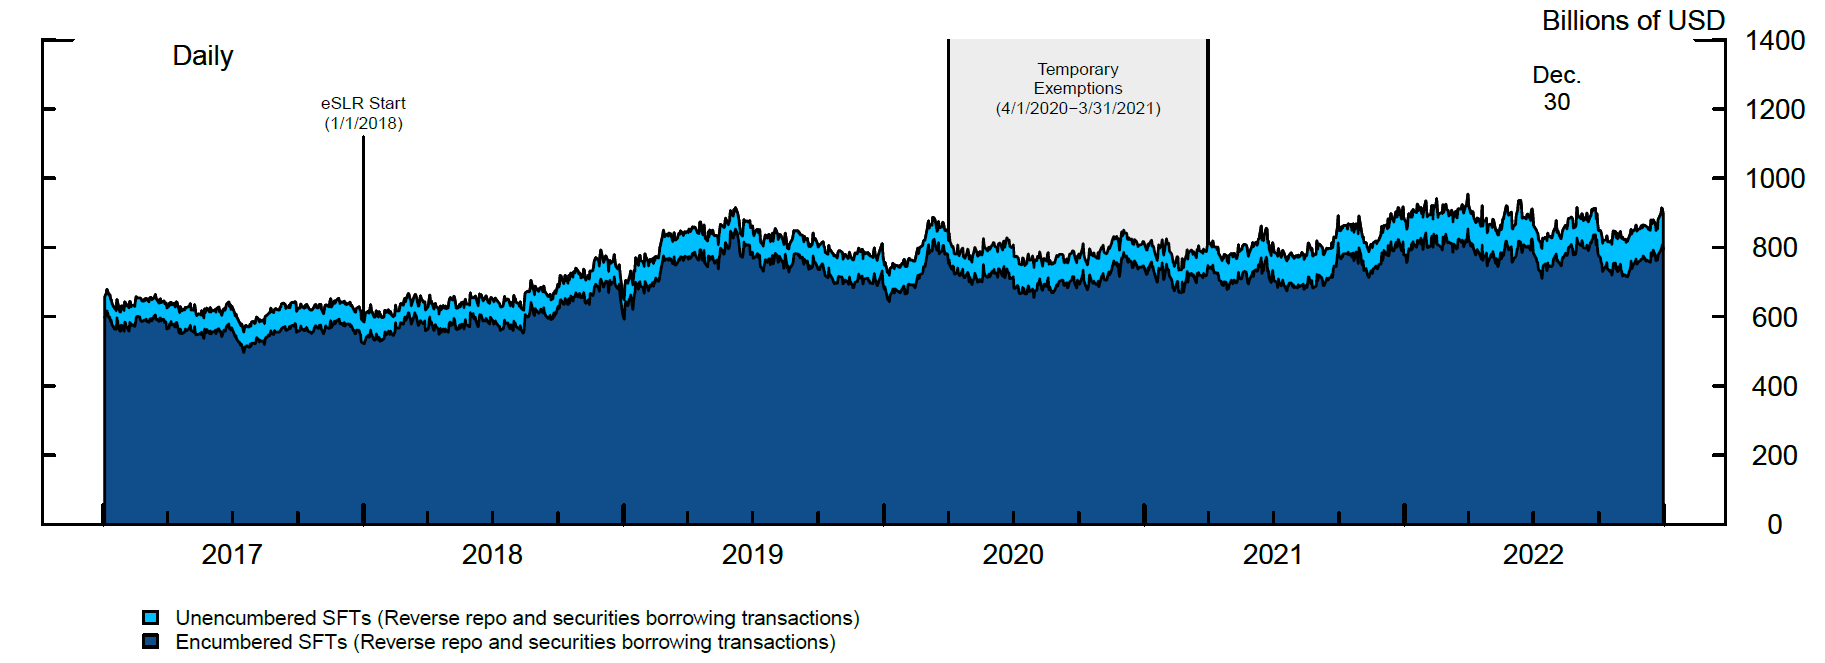
We use the FR 2052a data to analyze changes in the big six dealers' participation in Treasury markets around the exemption period. Although the SLR applies at the BHC level (and, separately, at the DI level), as indicated previously, most of banks' intermediation activity is done at the dealer level. These data also allow us to separate between encumbered and unencumbered positions and SFTs. Encumbered positions and SFTs are financed via (another) SFT. Thus, encumbered positions and SFTs increase the size of banks' balance sheets and decrease their SLR, in general. Unencumbered positions and SFTs are not necessarily supported by an increase in BHCs' liabilities, and therefore their effect on banks' balance sheet size and SLR is ambiguous.13 As shown in Figures 10 and 11, significant majorities of dealers' Treasury positions and SFTs are encumbered. Thus, increases in dealers' Treasury intermediation activities will generally increase balance sheet size.
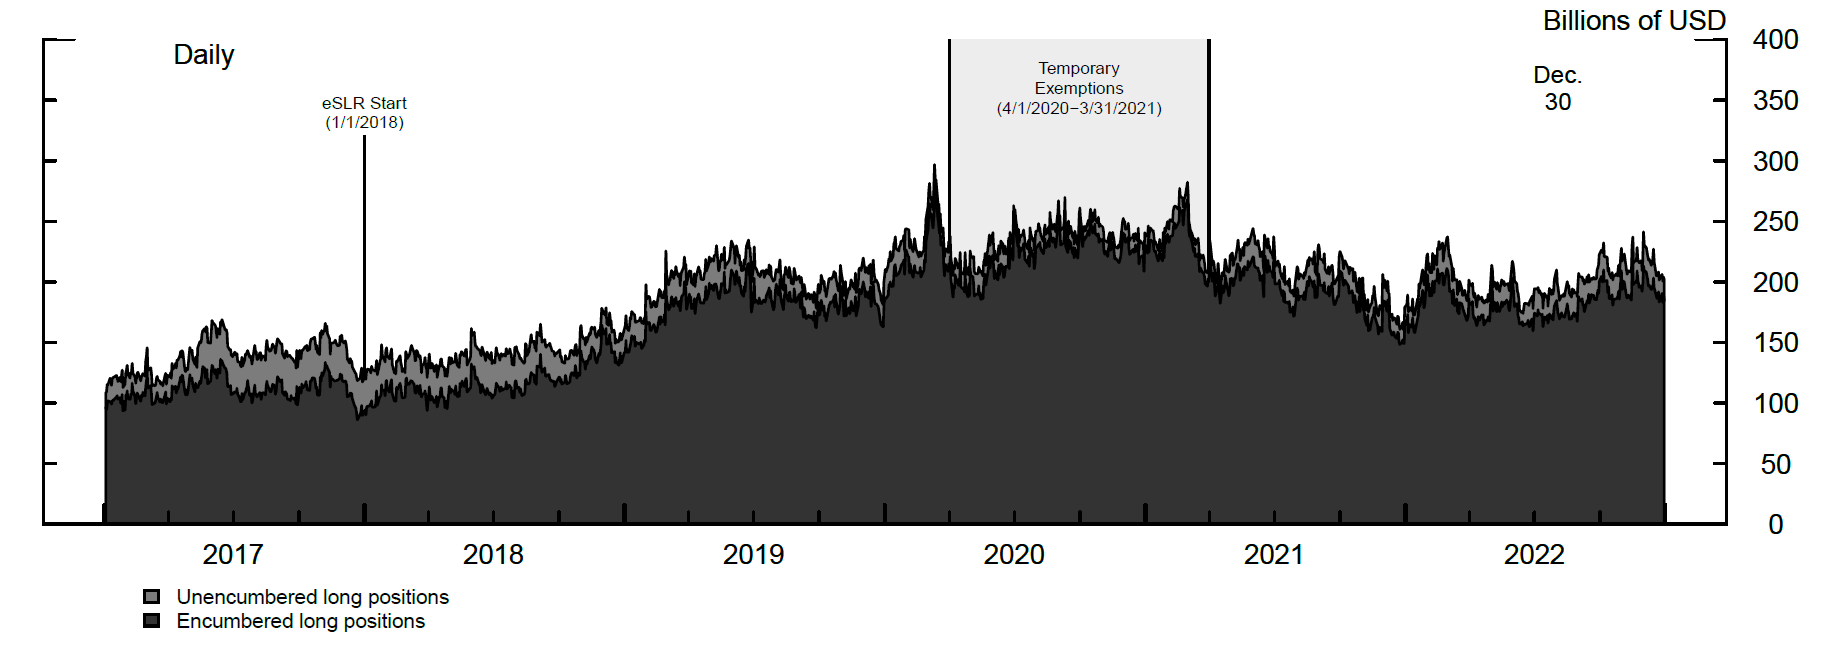
Note: Encumbered positions are financed through SFTs, while unencumbered positions may be financed with equity or other types of debt. The key identifies areas in order from top to bottom.
Source: Board of Governors of the Federal Reserve System, Complex Institution Liquidity Monitoring Report (Form FR 2052a)
Note: The key identifies areas in order from top to bottom.
Source: Board of Governors of the Federal Reserve System, Complex Institution Liquidity Monitoring Report (Form FR 2052a)
Figure 10 shows the Treasury positions of the big six held at the dealer. Dealers' Treasury positions, which are overwhelmingly encumbered, did not change significantly during the exemption period or after its expiration. Figure 11 shows the big six banks' Treasury SFT transactions at the dealer level, where the vast majority of Treasury SFT activity occurs. Dealer Treasury SFTs are overwhelmingly encumbered, which is consistent with matched-book repo activity (i.e., the dealer uses the incoming security from a reverse repo transaction as the outgoing collateral in a repo transaction). Dealers' Treasury SFT activity peaked in March 2020 but did not change significantly during the SLR exemption period. Overall, our inspection during the temporary exclusions of Treasury securities and reserves from TLE between April 2020 and March 2021 does not show a noticeable effect on the big six dealers' Treasury intermediation, including direct holdings of Treasuries and SFTs backed by Treasuries.
1. We thank Rochelle Edge, Dan Li, Bert Loudis, Holly Kirkpatrick, Hillel Kipnis, and Min Wei for helpful comments. Return to text
2. The big six U.S. BHCs are the following firms: Bank of America, Citibank, Goldman Sachs, JPMorgan Chase, Morgan Stanley, and Wells Fargo. Return to text
3. GSIB bank holding companies must maintain a supplementary leverage ratio greater than 3 percent plus a leverage buffer of 2 percent to avoid limitations on the banking organization's capital distributions and certain discretionary bonus payments. Return to text
4. Total leverage exposure is the denominator of the SLR ratio and includes both on-balance sheet assets and certain off-balance sheet exposures, such as the potential future exposures associated with derivative contracts. Return to text
5. SFTs are equivalent to secured loans backed by financial securities. These include repo, securities lending contracts, and collateral swaps. Return to text
6. We combine information from Form FFIEC 101 (Regulatory Capital Reporting for Institutions Subject to the Advanced Capital Adequacy Framework) with detailed data on securities holdings from Form FR Y-9C (Consolidated Financial Statements for Holding Companies). Return to text
7. The bulk of dealers' non-Treasury securities holdings is comprised of agency securities and MBS. Return to text
8. The FR 2052a data is used to monitor an individual organization's overall liquidity profile as well as provide detailed information on liquidity risks within different business lines. The data serve as part of the Fed's supervisory surveillance program in its liquidity risk management area. U.S. firms that are global systemically important BHCs must submit data for the global consolidated entity, the parent company, and separately for each material entity (bank subsidiaries with total consolidated assets of more than $10 billion). The big six firms report data in the FR 2052a form at a daily frequency. Return to text
9. Intermediaries can net their gross SFT positions if they satisfy three conditions: 1) they involve the same counterparty, 2) they are settled on the same platform, and 3) they have the same maturity date. According to regulatory filings, the total reduction in SFTs contribution to TLE is reduced by approximately 30 percent because of netting. Return to text
10. The drops in the series are driven by individual banks' change in SFT activity. Return to text
11. Recent research suggests that in March 2020 dealers with lower SLR ratios tended to reduce their Treasury market participation more significantly in response to balance sheet shocks. See Favara, Infante, and Rezende (2022), "Leverage Regulations and Treasury Market Participation: Evidence from Credit Line Drawdowns", working paper. Return to text
12. Of note, the exemption did not exclude SFTs backed by Treasury securities. Return to text
13. For example, if a firm used retained earnings to purchase Treasuries, or to engage in a Treasury-backed reverse repo, the resulting position would be unencumbered and would not directly increase the size of the balance sheet. Return to text
Cochran, Paul, Sebastian Infante, Lubomir Petrasek, Zack Saravay, and Mary Tian (2023). "Dealers Treasury Market Intermediation and the Supplementary Leverage Ratio," FEDS Notes. Washington: Board of Governors of the Federal Reserve System, July 28, 2023, https://doi.org/10.17016/2380-7172.3341.
Disclaimer: FEDS Notes are articles in which Board staff offer their own views and present analysis on a range of topics in economics and finance. These articles are shorter and less technically oriented than FEDS Working Papers and IFDP papers.