FEDS Notes
June 21, 2021
Did the U.S. Bilateral Goods Deficit With China Increase or Decrease During the US-China Trade Conflict?
Hunter L. Clark and Anna Wong
The United States' bilateral goods trade deficit with China appeared to have narrowed substantially since the escalation of the U.S.-China trade conflict in 2018, or so U.S. trade data suggest. By contrast, the Chinese data tell a much different story: the deficit, as implied by China's bilateral surplus, nearly reached historical highs by the end of 2020. Historically, the discrepancy between these trade balance figures had remained fairly predictable and stable. But with the onset of the trade conflict, U.S.-reported import values from China have fallen more sharply than the China-reported export values to the United States. Two reasons are likely responsible for this phenomenon: (1) U.S. importers underreporting Chinese imports in order to evade U.S. tariffs, and (2) Chinese exporters reporting higher exports due to changes in tax incentives in China. In this note, we find that the majority of the shift in discrepancy can be explained by the first factor, with an estimated $10 billion annual loss in U.S. tariff revenues due to underreported U.S. imports.
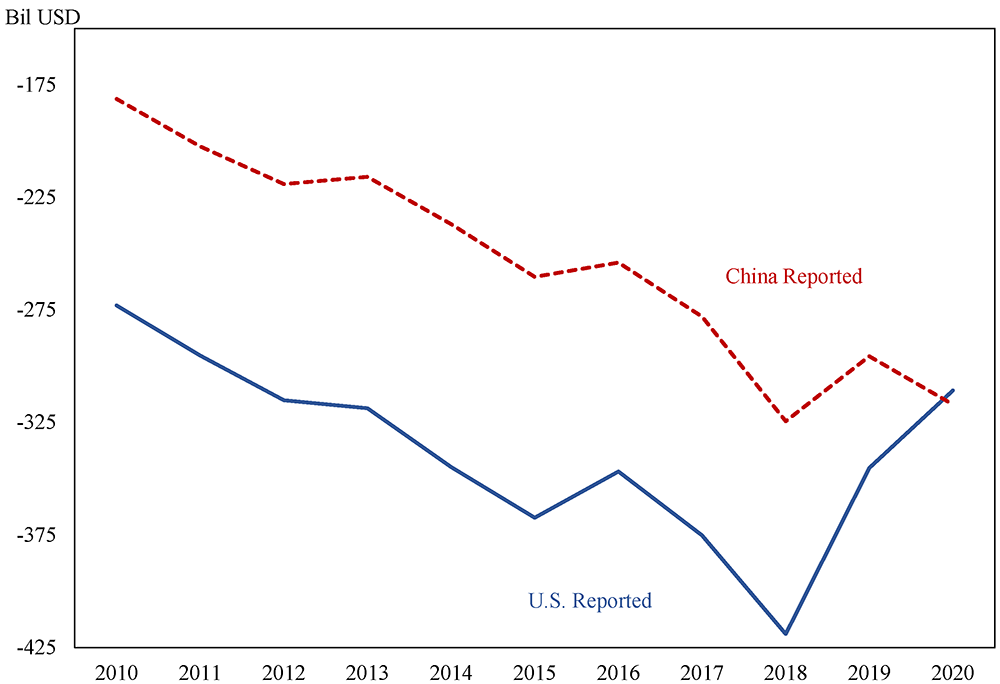
Note: "China Reported" = Chinese imports from the United States – Chinese exports to the United States; "U.S. Reported" = U.S. imports from China – U.S. exports to China.
Source: China Customs and U.S. Census
What Might Have Prompted the Shift in the Trade Balance Discrepancy?
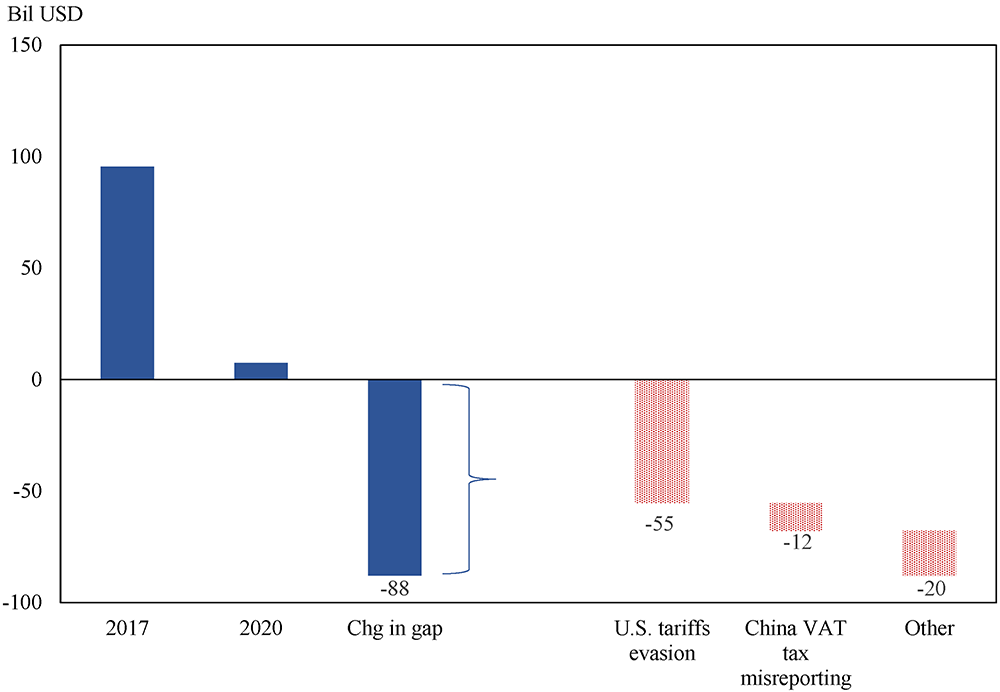
The U.S.-reported bilateral deficit with China has historically been about $95 billion larger than its Chinese-reported counterpart surplus, but this statistical gap has narrowed significantly since the U.S.-China trade conflict began in 2018, and even reversed sign in 2020 (Figure 1). This is primarily because U.S. imports from China, as reported by the U.S. Census, fell sharply in 2018 and 2019, whereas Chinese exports to the United States as published by the Chinese Customs showed a more subdued decline over the same period (Figure 2). Conversely, the upswing in Chinese exports to the United States since mid-2020 was stronger in Chinese statistics than as indicated by U.S. statistics. For the first time ever, China's reported exports to the U.S. has become larger than U.S.-reported imports from China (hereafter "trade data gap" will refer to U.S.-reported imports from China minus China's reported exports to the United States).
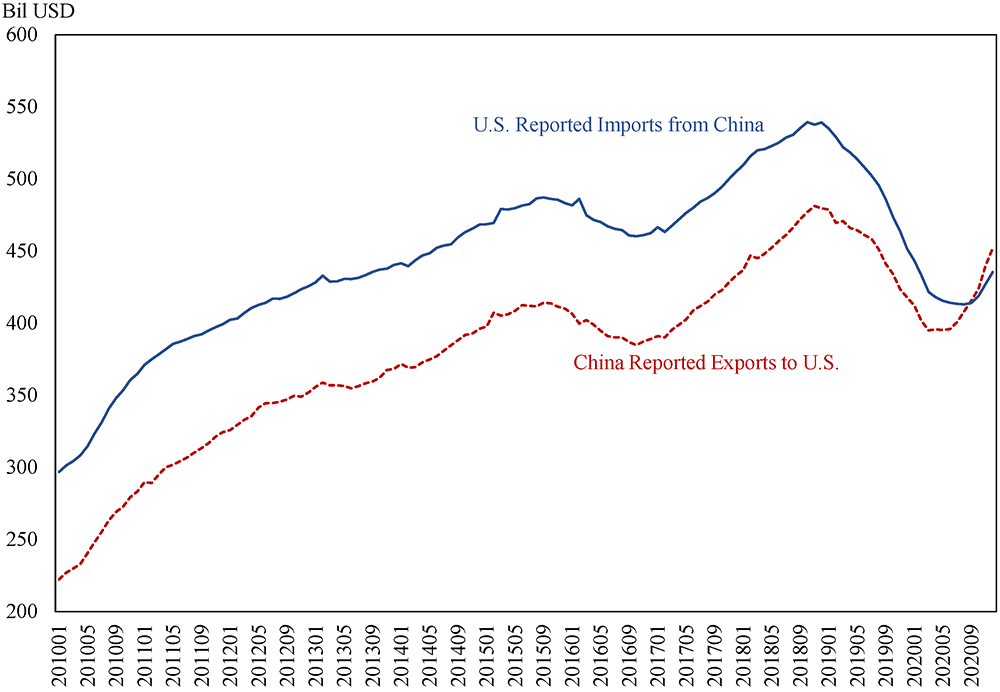
Source: China Customs, U.S. Census
Three factors have traditionally accounted for the trade data gap1: (1) Chinese re-exports through Hong Kong that were correctly reported in U.S. imports from Mainland China but not in Mainland China's exports to the United States; (2) Chinese firms misreporting exports to the Chinese customs in response to changes in VAT tax policies on exports2; (3) U.S. importers underreporting imports to U.S. customs, perhaps utilizing low-ball invoices supplied by their Chinese suppliers, in order to evade U.S. tariffs. Other quantitatively less important factors that could also distort the U.S.-China bilateral trade balance include routing trade through third countries to avoid the "made in China" label, mis-reporting by firms engaging in arms-length trade, or Chinese firms trying to circumvent Chinese capital controls.
In the past three years, Chinese re-exports through Hong Kong did not change enough to explain the shift observed in Figure 2. On the other hand, Chinese net VAT tax rates on exports (gross VAT tax rate minus VAT export rebate, hereafter referred to as "net VAT") did fall significantly and U.S. tariffs increased sharply during this period (Figure 3). Specifically, Chinese authorities lowered gross VAT rates from 17 percent to 13 percent, and increased export VAT rebate rates in four successive waves over the course of the trade conflict, causing average net VAT rates on exports to fall from close to 7 percent at the end of 2017 to around 2.5 percent in 2020. In fact, the share of export products facing zero net VAT rates increased dramatically from 5 percent of all goods in 2017 to about 50 percent by the end of this period. This drop in Chinese tax rates is part of China's multi-pronged responses to the U.S. section 301 tariff hikes, which increased from an average of 3 percent in mid-2018 to a peak statutory rate of 17.5 percent in September 2020.3
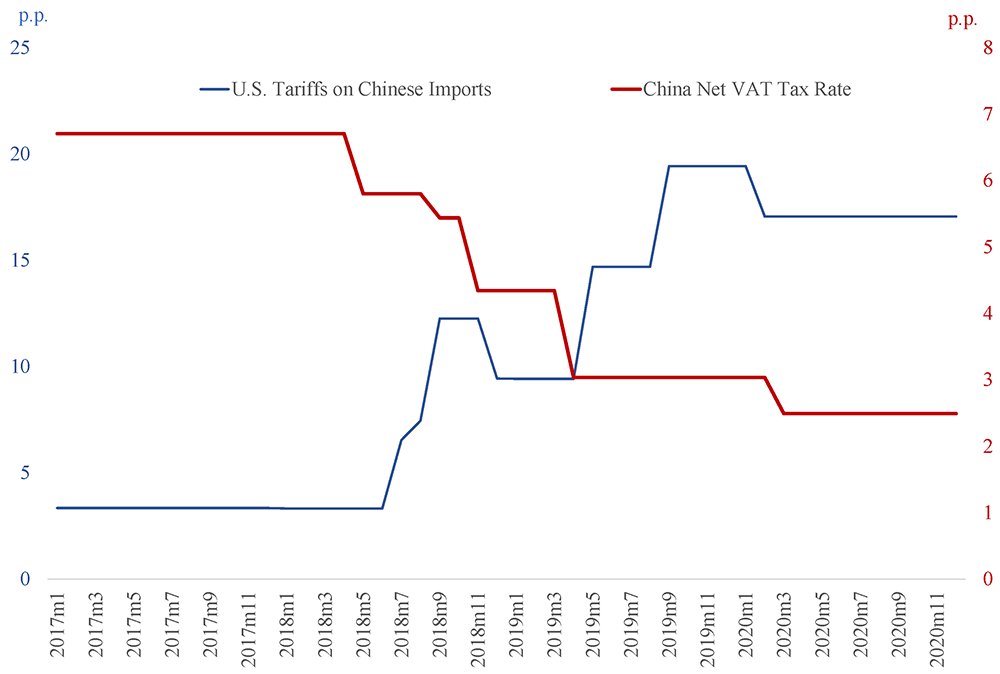
Source: China's State Administration of Taxation, USITC.
Because changes in Chinese tax policies on exports apply equally to all Chinese export destinations, the observed shift in the China-reported trade data gap with the United States should also occur with other Chinese export partners if the decrease in the net VAT tax did alter (mis)reporting incentives for Chinese firms. Figure 4 (left-hand panel) shows that indeed this is the case. On the other hand, the sharp hikes in U.S. tariffs on Chinese goods was bilateral in nature, and so the shift in the discrepancy in U.S. reported trade data should just be largely a U.S-China bilateral phenomenon if affected firms were motivated to evade the tariffs; Figure 4 (right panel) does confirm this. Both the timing and pattern of the trade data gaps across trade partners in Chinese and U.S. trade data suggest that U.S. tariff evasion and Chinese tax policies most likely played a key role in explaining the shifts in the U.S.-China trade data gap.
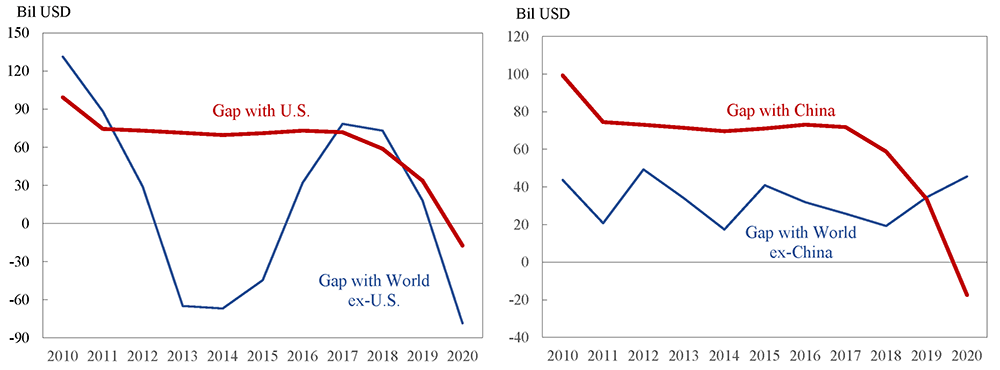
Note: "Trade data gap" refers to U.S.-reported imports from China minus China's reported exports to the United States. In this figure, both China's "Gap with U.S." and the United States' "Gap with China" are defined as U.S. reported imports from China minus China reported exports to the United States; China's trade data gap with world ex-US is defined as world ex-U.S. reported imports from China minus China reported exports to world ex-U.S.; U.S. trade data gap with world ex-China is defined as U.S. reported imports from world ex-China minus world ex-China's reported exports to the United States.
Source: IMF Direction of Trade.
How U.S. Tariffs and Chinese VAT Tax Policies Induced Trade Mis-invoicing
A myriad of media stories had documented how U.S. tariffs created incentives for U.S. importers to under-invoice imports from China of the affected goods, or find other ways to avoid the special higher Chinese rates. Less understood, however, is the role played by significant changes in Chinese VAT tax policies.
Unlike most countries, China historically has not fully rebated value-added taxes on exports, meaning that VAT rebate rates are set below VAT rates and that exporters effectively experience export taxes. As long as the rebate rate is below the tax rate, exporters have incentives to under-invoice exports. In addition, firms that sell both domestically and externally have long been known to engage in illicit tax avoidance by over-reporting exports in order to harvest VAT rebates, lowering the effective net VAT rate on their total sales; the value of these schemes increases when rebate rates are increased. The net effect of China's net VAT changes was to increase reported export values form China, both through less under-invoicing and outright over-invoicing.
Academic studies have found quantitatively large effects from net VAT policies in the past. Ferrantino et al. (2012) found that evasion of Chinese net VAT tax accounted for 15 percent underreporting of reported Chinese exports during the period 2002-2008 (evasion of U.S. tariffs accounted for another 5 percent of underreporting of U.S. imports). Li et al. (2019) estimated that Chinese exporters overreported exports by 8.2 percent in the three years following VAT rebate rate increases during the Global Financial Crisis.4
Quantifying the Contribution of U.S. Tariff Versus Chinese Tax Evasion
We quantify the separate contribution of the U.S. tariffs and Chinese net VAT tax in a difference-in-difference framework. We collect annual trade data at the HS6 level for 2012 to 2020 as reported by the Chinese Custom and the U.S. Census, and calculate the trade statistical gap as the following for each of the HS6 products:
$$$ {Trade\ Gap}_{it} = \mathrm{ln}({U.S. imports from China}_{it}) - \mathrm{ln}({ChineseExportstoUS}_{it}) $$$
Where $$i$$ denotes product and $$t$$ denotes the year.
We define three "treatment" groups: (1) The products that were on the section 301 U.S. tariff tranche 1-3 lists, but are not in any of the other treatment groups. U.S.-reported imports from China in this group totals $137 billion in 2020. (2) The products that experienced a drop in Chinese net VAT rates exceeding three percentage points, but were not on the section 301 tranche 1-3 list. China-reported exports to the United States in this group totals $40 billion in 2020. (3) The products that belong to both the section 301 tranche 1-3 tariff list and experienced a drop in Chinese net VAT rates, totaling around $60-70 billion in 2020. The "control" group is defined as products that do not fall into its corresponding or any other treatment groups. We estimate the following difference-in-difference equation for each treatment group $$a$$:
$$$ {Trade\ Gap}_{it} = \beta^a{Treat}_i^a \times {Postshock}_t^a + \delta_t + \delta_i + \alpha + \varepsilon_{it} $$$
$${Treat}_i^a$$ takes the value 1 if the product belongs to the treatment group $$a$$, and $${Postshock}_t^a$$ registers 1 when the policies are effective (in this case, for the year 2019 and 2020). $$\delta_t$$ is year dummies, and $$\delta_i$$ denotes product-specific fixed effects. $$\beta^a$$ is the identified effect of the treatment on the trade statistical gap, shown in Table 1. Goods belonging in tranche 1 to 3 of the section 301 tariffs saw an average annual 17 percent reduction in the U.S.-China trade data gap relative to goods that were not on the section 301 list and did not receive a preferential Chinese net VAT rate decrease. Products that experienced a larger than 3 percentage point decrease in net VAT tax rates (but do not belong in the section 301 tranche 1-3 list) experienced an average annual 13 percent decrease in the trade data gap relative to its control group. Products that fall into both the U.S. section 301 tariff list and Chinese VAT shocks are associated with 10 percent decrease in the trade data gap relative to the control group.
Table 1: Effects of Tariff and Chinese Tax Shock on U.S.-China Trade Data Gap
| Tranche #1-3 | Chinese VAT | Both Shocks | |
|---|---|---|---|
| Treat x Postshock | -0.169*** | -0.131** | -0.100** |
| (-4.50) | (-2.74) | (-1.94) | |
| R2 | 0.008 | 0.006 | 0.005 |
| Fixed Effects | YES | YES | YES |
| Time Dummies | YES | YES | YES |
| N | 18490 | 10594 | 18837 |
Note: t-statistics in parentheses. *p<0.05, **p<0.01, ***p<0.001
In value terms, these estimates translate to the following breakdown for explaining the $88 billion decrease in U.S.-China trade data gap by the end of 2020: (1) $55 billion due to evasion of U.S. tariffs, (2) $12 billion due to overreporting or decrease in underreporting of Chinese exporters to China Customs, and (3) $20 billion due to other reasons (See Figure 5).
Source: Authors' calculations
Adjusting the U.S.-China Bilateral Trade Data
Determining where the adjustment for misreporting should be made—whether it be in the U.S. or China-reported data—requires some level of judgement. Given the administrative process for U.S. tariff collection, we make the plausible assumption that the evasion of U.S. section 301 tariffs most likely show up as underreporting of Chinese imports to the U.S. Customs Border Protection rather than a distortion in the data reported by the Chinese Customs.5 We thus add $55 billion back to the U.S.-reported value of imports from China (see Figure 6). Accordingly, we estimate that $10 billion of U.S. tariff revenue is lost as a result of this underreporting.
On the other hand, the combination of increased export over-reporting and/or lower underreporting due to changes in China's export VAT rebate rates almost certainly is reflected in data reported by Chinese authorities. This is because the forms Chinese exporters submit for the Chinese tax rebates are reported to the Chinese Customs. Thus, we subtract $12 billion from the reported Chinese exports to the United States.
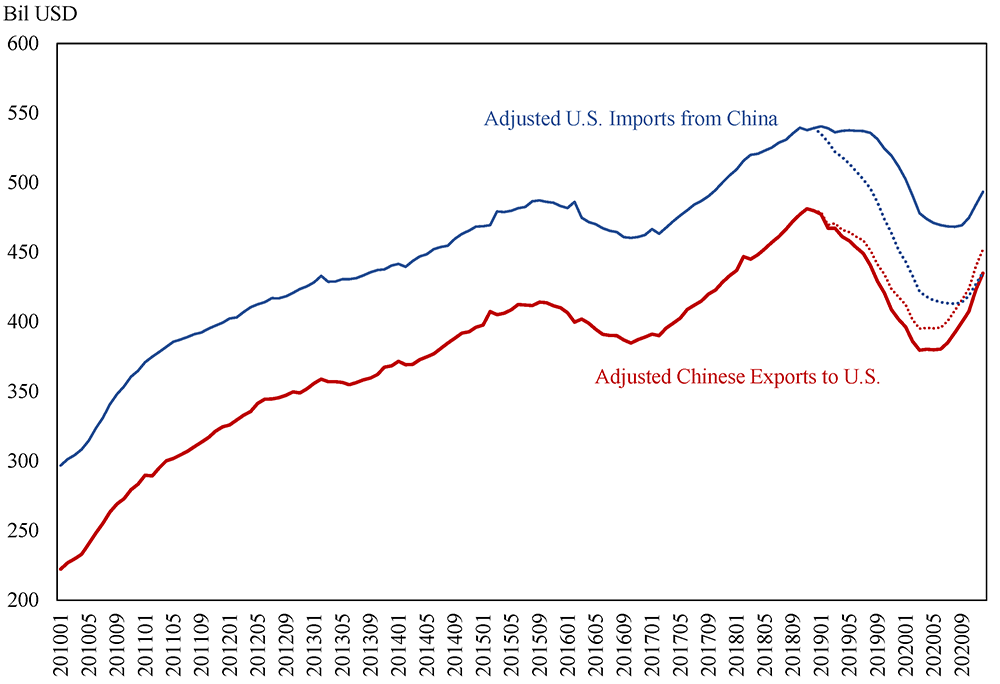
Note: Dotted lines are the reported values by the respective countries. Solid lines reflect adjusted values.
Source: Authors' calculations, China Customs, U.S. Census.
Once we make these adjustments to the U.S.- and China-reported data, the trade data gap between the two series (difference between the solid lines in Figure 6) look as stable as its historical gap. Did the U.S.-China bilateral deficit narrow or remain at historical size? The truth appears to be that it had narrowed somewhat, but not to the extent indicated by the U.S. reported data (see Figure 7). It therefore seems clear that the trade conflict had a much smaller impact on the U.S. bilateral trade balance with China than first meets the eye.
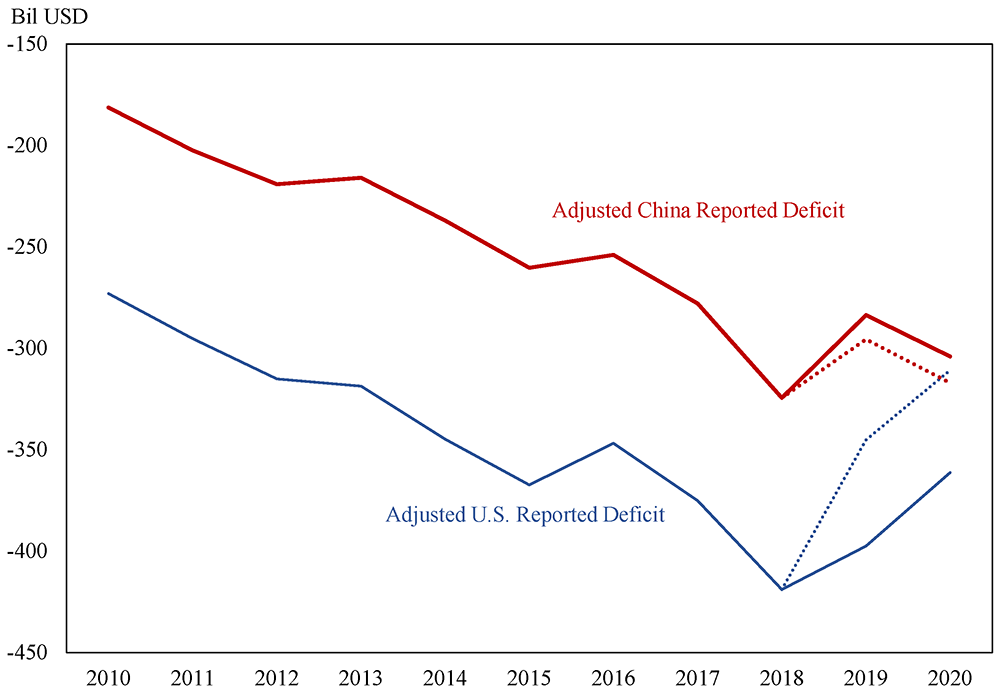
Note: Dotted lines are the reported values by the respective countries. Solid lines reflect adjusted values.
Source: U.S. Census Bureau, China Customs, and authors' calculations.
Bibliography
Beckett, Dustin H., and John W. Schindler (2005), "Adjusting Chinese Bilateral Trade Data: How Big is China's Trade Surplus," Board of Governors of the Federal Reserve System International Finance Discussion Papers, No. 831.
Braakmann, Nils, Bo Gao, Sara Maioli (2020), "VAT Rebates as Trade Policy: Evidence from China," China Economic Review, Vol. 63, 101536.
Ferrantino Michael J., Xuepeng Liu, Zhi Wang (2012), "Evasion Behaviors of Exporters and Importers: Evidence from the U.S.-China Trade Data Discrepancy," Journal of International Economics, Vol. 86, 141-157.
Fisman, Raymond and Shang-Jin Wei (2004), "Tax Rates and Tax Evasion: Evidence from "Missing Imports" in China," Journal of Political Economy, Vol. 112, no.2.
Flaaen, Aaron, Kathryn Langemeier, and Justin Pierce (2021), "Factors Affecting Recent U.S. Tariffs on Imports from China," FEDS Notes.
Li, Hong, BaoQun, and Xie Juanjuan (2019), "Export Tax Rebate and Trade Misinvoicing—Evidence from 'Missing Exports,'" China Economic Quarterly, Vol. 18, No.2.
1. See Ferrantino et al. (2012), Fisman and Wei (2004), and Beckett and Schindler (2005). Return to text
2. Chinese firms could misreport exports via forging of export documents, over-report unit price or quantities of exported goods, misreport product categories, or fabricate special value-added tax invoices. China's State Administration of Taxation has published major export tax fraud cases and has found that their occurrences do increase after increases in the export VAT tax rebate rate. Return to text
3. Flaaen, Langemeier, and Pierce (2021) calculated that the effective tariff rates, once accounting for exemptions and actual tariffs collected, is lower at 12.5 percent. Return to text
4. During the Global Financial Crisis, the Chinese government raised the export VAT tax rebate rates seven times between July 2008 to June 2009 across a spectrum of products in order to lower costs for Chinese exporters and boost their international competitiveness. Li et al. (2019) constructed the trade data discrepancy for Chinese exports at the HS4 level vis-à-vis over 100 of China's trade partners and used a difference-in-difference method to estimate the impact of change in Chinese export tax rebate during the period 2008-2009 in the three years after. In the first year after an increase in the tax rebate rate, they estimate that export values are over-reported by 6.2 percent; in the second year, 8 percent, and in the third year, 11 percent. Return to text
5. U.S. importers, when making bulk purchases from China, typically hire customs brokers to help facilitate the release of the imported goods from the Customs Border Protection (CBP). In order to secure the release of the goods, customs brokers present to the CBP a commercial invoice of the imports—often supplied by Chinese suppliers—which is then used to calculate the amount of tariff duties to be paid, and fill out a host of other forms. The CBP can only inspect a small amount of all imported goods, and once the appropriate forms are filled and deemed unsuspicious, the imports are released to the U.S. importer. Return to text
Clark, Hunter L., and Anna Wong (2021). "Did the U.S. Bilateral Goods Deficit With China Increase or Decrease During the U.S.-China Trade Conflict?," FEDS Notes. Washington: Board of Governors of the Federal Reserve System, June 21, 2021, https://doi.org/10.17016/2380-7172.2927.
Disclaimer: FEDS Notes are articles in which Board staff offer their own views and present analysis on a range of topics in economics and finance. These articles are shorter and less technically oriented than FEDS Working Papers and IFDP papers.