FEDS Notes
April 20, 2017
The Effect of the Federal Reserve’s Securities Holdings on Longer-term Interest Rates
Brian Bonis, Jane Ihrig, Min Wei1
In an effort to promote more accommodative financial conditions following the financial crisis of 2008 and the ensuing recession, and at a time when the conventional monetary policy tool--the federal funds rate--was at its effective lower bound, the Federal Reserve conducted large-scale asset purchases (LSAPs) and a maturity extension program (MEP). By increasing the amount of longer-term Treasury securities and agency MBS on the Federal Reserve's balance sheet, and thereby reducing the amount of longer-term Treasury securities and agency MBS that the public would have held otherwise, these purchase programs put downward pressure on longer-term interest rates.2 This note outlines a way to estimate by how much Federal Reserve securities holdings resulting from these purchase programs reduce longer-term interest rates. In particular, we estimate the term premium effect (TPE) on the 10-year Treasury yield. Currently, our model suggests that the cumulative effect of the Federal Reserve's LSAPs and MEP results in a reduction in the 10-year Treasury yield term premium of about 100 basis points. By the end of 2017, the term premium will be held down by about 85 basis points. The slight narrowing of the TPE reflects the average maturity of the Federal Reserve's portfolio declining and the cessation of reinvestments drawing nearer.
1. Background
Following the Great Recession, with the federal funds target range at 0 to 25 basis points, the Federal Reserve used its balance sheet as a tool to achieve its mandated objectives of maximum employment and price stability. The FOMC purchased longer-term securities, specifically, Treasury and agency securities, as permitted under the Federal Reserve Act. From 2008 through 2014, the Fed conducted three LSAPs and an MEP, which resulted in purchases of roughly $4.5 trillion in securities that extended the duration of securities held on the Federal Reserve's balance sheet from 5.2 years to 5.9 years and increased ten-year equivalents (TYE) from about $330 billion to $2.8 trillion.3, 4 Since the end of 2014, the Federal Reserve has been rolling over maturing Treasury securities and reinvesting principal payments from its holdings of agency debt and agency mortgage-backed securities, keeping the size of its balance sheet roughly unchanged but with the TYE increasing slightly from $2.5 trillion to $2.7 trillion.5
Central bank asset purchases can influence financial conditions and the broader economy through a variety of channels. They can improve the functioning of financial markets, especially during times of stress, which can result in easing credit conditions in some sectors. They can lower investors' expectations for the future path of the federal funds rate by signaling that the central bank intends to pursue a persistently more accommodative policy stance than previously thought, which can result in downward pressure on longer-term real interest rates. Additionally, they can result in increasing household and business confidence by reducing concerns regarding deflation.
In this note, we focus on another channel through which LSAPs may affect the economy: the portfolio balance channel. Here, different classes of financial assets are not perfect substitutes in investors' portfolios (due to transaction costs, information costs, regulatory restrictions, etc.), and therefore, when the supplies of various assets available to investors change, the prices and yields of those assets are affected. For example, when the Federal Reserve purchases mortgage-backed securities (MBS), the prices of those securities can be expected to rise and their yields can be expected to fall. To the extent investors rebalance their portfolios and replace the MBS sold to the Federal Reserve with other assets, the prices and yields of the other assets can also be expected to rise and fall, respectively. In the next section, we will walk through a model that estimates the impact that asset purchases and reinvestment policy have on longer-term Treasury security yields.
2. Model
Our modeling efforts consist of two parts: a term structure model with supply factors and the construction of the path of private sector holdings of securities. More details can be found in Ihrig, Klee, Li, Schulte, and Wei (2012).6
Our term structure model follows Li and Wei (2013), who propose and estimate an arbitrage-free term structure model in which yields are affected by the private holdings of Treasury and agency MBS securities.7 In particular, they assume that yields are driven by five state variables including two yield curve factors, one Treasury supply factor (total private holdings of Treasury securities in terms of ten-year-equivalents and as a ratio of nominal GDP), and two agency MBS supply factors (the par amount of total private holdings of MBS as a ratio of nominal GDP and average MBS duration). The inclusion of these three supply factors are motivated by the preferred-habitat term structure model of Vayanos and Vila (2009).8 That model has two types of private participants in the Treasury market: preferred-habitat investors, who hold only a particular maturity segment of the Treasury yield curve and are risk-neutral, and risk-averse arbitrageurs, who trade to take advantage of arbitrage opportunities and have no maturity preference. Vayanos and Vila (2009) show that in such a model, bond holdings of the arbitragers can affect the equilibrium bond risk premiums. The supply factors included in Li and Wei (2013) can be justified by the additional assumption that the preferred-habitat investors consist of the U.S. Treasury and the Federal Reserve, while the arbitrageurs correspond to the entire private sector.
The term premium effect relies on the projected path of shocks to private-sector holdings of securities. We construct this path by projecting the evolution of total Treasury issuance as well as Federal Reserve holdings of Treasury and MBS securities. In doing so, we implicitly assume that total securities outstanding are exogenous to the Federal Reserve's asset programs, which is consistent with the Treasury not altering their funding patterns after the initiation of the various Federal Reserve's asset purchase programs. To construct our market expectations-consistent projections of Federal Reserve holdings, and hence private holdings, we lean on the methodology outlined in Carpenter, Ihrig, Klee, Quinn and Boote (2015).9 Their study considers how the Federal Reserve's balance sheet evolves with respect to both the Federal Reserve's projected unwinding of unconventional monetary policy accommodation, as well as the "natural" evolution of the balance sheet that accounts for growth in currency and Federal Reserve bank capital.10 These characteristics are embedded in the term premium estimates presented below.
3. Effect of SOMA holdings on 10-year Treasury yield
To estimate the 10-year Treasury TPE from Federal Reserve balance sheet projections we need estimates of FOMC policies and macroeconomic variables. We use the December 2016 FOMC participants' Summary of Economic Projections (SEP) for the path of the federal funds rate, unemployment, GDP growth, and inflation. Other macroeconomic variables are generated from the FRB/US model.11 The Fed's balance sheet policy is consistent with the FOMC's September 2014 Policy Normalization Principles and Plans: no sales of securities and when reinvestments end, the securities holdings decline in a gradual and predictable manner.12 The timing of the change in reinvestment policy is assumed to be in the second quarter of 2018, consistent with the median December 2016 primary dealer and buyside surveys.13 Finally, the balance sheet is expected to normalize when reserve balances decline to a level of $100 billion.14 Using these inputs as discussed in Ihrig et al. (2012), figure 1 shows projected 10-year Treasury TPE and its 90 percent confidence interval.

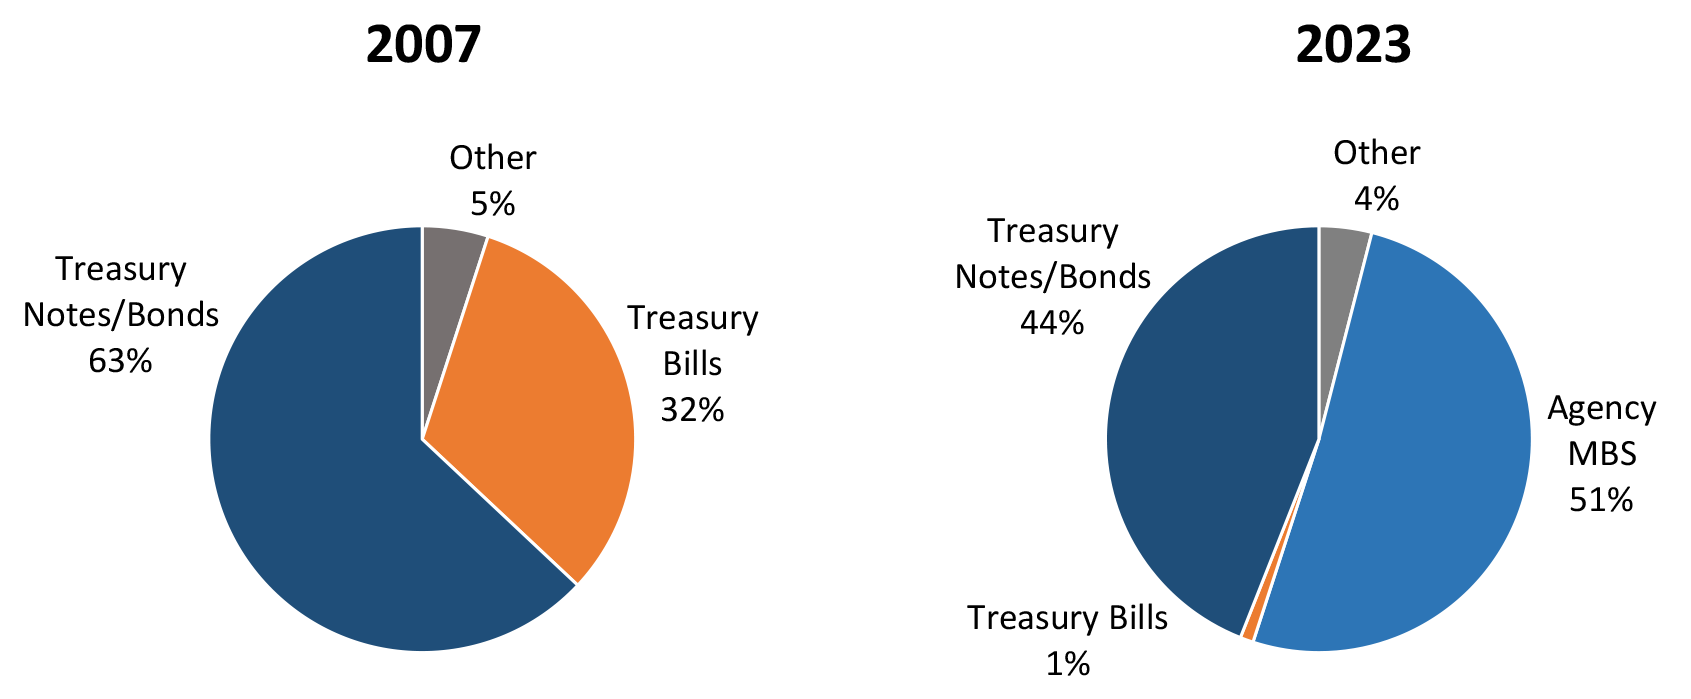
As shown, the 10-year Treasury TPE at the end of 2016 is estimated to be negative 100 basis points. Roughly speaking, this implies the yield on a 10-year Treasury security would be 100 basis points higher absent the Federal Reserve's LSAPs and MEP programs. By the end of 2017, it stands at about negative 85 basis points. This 15 basis point narrowing reflects two changes in the balance sheet: (1) the SOMA portfolio is aging and (2) we are getting closer to a change in the reinvestment policy. When the size of the balance sheet normalizes in the first quarter of 2023, the TPE is still nonzero, standing at negative 24 basis points, reflecting the fact that the portfolio composition is still not what would be deemed a normal composition. At that time, the portfolio is projected to hold $1.2 trillion in MBS and half of the $1.1 trillion in Treasury holdings will have maturities greater than 10 years (see figure 2). In comparison, before the crisis, the portfolio held no MBS and only $90 billion of the $800 billion in Treasury holdings had maturities greater than 10 years.
4. Comparison with the literature
Over time there have been numerous academic studies that quantify how the Fed's purchase programs have affected longer-term interest rates. The analysis varies from event studies to regression-based analysis and term structure model estimates. Overall, as shown in table 1, the model used in this Note generates results in line with many of these other studies.
Table 1*
| LSAP Policies | Estimated Decline in 10-Year Treasury Yield (basis points) at onset of the program | Other Studies |
|---|---|---|
| LSAP 1 | 34 | 91 - (Event Studies); 36 to 82 (Regressions) - Gagnon et al. (2011) 100 - Krishnamurthy and Vissing-Jørgensen (2011) 20 to 30 - (Treasury security purchases only) - D'Amico and King (2013) 35 - (Treasury security purchases only) - D'Amico et al. (2012) |
| LSAP 2 | 12 | 25 - Krishnamurthy and Vissing-Jørgensen (2011) 55 – D'Amico et al. (2012) 21 – Meaning and Zhu (2011) 15 – Swanson (2011) |
| MEP | 28 | 22 - Hamilton and Wu (2012) 17 – Meaning and Zhu (2012) |
| LSAP 3 | 31 | 60 - Engen, Laubach, and Reifschneider (2015)1 |
* References in table 1 (in order of appearance):
Gagnon, Joseph, Raskin, Matthew, Remache, Julie, Sack, Brian. 2011. "The Financial Market Effects of the Federal Reserve’s Large-Scale Asset Purchases," International Journal of Central Banking, vol. 7, no. 1, p. 3-43.
Krishnamurthy, Arvind, and Vissing-Jorgensen, Annette. 2011. "The Effects of Quantitative Easing on Long-term Interest Rates," Brookings Papers on Economic Activity, Fall.
D’Amico, Stefania, and King, Thomas. 2013. "Flow and Stock Effects of Large-Scale Treasury Purchases: Evidence on the Importance of Local Supply," Journal of Financial Economics, vol. 108, no. 2, p. 425-448.
D’Amico, Stefania, English, William, Lopez-Salido, David, and Nelson, Edward. 2012. "The Federal Reserve’s Large Scale Asset Purchase Programs: Rationale and Effects," Economic Journal, vol. 122, no. 564, p. 415-46.
Meaning, Jack and Zhu, Feng. 2011. "The Impact of Recent Central Bank Asset Purchase Programmes," BIS Quarterly Review, Bank for International Settlements, December.
Swanson, Eric T. 2011. "Let’s Twist Again: A High-Frequency Event-Study Analysis of Operation Twist and its Implications," Brookings Papers on Economic Activity, p. 151-188, Spring.
Hamilton, J. D. and Wu, J. C. 2012. "The Effectiveness of Alternative Monetary Policy Tools in a Zero Lower Bound Environment," Journal of Money, Credit and Banking, 44: 3–46.
Meaning, Jack, and Zhu, Feng. 2012. "The Impact of Federal Reserve Asset Purchase Programs: Another Twist," BIS Quarterly Review, Bank for International Settlements, March.
Engen, Eric, Laubach, Thomas, and Reifschneider, David. 2015. "The Macroeconomic Effects of the Federal Reserve’s Unconventional Monetary Policies," FEDS 2015-005, January. Return to table
1. Constructed with Ihrig et al. (2012) model and updated LSAP3 assumptions: https://www.federalreserve.gov/pubs/feds/2012/201257/201257abs.html Return to table
5. Going forward
Figure 3 shows projected 10-year TPE, SOMA holdings and reserve balances. Periodically, this figure and its supporting data will be updated to reflect changes to the public FRB/US model, primary dealer survey results, or FOMC announcements.

1. We thank Grant Carney, Jamie Grasing and Luke Pardue for excellent assistance. Return to text
2. Borrowing costs for residential mortgages, auto loans, business borrowing, and other types of longer-term lending declined, all else equal. Return to text
3. From January 2009 to December 2014. Return to text
4. The TYE of a fixed-income portfolio are calculated as the par amount of on-the-run ten-year Treasury notes that would have the same par value times duration as the portfolio under consideration. In mathematical terms, TYE = par value of portfolio * average portfolio duration / duration of the ten-year on-the-run Treasury note. For more information regarding the duration and TYE of the Federal Reserve's portfolio, please see the 'Selected Balance Sheet Developments' section of Domestic Open Market Operations During 2016 (PDF), (April 2017), prepared by the Markets Group of the Federal Reserve Bank of New York. Return to text
5. From January 2015 to December 2016. Return to text
6. Ihrig, Jane, Elizabeth Klee, Canlin Li, Brett Schulte, and Min Wei (2012). "Expectations about the Federal Reserve's Balance Sheet and the Term Structure of Interest Rates (PDF)," Finance and Economics Discussion Series 2012-57. Board of Governors of the Federal Reserve System (U.S.). Return to text
7. Canlin Li and Min Wei (2013). "Term Structure Modeling with Supply Factors and the Federal Reserve's Large Scale Asset Purchase Programs," International Journal of Central Banking, vol. 9, no. 1, pp. 3-39." Return to text
8. Dimitri Vayanos and Jean-Luc Vila (2009), "A Preferred-Habitat Model of the Term Structure of Interest Rates," NBER Working Paper No. 1548 Return to text
9. Seth Carpenter, Jane Ihrig, Elizabeth Klee, Daniel Quinn, and Alexander Boote (2015). "The Federal Reserve's Balance Sheet and Earnings: A Primer and Projections," International Journal of Central Banking, vol. 11, no. 2, pp. 237-283. Return to text
10. All balance sheet items are projected, including key autonomous factors such as the Treasury General Account and Reverse Repurchase Agreements. Return to text
11. The FRB/US model is a large-scale estimated general equilibrium model of the U.S. economy that has been in use at the Federal Reserve Board since 1996. Further information is available at http://www.federalreserve.gov/econresdata/frbus/us-models-about.htm. Return to text
12. The FOMC's September 2014 Policy Normalization Principles and Plans are available at http://www.federalreserve.gov/newsevents/press/monetary/20140917c.htm. As outlined in the December 2016 FOMC statement, the Committee's existing policy is to reinvest principal payments from its holdings of agency debt and agency mortgage-backed securities in agency mortgage-backed securities and to roll over maturing Treasury securities at auction until normalization of the level of the federal funds rate is well under way. See https://www.federalreserve.gov/newsevents/pressreleases/monetary20161214a.htm. Return to text
13. Our assumption of the timing of a change in the Committee's policy on reinvesting payments of principal on Treasuries and agency MBS is based on median survey responses reported in the Federal Reserve Bank of New York's December 2016 Survey of Primary Dealers. We model the reinvestment policy change as a 12-month phase out of Treasury and MBS rollovers, consistent with the December 2016 median survey response. More information is available at https://www.newyorkfed.org/markets/primarydealer_survey_questions.html. Return to text
14. The long-run level of reserve balances is uncertain and other values can be used. For example, see the Domestic Open Market Operations During 2016 (PDF), chart 29, for the projection of securities holdings using a range of low to high levels of reserve balances. The size of the balance sheet is assumed to be normalized when the securities portfolio reverts to the level consistent with its longer-run trend; this trend is determined largely by currency in circulation and a projected long-run level of reserve balances. Return to text
Bonis, Brian, Jane Ihrig, and Min Wei (2017). "The Effect of the Federal Reserve's Securities Holdings on Longer-term Interest Rates," FEDS Notes. Washington: Board of Governors of the Federal Reserve System, April 20, 2017, https://doi.org/10.17016/2380-7172.1977.
Disclaimer: FEDS Notes are articles in which Board staff offer their own views and present analysis on a range of topics in economics and finance. These articles are shorter and less technically oriented than FEDS Working Papers and IFDP papers.