FEDS Notes
February 17, 2021
Factors Affecting Recent U.S. Tariffs on Imports from China1
Aaron Flaaen, Kathryn Langemeier, and Justin Pierce
The period from January 2018 to September 2019 saw an unprecedented increase in tariffs placed on U.S. imports, especially on those originating in China. A “Phase One” trade deal between the United States and China in early 2020 lowered tariffs on some products and received extensive attention. However, other factors—especially a United States Trade Representative (USTR) program that administers exemptions, or “exclusions,” to tariffs on imports from China—have actually reduced effective tariffs by more than the Phase One agreement. In this note, we document the extent to which tariff exclusions and other factors lowered the average effective tariff on Chinese goods. Given that the large majority of tariff exclusions expired on December 31, 2020, our analysis also indicates that U.S. effective tariffs on Chinese goods increased notably at the start of 2021.
Background and Calculation of Effective Tariff Rates
The U.S. imposed tariffs on imports from China in four “Waves” over the course of 2018 to 2019. These tariffs were imposed following an investigation based on Section 301 of the Trade Act of 1974, which concluded that Chinese policies on intellectual property and technology transfer violated U.S. law or trade agreements.2 Tariffs began to be imposed in July 2018 and were substantially broadened in subsequent Waves, following retaliatory tariffs imposed by China on U.S. exports.3
We begin our analysis by calculating the effective ad-valorem tariff rate paid on U.S. imports from China over this period using publicly-available data from the U.S. International Trade Commission (USITC). Specifically, for each ten-digit U.S. Harmonized Tariff Schedule (HTS) product code, we calculate the effective tariff rate as the value of calculated duties divided by the customs value of imports for consumption. We then aggregate these product-level tariff rates using the 2017 value of U.S. imports from China of each product as weights. Changes in tariff rates calculated using this weighting scheme, therefore, have the helpful interpretation of being applicable to the pre-tariff bundle of goods imported from China, i.e. prior to any tariff-related reallocation of trade across countries or products:
$$$$ {Tariff}_t = \sum_{h} \frac{{Value}_{h, 2017}}{{Value}_{2017}} \frac{{Duty}_{ht}}{{Value}_{ht}} . $$$$
Here, $$h$$ denotes ten-digit HTS products, $$t$$ denotes months, and all tariffs, duties, and values are with respect to U.S. imports from China.4
Figure 1 shows the effective tariff rate described above (solid line), as well as the statutory tariff rate that would have prevailed if new tariffs were collected in full, as announced (dashed line).5 Several features of Figure 1 are notable. First, the average effective tariff rate on imports of goods from China increased substantially due to the tariffs, jumping from 2.7 percent in January 2018 to 15.4 percent in September of 2019. Second, the tariff increases—while massive—were ultimately less than the amount called for by statutory rates, which would have risen to 17.5 percent by September 2019. Third, the Phase One trade agreement between the U.S. and China lowered statutory rates by 1.5 percentage points, as shown in the step down in the dashed line in February 2020. And finally, the gap between the effective rate and the statutory rate has increased over time, reflecting the role of tariff exclusions in lowering effective tariff rates. We explore this gap in greater detail below.
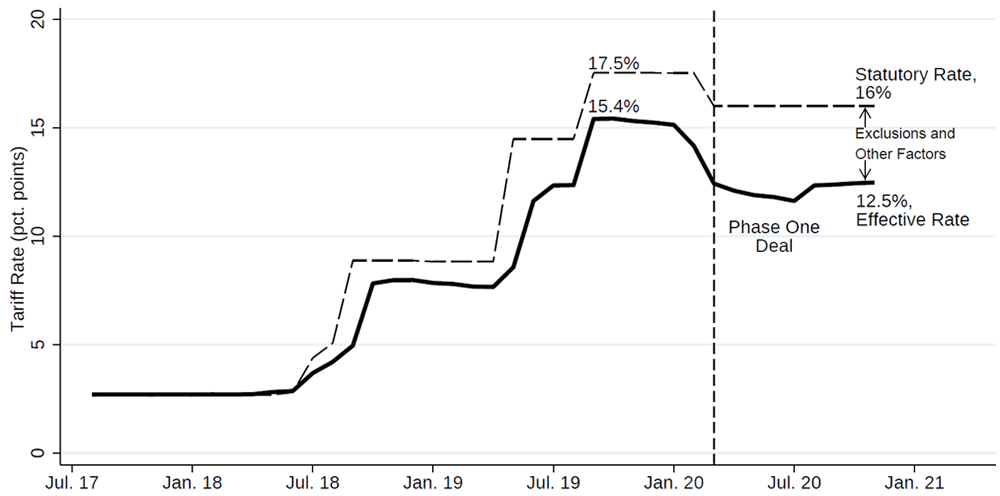
Note: Figure displays effective and statutory tariff rates on U.S. imports from China, weighted using values of 2017 U.S. imports from China.
Source: USITC.
The Role of Exclusions in Mitigating Tariff Increases
Included in the notice initiating the first Wave of Section 301 tariffs was an announcement of a process whereby “U.S. stakeholders may request that particular products classified within an HTSUS subheading be excluded from these additional duties” (Federal Register 2018a). Many firms applied for these tariff exclusions, with over 52 thousand petitions filed with the USTR during the period of July 2018 to January 2020.
Exclusion requests were evaluated based on three criteria, as published in an official notice in July 2018 (see Federal Register (2018b)): 1) Whether the particular product is available only in China, 2) Whether the imposition of additional duties would cause severe economic harm to the requestor or other U.S. interests, and 3) Whether the particular product is strategically important to the “Made in China 2025” industrial program. Once a petition was posted, other interested parties could submit responses to the request either in support or opposition. As described in detail in Hufbauer and Lu (2018), the initial flood of requests led to processing delays by the USTR, with decisions on the petitions for the first Wave of tariffs (initiated in July, 2018) being announced on a rolling basis from December, 2018 through October, 2019.
To help illustrate the role of exclusions in generating the gap between statutory and effective tariff rates on imports from China, Figure 2 splits the aggregate rates shown in Figure 1 into the respective four Waves of Section 301 tariff actions. The role of exclusions manifests itself in two ways. First, and perhaps most intuitively, exclusions cause a steady decline in effective tariff rates in the months following the initial jump, which is apparent for Waves 1 through 3 in Figure 2. Second, exclusions partially explain why effective tariff rates do not reach their statutory level, even in the initial months that tariffs are put into effect. Specifically, exclusions apply retroactively to the start of the tariff, so some firms may have received an administrative refund on unliquidated duties previously levied. In these cases, neither the initial duty nor the refunds appear in published data because firms receive these refunds by “correcting” their estimated duty.6
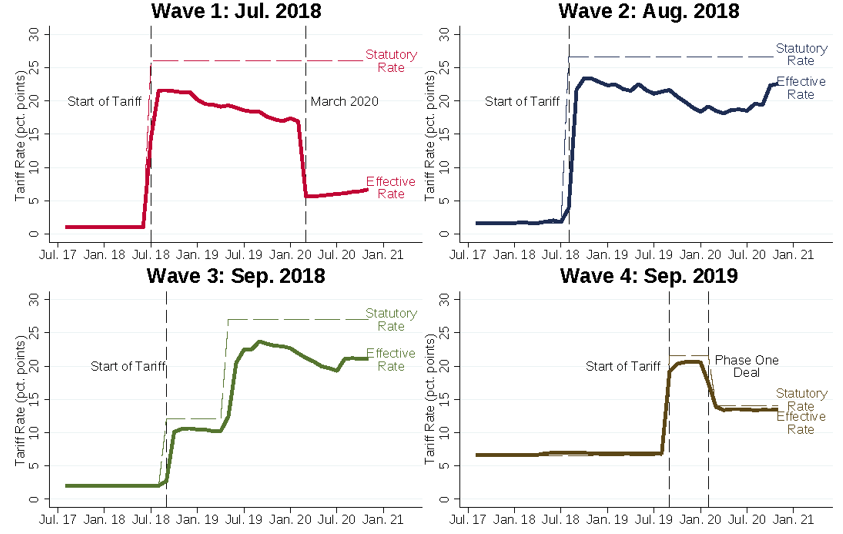
Note: Figure displays effective and statutory tariff rates on U.S. imports from China, by Wave, weighted using values of 2017 U.S. Imports from China.
Source: USITC.
To calculate a back-of-the-envelope estimate of the contribution of exclusions to changes in the effective tariff rate, we proceed in several steps. First, we calculate effective and statutory tariff rates, as well as the applicable share of imports, for HTS-level products that have approved petitions for exclusions.7 Second, we calculate the percentage point gap between the average effective tariff rates and statutory rates for these products. Third, we subtract out the difference between effective and statutory rates for Wave-specific products with “denied” petitions, in order to net out any baseline difference in the two rates that is unrelated to exclusions.8 Fourth, we multiply this net gap by the import share of products with approved petitions and aggregate this percentage point contribution using 2017 import weights across each of the Waves of Section 301 tariff actions. All told, we calculate that tariff exclusions lowered effective tariffs on imports from China in November 2020—the most recent month of data available—by 1.8 percentage points, relative to their statutory level. The maximum impact of tariff exclusions was likely larger than this, as a number of tariff exclusions had already expired by that time.
Other Factors Reducing Effective Tariff Rates
Another notable feature of Figure 2, pertaining specifically to Wave 1, is the steep drop in effective tariff rates that occurs in March 2020. We can largely rule out three potential causes of this drop, and conclude that it likely reflects a temporary change in the recording of calculated duties in official trade data that will revise in the future. First, while the drop in effective rates occurs at the same time as the tariff reductions associated with the Phase One trade deal, those rate reductions were intended to apply only to products covered by Wave 4 tariffs. Second, while the drop also occurs at the time of the onset of the COVID-19 pandemic in the United States, the few ad-hoc exclusions on PPE and other medical equipment imports at this time do not account for a meaningful share of the fall in effective tariff rates.
Third, the drop does not appear to be due to the tariff exclusion process. Figure 3 provides a further breakdown of the products covered by Wave 1 tariffs, according to whether they applied for tariff exclusions, and the result of their applications. As shown in the figure, the drop in effective tariff rates is present for products with no applications for exclusions (upper left), for products with applications that were denied (upper right), and for products in which some exclusion requests were granted while others were denied (lower left). While the decline in effective rates for products that were denied exclusions in full or in part might be consistent with retroactive approval of previously denied exclusion requests, the largest decline in effective rates actually happens among products with no applications for exclusions. Ultimately, the March decline in effective rates for Wave 1 products lowers the effective tariff rate on imports from China by 0.7 percentage point. As mentioned above, we view this decline largely as a non-economic feature of how duties were recorded in official statistics.
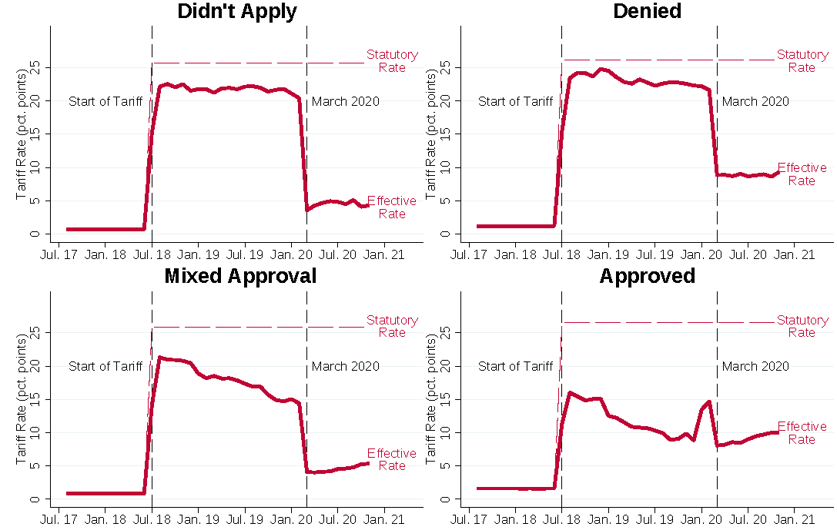
Note: Figure displays effective and statutory tariff rates on U.S. imports from China, by Wave, weighted using values of 2017 U.S. Imports from China.
Source: USITC.
The tariff exclusion process and March drop do not account for the full gap between the statutory and average effective tariff rates, and several other smaller factors could be at work. First, under some conditions, importers in a foreign trade zone can defer payment on tariffs associated with qualifying imported inputs. The U.S. Census Bureau also identifies some situations where estimates of the calculated duty could lead to an under-estimate of the effective tariff rate, such as when imports are made under special rate provisions.9 These other factors likely account for a portion of the remaining 1 percentage point difference between statutory and effective tariff rates.
Summary of Contributions of Each Factor to Changes in Effective Tariff Rates
As indicated in Figure 1, the difference between the peak statutory tariff rate (17.5 percent) and the most recent reading of the effective tariff rate (12.5 percent) on U.S. imports from China is 5 percentage points. Table 1 summarizes the contributions to that gap of each of the factors we examine in this note. As shown in the first row, the well-publicized Phase One trade deal between the U.S. and China accounts for 1.5 percentage points of the gap. This contribution, however, is less than half the size of that from other, less-publicized factors. Most importantly, we calculate that the tariff exclusion process alone accounts for a 1.8 percentage point decline in effective tariffs—larger than the Phase One trade deal. The March 2020 drop in Wave 1 tariffs contributes a 0.7 percentage point decline, and a variety of other factors account for the remaining 1.0 percentage point.
Table 1. Summary of Factors Affecting Effective Tariff Rates on U.S. Imports from China
| Gap Between Maximum Statutory Rate and Most Recent Effective Rate | 5.0 p.p. |
|---|
Percentage Point Contribution to Gap
| Phase One Deal | 1.5 p.p. |
|---|---|
| Exclusions | 1.8 p.p. |
| March 2020 Drop | 0.7 p.p. |
| Other Factors | 1.0 p.p. |
Extensions of Exclusions and Expiration in 2020
Tariff exclusions were initially granted from the start of the respective tariffs to one year after the publication of the exclusion in the Federal Register Notice.10 For some products, especially in Waves 2 and 3, these exclusions expired around the third quarter of 2020, as is evident in the uptick in the average effective tariff rates in Figures 1 and 2 above. For most other approved exclusions, concerns that alternative supplies of affected products remained unavailable led to their extension through December 2020.
Other than a small set of medical care products related to the Covid-19 pandemic, no further extensions were granted beyond December 31, 2020, and thus a large majority of tariff exclusions expired abruptly on January 1, 2021. As a result, many U.S. firms faced substantial increases in tariffs on imports in the New Year. As discussed above, we calculate that tariff exclusions had lowered effective tariff rates by 1.8 percentage points through November 2020, implying that their expiration increased tariffs by an equivalent amount. Importantly, this increase in effective tariffs is large enough to more than completely offset the decline in statutory rates due to the Phase One trade deal.
Conclusion
This note examines the role of tariff exclusions and other factors in driving changes in effective U.S. tariff rates on imports from China. We find that, by November 2020, effective tariff rates on imports from China were 5.0 percentage points below the maximum level called for by the statutory Section 301 rates. While the high-profile Phase One trade deal between the U.S. and China accounts for 1.5 percentage points of that gap, several little-discussed factors account for the remaining 3.5 percentage points. Most substantively, we find that the USTR program granting tariff exclusions was the largest contributor to lowering effective tariff rates, accounting for a 1.8 percentage point decline. Moreover, because the large majority of tariff exclusions expired at the end of 2020, our results indicate that U.S. firms faced a sizable increase in effective tariffs at the start of 2021.
References
Bown, Chad P. and Melina Kolb. 2020. “Trump’s Trade War Timeline: An Up-to-Date Guide.” Peterson Institute for International Economics.
Federal Register. 2018a. “Notice of Action and Request for Public Comment Concerning Proposed Determination of Action Pursuant to Section 301: China’s Acts, Policies, and Practices Related to Technology Transfer, Intellectual Property, and Innovation” 83:119 (June 20, 2018). Docket No. USTR-2018-0018.
Federal Register. 2018b. “Procedures To Consider Requests for Exclusion of Particular Products From the Determination of Action Pursuant to Section 301: China’s Acts, Policies, and Practices Related to Technology Transfer, Intellectual Property, and Innovation.” 83:133 (July 11, 2018). Docket No. USTR-2018-0025.
Flaaen, Aaron and Justin Pierce. 2019. “Disentangling the Effects of the 2018-2019 Tariffs on a Globally Connected U.S. Manufacturing Sector.” Finance and Economics Discussion Series 2019-0886. Washington: Board of Governors of the Federal Reserve System, https://doi.org/10.17016/FEDS.2019.086.
Pierce, Justin and Peter Schott. 2012. “Concording U.S. Harmonized System Codes Over Time.” Journal of Official Statistics 28(1), pp. 53-68.
Hufbauer, Gary Clyde and Lucy Lu. 2019. “The USTR Tariff Exclusion Process: Five Things to Know about these Opaque Handouts.” https://www.piie.com/blogs/trade-and-investment-policy-watch/ustr-tariff-exclusion-process-five-things-know-about-these
1. We thank Chad Bown, Gary Clyde Hufbauer, and Zhiyao Lu of the Peterson Institute of International Economics, as well as Ricky Ubee, Ryan Kane, Janis Summers, Laura Thayn, and Eric Heath at the United States International Trade Commission for helpful conversations on Section 301 tariffs and tariff exclusions. Return to text
2. Imports from China were also covered by U.S. tariffs on imports of solar panels, washing machines, steel, and aluminum, which were applied to all or nearly all U.S. trade partners. Return to text
3. For extensive detail on the escalation in tariffs beginning in 2018, see Bown and Kolb (2020). We use data on products covered by tariffs from Flaaen and Pierce (2019). Return to text
4. We use time-consistent product codes that incorporate changes to the HTS over time using the concordances provided in Pierce and Schott (2012). Return to text
5. We calculate the baseline tariff rate that existed before Section 301 tariffs as the average effective tariff rate in 2017. Return to text
6. Firms submit Post Summary Correction (PSC) forms once they receive the exclusion. These forms act as a new entry summary form, completely replacing the initial entry summary. Return to text
7. These products are identified by merging in petition-level data on exclusion requests, which can be defined at the sub-ten-digit HTS level. The firm-product level data on petitions and their outcomes are posted on the USTR website: https://comments.ustr.gov/s/. Return to text
8. For the “Wave 1” tariffs, we also remove the effect of the March drop in effective tariff rates described in detail below. Return to text
9. See information provided by the U.S. Census Bureau at https://www.census.gov/foreign-trade/guide/sec2.html#quality. Return to text
10. Wave 3 and Wave 4 exclusions were initially set to expire in August 2020 and September 2020 respectively, regardless of when the product exclusion was published in the Federal Register Notice. Return to text
Flaaen, Aaron, Kathryn Langemeier, and Justin Pierce (2021). "Factors Affecting Recent U.S. Tariffs on Imports from China," FEDS Notes. Washington: Board of Governors of the Federal Reserve System, February 17, 2021, https://doi.org/10.17016/2380-7172.2863.
Disclaimer: FEDS Notes are articles in which Board staff offer their own views and present analysis on a range of topics in economics and finance. These articles are shorter and less technically oriented than FEDS Working Papers and IFDP papers.