FEDS Notes
June 21, 2022
Financial and Macroeconomic Indicators of Recession Risk
Introduction
Recessions impose sizable hardship, with large increases in the unemployment rate and related dislocations. In addition, recessions can lead to large shifts in financial markets. As a result, economists and financial market professionals have considered prediction models to assess the probability of a recession.
A range of approaches have been considered. One strand of analysis uses financial market variables—often the slope of the yield curve—to assess recession risk. A second strand augments the first approach by adding leading indicators (which summarize confidence and economic activity indicators) to recession prediction models. A third approach considers the state of the macroeconomy—inflation and the business cycle, as measured by the unemployment rate—because historical analyses have emphasized how recessions were preceded by high inflation, an overheated economy, and a shift in monetary accommodation (e.g., Romer and Romer, 1989).
This note highlights the implications of these approaches to assessing recession risk.
Approach
The risk of a recession is akin to the risk of a sizable increase in the unemployment rate. In light of this correspondence, our empirical approach focuses on the risk of a sizable increase in the unemployment rate. Specifically, the empirical analysis considers models of the probability that the change in the unemployment rate over a given horizon h, conditional on period t information, exceeds the 80th percentile of the unconditional distribution of changes in the unemployment rate $$P_{0.80}^{\Delta U}(t+h)$$. Denoting the unconditional cumulative distribution function of change in the unemployment rate over horizon h as $$F(\Delta U(t+h))$$, $$P_{0.80}^{\Delta U}(t+h)$$ is
(1) $$P_{0.80}^{\Delta U}(t+h) = Prob\{\Delta U(t+h) \ge F^{-1}(0.80)\}$$.
At a horizon of four quarters, the 80th percentile of the change in the unemployment rate for data from 1965 to 2019 equals 3/4 percentage point. Changes in the unemployment rate at these horizons of this magnitude are always associated with recessions (figure 1). This mapping is intuitive—the defined large increase in the unemployment rate has a 20 percent probability unconditionally, and the frequency of recessions is in this neighborhood (i.e., seven recessions in the 55 years between 1965 and 2019).
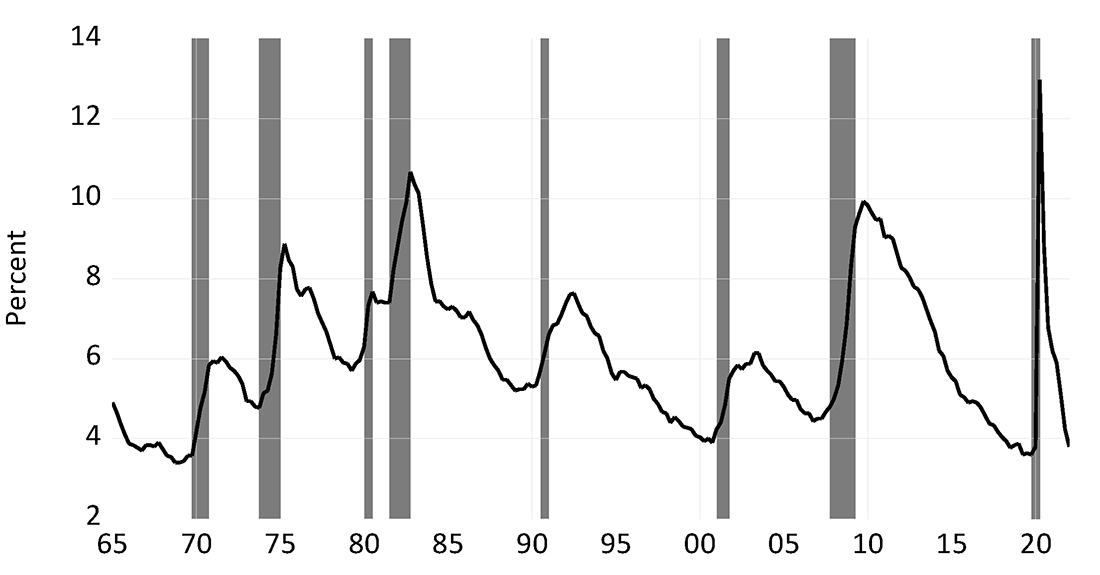
Note: Shaded regions indicate recessions.
Source: Bureau of Labor Statistics and National Bureau of Economic Research.
The empirical approach to gauging time variation in this measure of unemployment risk is drawn from the literature on predicting recessions. In particular, I estimate a logistic regression of the following form
(2) $$ Prob\{\Delta U(t+h) \ge F^{-1}(0.80)\} = G(BX(t))$$
where $$X(t)$$ is a set of predictors, B are the coefficients on these predictors, and $$G(X)$$ is the logistic function $$(G(BX) = {1}/{(1+e^{-BX})})$$.
The period analyzed is 1965Q1 to 2019Q4. The start date reflects the beginning of the period for which the relevant prediction data is available. The end date was chosen to exclude from the prediction models the COVID-induced recession, although the results are very similar when the estimation sample includes the COVID recession.
Recession Risk Using the Yield Curve and Credit Spreads
A common approach to assessment of recession risk uses financial variables, such as the credit spread (here, the difference between the Baa corporate bond yield and the 10-yr Treasury yield) and the term spread (here, the difference between the 10-yr Treasury yield and the federal funds rate). These variables are used to predict economic activity or the probability of a recession in, for example, Lopez-Salido, Stein, and Zakrajsek (2017) and Engstrom and Sharpe (2019, 2022). Similar sets of variables are considered in Faust et al (2013) and Favara et al (2016). Estimation of a logistic model to predict a large increase in the unemployment rate over the next four quarters using only the credit spread and term spread yields the predicted probabilities in the figure 2.1 The probability of a large increase in the unemployment rate over the subsequent year implied by this approach as of the end of March 2022 is low, at about 5 percent. The event under study is an increase in the unemployment rate that has a 20 percent probability unconditionally. This suggests the risk of a recession over the year following March 2022 is below average.
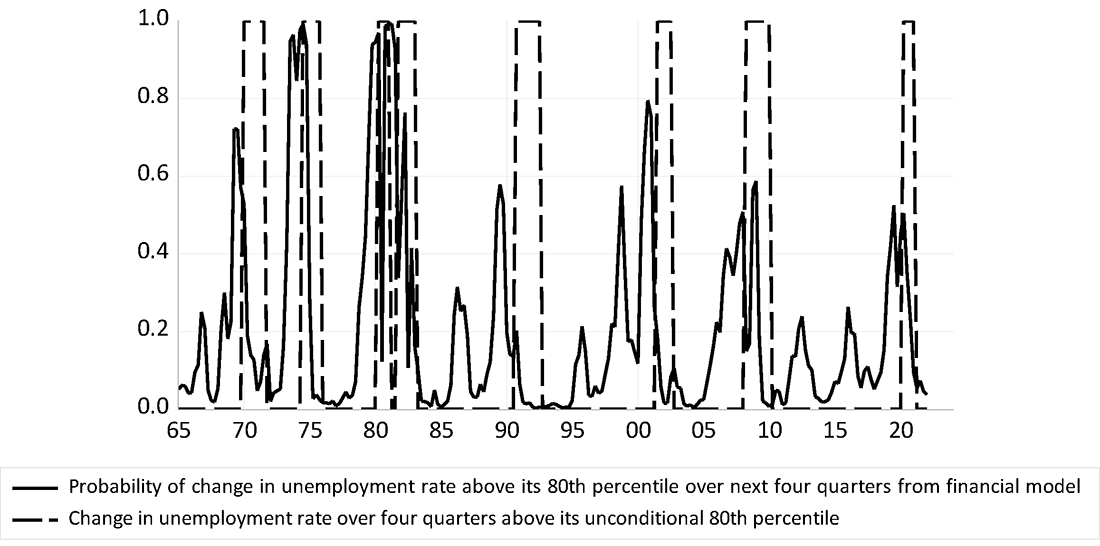
Source: Bureau of Labor Statistics and author's calculations
Recession Risk Using Leading Indicators
Another approach to assessing recession risk considers leading indicators identified by economists (e.g., Berge, 2015). As an example of this approach, I use the variables from the previous model (credit and term spreads) and add the change in the OECD's composite leading indicator for the United States. This leading indicator is a summary index of consumer confidence, business confidence, production and labor market indicators, and financial variables (including the term spread). The probability of a recession over the next four quarters from this estimated model is reported in figure 2 and is quite low as of March 2022, at about 5 percent.
While this exercise is illustrative of the approach using leading indicators, the related literature uses slightly different approaches—for example, leading indicators other than that produced by the OECD or methods that look directly at the underlying indicators that enter a leading indicator. For example, Berge (2015) follows the latter approach: In their analysis, Berge (2015) considers a set of individual indicators that includes the consumer confidence, business confidence, production and labor market indicators, and financial variables that enter typical leading indicators, and then combines their recession predictions using a statistical procedure (Bayesian Model Averaging) that applies higher weight to good predictors. Despite the differences between the approach of Berge (2015) and the simpler approach using a composite leading indicator illustrated in figure 3, key aspects of the approaches are similar. In particular, these composite indicator approaches tend to be useful for predicting recessions at short horizons but less useful at horizons beyond twelve months. (The appendix provides an illustration of this feature.)
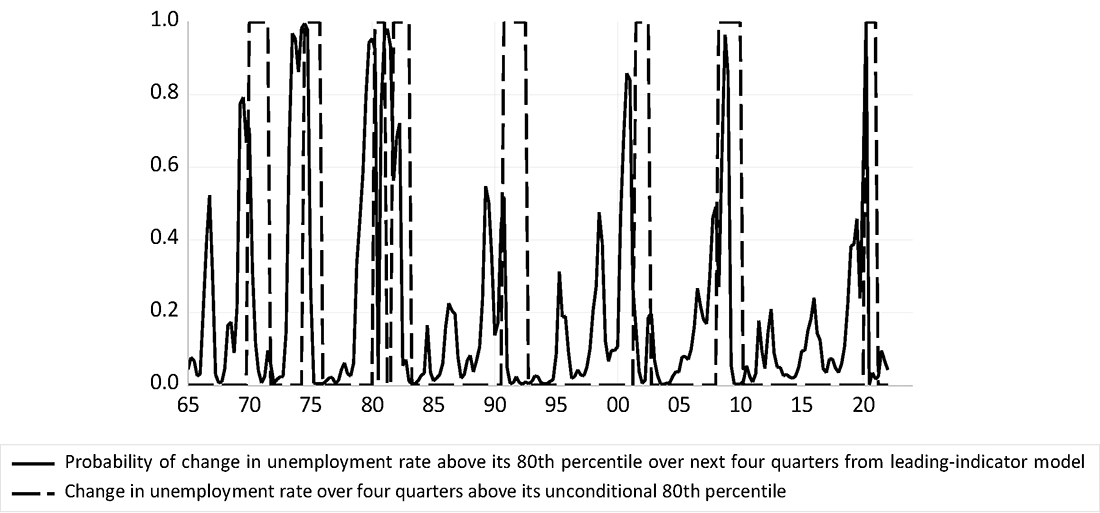
Source: Bureau of Labor Statistics and author's calculations
Recession Risk Using Inflation and the State of the Business Cycle (Unemployment Rate)
As of March 2022, inflation was at multidecade highs and the unemployment rate was near multidecade lows. Kiley (2018 & forthcoming) considered the ability of the level of inflation and the unemployment rate, in conjunction with financial variables, to predict large increases in the unemployment rate—focusing on horizons of a year or more. Following the approach in that research, a model with four variables is considered: CPI inflation (measured on a four-quarter change basis); the unemployment rate; the credit spread; and the term spread.2
Figure 4 reports the probability of a recession over the next four quarters from this approach. This approach implies a sizable risk (above 50 percent) of a large increase in the unemployment rate over the next four quarters. Historically, elevated inflation and low unemployment have preceded recessions, consistent with the idea that such developments signal imbalances (overheated product and labor markets) that may unwind through an economic contraction.
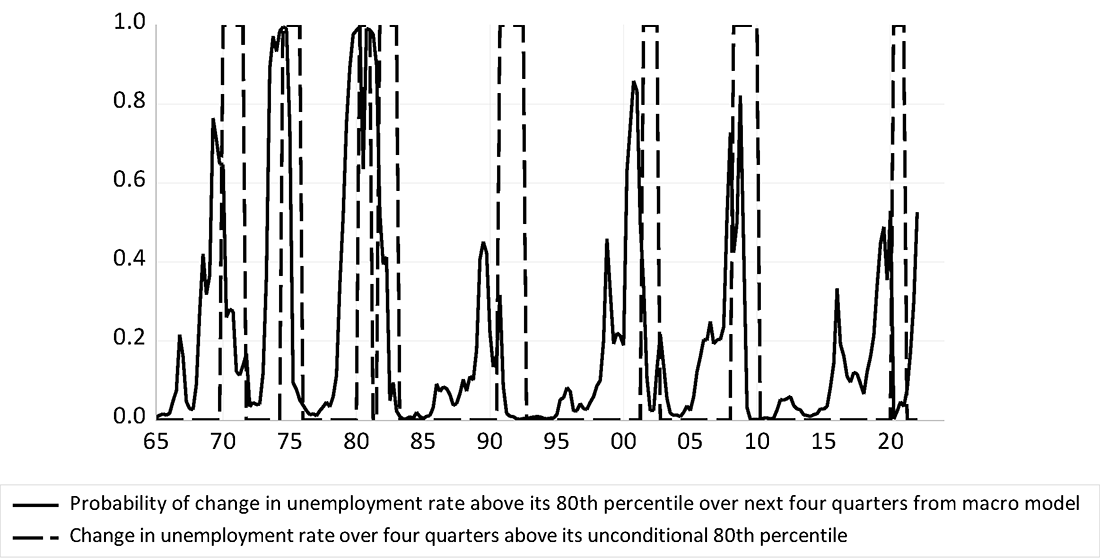
Source: Bureau of Labor Statistics and author's calculations
Kiley (2018 & forthcoming) highlights how the unemployment rate and inflation are stronger predictors of recession risk, relative to financial variables, over horizons longer than four quarters (a finding subsequently emphasized in Domash and Summers, 2022). To illustrate the implications of that finding for the current level of recession risk, figure 5 presents the probability of an increase in the unemployment rate that exceeds its 80th percentile over the subsequent eight quarters from the same approach. The approach implies a more sizable risk of a large increase in the unemployment rate, of about 67 percent over the next two years.
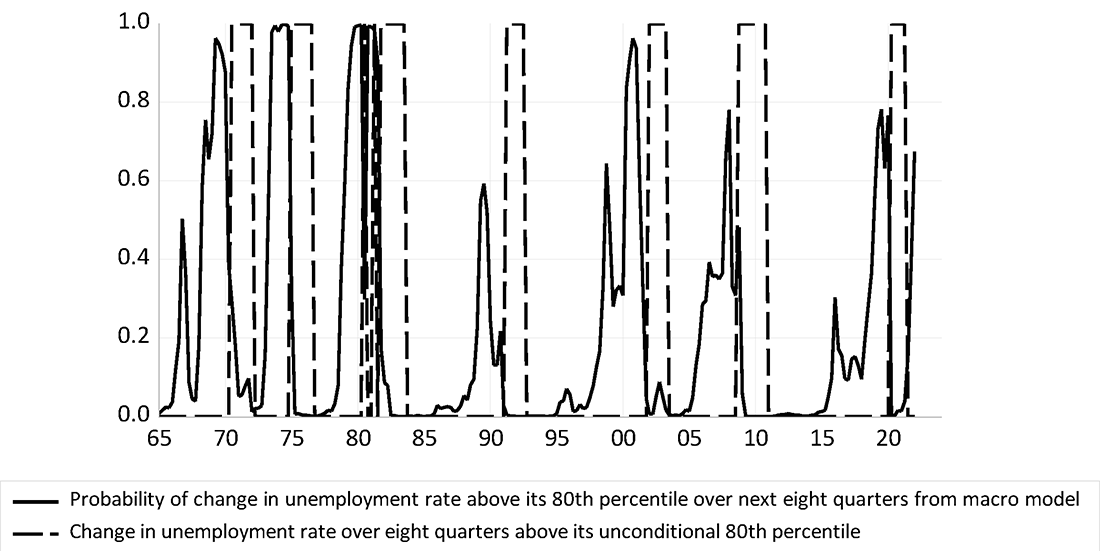
Source: Bureau of Labor Statistics and author's calculations
Finally, one notable aspect of the results in figures 4 and 5 is the effect that inclusion of the unemployment rate and inflation have on the predictive role of the term spread. In particular, inclusion of the unemployment rate and inflation lower the predictive role of the term spread, which contributes to the large risk of a recession associated with these regressions. (The appendix provides some details that further illustrate this result.)
Conclusion
The analysis herein highlights how financial, leading indicator, and other macroeconomic variables provide different signals regarding the risk of a recession. For example, the term spread does not suggest much risk of a recession over the near future, while the low level of unemployment and high level of inflation suggest a higher risk of a recession over the next year or two. Notably, a prediction model that includes the unemployment rate and inflation rate, in addition to the term spread, substantially lowers the role of the term spread in predicting recessions at one- or two-year horizons, suggesting that some of the predictive power of the term spread stems from the correlation of the term spread with the business cycle.
The differences across the approaches highlight the need for additional research. For example, the approach that combines inflation, unemployment, the credit spread, and the term spread nests the approach that only looks at the credit spread and the term spread. This nesting would imply that the larger model is superior if the sample of data is sufficiently large to provide reliable results. As highlighted in the figures, the sample period only includes seven episodes of large increases in unemployment, and econometric analysis with such limited historical experience is a challenge. Notably, all results herein are based on estimation over the full sample period and do not reflect "real-time" estimates or predictions.
Appendix
The research paper on which this analysis is based contains details, including an approach that uses quantile regressions rather than logistic (probability) models to estimate the risk of a large increase in the unemployment rate. Prediction at four-quarter horizons is challenging (and longer horizons present greater challenges). To highlight some results that shape the predicted probabilities, table A presents results for the three logistic regressions used to assess the probability of a large increase in the unemployment rate at the four-quarter horizon. The table reports the marginal effects of a one-standard deviation change in the variable and the associated confidence intervals, evaluated at the mean values for the predictor variables over the 1965Q1-2029Q4 sample. Marginal effects measure the change in the probability associated with the change in the variable (and hence are a more intuitive measure than the regression coefficients, as the mapping from regression coefficients to effects on probabilities is nonlinear and depends on the values of all of the predictors). The table also reports the pseudo-R2, which is a measure of fit for binary-dependent variable models.
Table A: Marginal Effects of Predictor Variables from Three Specifications of the Logistic Regression (four-quarter horizon)
| Predictor Variable | (1) | (2) | (3) |
|---|---|---|---|
| Financial variables | (1)+Leading indicator | (1)+Unemployment and Inflation | |
| Corporate bond spread | 0.1 | 0.06 | 0.13 |
| (-0.00,0.15) | (-0.01,0.13) | (0.01,0.18) | |
| Term spread | -0.22 | -0.15 | -0.12 |
| (-0.25,-0.15) | (-0.20,-0.02) | (-0.20,-0.02) | |
| Leading indicator (change in) | n.a. | -0.08 | n.a. |
| (-0.12,-0.02) | |||
| Unemployment rate | n.a. | n.a. | -0.09 |
| (-0.00,-0.14) | |||
| Inflation rate | n.a. | n.a. | 0.1 |
| (0.02,0.16) | |||
| Pseudo-R2 | 0.38 | 0.44 | 0.45 |
Note: The estimation sample is 1965Q1-2019Q4, and each predictor variable is lagged four quarters (to produce one-year ahead predictions). Marginal effects of each variable evaluated at the sample mean and scaled to correspond to a one-standard deviation change in the variable. The 95-percent confidence interval is reported under each marginal effect (in parentheses). Confidence interval obtained via the block bootstrap (with blocks of 11 quarters, to account for serial correlation in the data) as discussed in Kiley (forthcoming).
Three results are apparent. First, the predictors are generally statistically significant at the 5 percent level (and always significant at the 10-percent level, not reported). Second, the marginal effect of the term spread is roughly half the value in the financial-variables model when leading indicators or the macroeconomic variables are included. This suggests that some of the predictive power of the term spread reflects the tendency for the term spread to reflect macroeconomic conditions. Third, the additional macroeconomic variables modestly increase the fit of the models.
Results for a model including all of the predictors are not included, as Kiley (forthcoming) did not include the leading indicator in the analysis. However, inclusion of the leading indicator in the macroeconomic model (that is, adding this variable to the specification in column 3 of table A) does not alter the results—the predicted probability of a large increase in the unemployment rate over the next four quarters as of March 2022 remains above 50 percent. Nonetheless, expanding the set of predictor variables when only seven events are under consideration may lead to "small sample" problems.
Finally, table B presents results for three logistic regressions to assess the probability of a large increase in the unemployment rate at the eight-quarter horizon. Figure 5 uses the results in column (3), which include the unemployment rate, inflation rate, term spread, and corporate bond spread as predictors. Three results are apparent. First, the corporate bond spread and leading indicator are not statistically significant, while the unemployment rate is significant; focusing specifically on the leading indicator, its marginal effect is both insignificant statistically and very small in magnitude, highlighting how leading indicators are useful at short horizons (table A) and not useful at long horizons (table B). Second, the fit of the equation, as measured by the pseudo-R, increases by a noticeable amount when the unemployment rate and inflation are included. Third, the marginal effect of the term spread in the regression with the unemployment rate and inflation is one-third its level in the financial-variables only regression; this highlights that some of the predictive role of the term spread, which has been well documented in the literature, reflects the correlation of the term spread with the business cycle and inflation. These results echo those in Kiley (2018), Kiley (forthcoming), and Domash and Summers (2022).
Table B: Marginal Effects of Predictor Variables from Three Specifications of the Logistic Regression (eight-quarter horizon)
| Predictor Variable | (1) | (2) | (3) |
|---|---|---|---|
| Financial variables | (1)+Leading indicator | (1)+Unemployment and Inflation | |
| Corporate bond spread | 0.07 | 0.06 | 0.07 |
| (-0.03,0.13) | (-0.03,0.12) | (-0.00,0.12) | |
| Term spread | -0.24 | -0.23 | -0.09 |
| (-0.27,-0.12) | (-0.27,-0.09) | (-0.15,-0.00) | |
| Leading indicator (change in) | n.a. | -0.02 | n.a. |
| (-0.07,0.07) | |||
| Unemployment rate | n.a. | n.a. | -0.09 |
| (-0.00,-0.14) | |||
| Inflation rate | n.a. | n.a. | 0.06 |
| (-0.02,0.12) | |||
| Pseudo-R2 | 0.48 | 0.48 | 0.57 |
Note: The estimation sample is 1965Q1-2019Q4, and each predictor variable is lagged eight quarters (to produce two-year ahead predictions). Marginal effects of each variable evaluated at the sample mean and scaled to correspond to a one-standard deviation change in the variable. The 95-percent confidence interval is reported under each marginal effect (in parentheses). Confidence interval obtained via the block bootstrap (with blocks of 11 quarters, to account for serial correlation in the data) as discussed in Kiley (forthcoming).
Data sources
Board of Governors of the Federal Reserve System (US), Federal Funds Effective Rate [FEDFUNDS], retrieved from FRED, Federal Reserve Bank of St. Louis; https://fred.stlouisfed.org/series/FEDFUNDS, April 11, 2022.
Board of Governors of the Federal Reserve System (US), Market Yield on U.S. Treasury Securities at 10-Year Constant Maturity [DGS10], retrieved from FRED, Federal Reserve Bank of St. Louis; https://fred.stlouisfed.org/series/DGS10, April 11, 2022.
Federal Reserve Bank of St. Louis, Moody's Seasoned Baa Corporate Bond Yield Relative to Yield on 10-Year Treasury Constant Maturity [BAA10YM], retrieved from FRED, Federal Reserve Bank of St. Louis; https://fred.stlouisfed.org/series/BAA10YM, April 11, 2022.
Organization for Economic Co-operation and Development, Leading Indicators OECD: Leading indicators: CLI: Normalised for the United States [USALOLITONOSTSAM], retrieved from FRED, Federal Reserve Bank of St. Louis; https://fred.stlouisfed.org/series/USALOLITONOSTSAM, April 15, 2022.
U.S. Bureau of Labor Statistics, Consumer Price Index for All Urban Consumers: All Items in U.S. City Average [CPIAUCSL], retrieved from FRED, Federal Reserve Bank of St. Louis; https://fred.stlouisfed.org/series/CPIAUCSL, April 12, 2022.
U.S. Bureau of Labor Statistics, Unemployment Rate [UNRATE], retrieved from FRED, Federal Reserve Bank of St. Louis; https://fred.stlouisfed.org/series/UNRATE, April 11, 2022.
Literature Cited
Berge, Travis J., 2015. Predicting Recessions with Leading Indicators: Model Averaging and Selection over the Business Cycle. J. Forecast., 34: 455– 471. https://doi.org/10.1002/for.2345.
Domash, Alex and Lawrence H. Summers, 2022. A labor market view on the risks of a U.S. hard landing. NBER Working Paper No. 29910. April.
Engstrom, Eric C. and Steven A. Sharpe, 2019. "The Near-Term Forward Yield Spread as a Leading Indicator: A Less Distorted Mirror," Financial Analysts Journal, vol. 75, no. 4, ppg. 37-49.
Engstrom, Eric C., and Steven A. Sharpe, 2022. "(Don't Fear) The Yield Curve, Reprise," FEDS Notes. Washington: Board of Governors of the Federal Reserve System, March 25, 2022.
Faust, Jon & Simon Gilchrist & Jonathan H. Wright & Egon Zakrajšek. 2013. "Credit Spreads as Predictors of Real-Time Economic Activity: A Bayesian Model-Averaging Approach," The Review of Economics and Statistics, MIT Press, vol. 95(5), pages 1501-1519, December
Favara, Giovanni, Simon Gilchrist, Kurt F. Lewis, and Egon Zakrajsek. 2016. "Recession Risk and the Excess Bond Premium," FEDS Notes. Washington: Board of Governors of the Federal Reserve System, April 8, 2016.
Kiley, Michael T., 2018. "Unemployment Risk," Finance and Economics Discussion Series 2018-067. Washington: Board of Governors of the Federal Reserve System.
Kiley, Michael T., forthcoming. "Unemployment Risk." Journal of Money, Credit, and Banking.
Romer, Christina D. & David H. Romer. 1989. "Does Monetary Policy Matter? A New Test in the Spirit of Friedman and Schwartz," Chapters, in: NBER Macroeconomics Annual 1989, Volume 4, pages 121-184 National Bureau of Economic Research, Inc.
1. The appendix reports some estimation results for this model and the other models analyzed below. Return to text
2. Kiley (forthcoming) also considers a measure of nonfinancial credit growth and finds this variable predicts unemployment risk at horizons greater than a year. Kiley (forthcoming) expands the analysis in Kiley (2018) by considering quantile regressions and logit regressions to assess unemployment risk. As much of the literature on recessions risks uses binary dependent variable approaches such as logit regression, quantile regressions are not examined in this note. However, the messages of this analysis carry over when a quantile-regression approach is considered. Return to text
Kiley, Michael T. (2022). "Financial and Macroeconomic Indicators of Recession Risk," FEDS Notes. Washington: Board of Governors of the Federal Reserve System, June 21, 2022, https://doi.org/10.17016/2380-7172.3126.
Disclaimer: FEDS Notes are articles in which Board staff offer their own views and present analysis on a range of topics in economics and finance. These articles are shorter and less technically oriented than FEDS Working Papers and IFDP papers.