FEDS Notes
August 30, 2023
FinTech-Issued Personal Loans in the U.S.1
Jessica N. Flagg‡ and Simona M. Hannon§
On September 22, 2023, this FEDS Note was revised to remove an inaccurate statement about the legislative environment governing personal loan issuance by banks chartered in New Jersey.
The financial technology advances of the past decade brought to prominence a new group of lenders active within the personal loan space—financial technology (FinTech) lenders. Although traditional lenders such as banks, thrifts, credit unions, and finance companies continue to play an important role in providing personal loans to consumers, FinTech lenders gained a notable market share. In this note, we provide an overview of the FinTech sector as it is captured in two relatively new data sources.
As of the end of 2022, personal loans—also known as installment loans or other loans, and consisting of those for a variety of purposes, such as debt consolidation, medical bills, vacations, or the payment of a large ticket item—reached $356 billion or about 10 percent of nonrevolving credit.2 The Federal Reserve Bank of New York Consumer Credit Panel (CCP)/Equifax data show that about $50 billion or 14 percent of personal loans consist of FinTech-issued loans. These loans are unsecured, and the majority have fixed rates.
As mentioned in our previous paper (Flagg and Hannon, 2023) that provided an overview of personal loans, the United States consumer credit regulatory environment is dynamic, multilayered, and complex, in particular for nonbank lender-issued personal loans. Interest rate ceilings and banks' interest rate exportation ability—the two most important regulatory elements affecting the personal loan space—are both relevant for FinTech lending.3 In addition, the 2015 Madden v. Midland Funding ruling (discussed at length by Danisewicz and Elard, 2018) put its mark on the FinTech sector. The ruling restricted FinTech-bank partnership-issued loans in New York and Connecticut by rendering loans with interest rates above the usury rates in those states null if sold to nonbanks, a key feature of the FinTech-bank partnership model (highlighted by Elliehausen and Hannon, 2023).
Although more recently some FinTech lenders morphed into banks, at their origin, these institutions are nonbanks. As a result, they are subject to interest rate ceilings, which means their profitability is inhibited in states with low consumer finance rate ceilings. In contrast, banks are able to avoid these regulatory constraints by making use of the 1978 Marquette ruling which enabled national banks to charge an interest rate permitted by the lending bank's home state regardless of the rate permitted by the borrower's state of residence. Elliehausen and Hannon (2023) show that FinTech lenders partner with banks to circumvent low interest rate ceilings and end up disproportionately targeting near-prime and low-prime consumers located in states with low consumer finance rate ceilings. This feature of their business model—the partnership with banks—affects how FinTech-issued loans are reported to credit bureaus and why in the CCP data FinTech loans appear spread across traditional lender sectors.
To examine FinTech lenders' business model, we first look at the supply of FinTech-issued personal loans discussed in the next section.
1. The Supply of FinTech-issued Personal Loans
To better understand the supply landscape for personal loans, we turn to Mintel Comperemedia (hereafter, Mintel), a data set consisting of monthly acquisition offers (solicitations) for personal loans. As the solicitations are credit offers, they are a measure of credit supply.4 The data represent monthly campaign-level mail volume sent to consumers. Mintel randomly selects roughly 4,000 consumers from a pool of 1 million that it purchased from a large survey service provider.5 The company records all the offer details in its databases, thus offering insights into the rich supply offer landscape.6 Finally, Mintel applies weights to the approximately 2,500 consumers participating in the survey to represent the entire U.S. adult population.
Importantly for our analysis of the supply landscape, the data enable us to observe by name, the company sending the offer, its brand partner companies, if applicable, and the product type. Knowledge of the name of each company in the dataset enables us to categorize the offers by lender type.7
Mintel data estimates show that in 2022 over 1.4 billion unsecured personal loan acquisition offers were sent to consumers. FinTech lenders in partnership with specialist banks currently dominate the unsecured personal loan supply landscape with 35 percent of offers and are followed by finance companies with 27 percent and banks, which now include LendingClub Bank, N.A., with 26 percent.8 FinTech lenders without bank partners make up only a small share of solicitations, 7 percent. The remainder of offers are made by payday lenders, credit unions, and other institutions.
Our data allows us to examine the FinTech-bank partnership solicitation mail volume from three perspectives.
First, looking at the total solicitation mail volume over the period, as shown by Elliehausen and Hannon (2023) and reflected in Figure 1, we note that when in partnership with specialist banks, FinTech lenders concentrate their mail offer solicitations in states with low consumer finance rate ceilings. Banks' ability to export their home state interest rate allows FinTech lenders to circumvent state usury laws and solicit marginal consumers in states with low consumer finance rate ceilings.
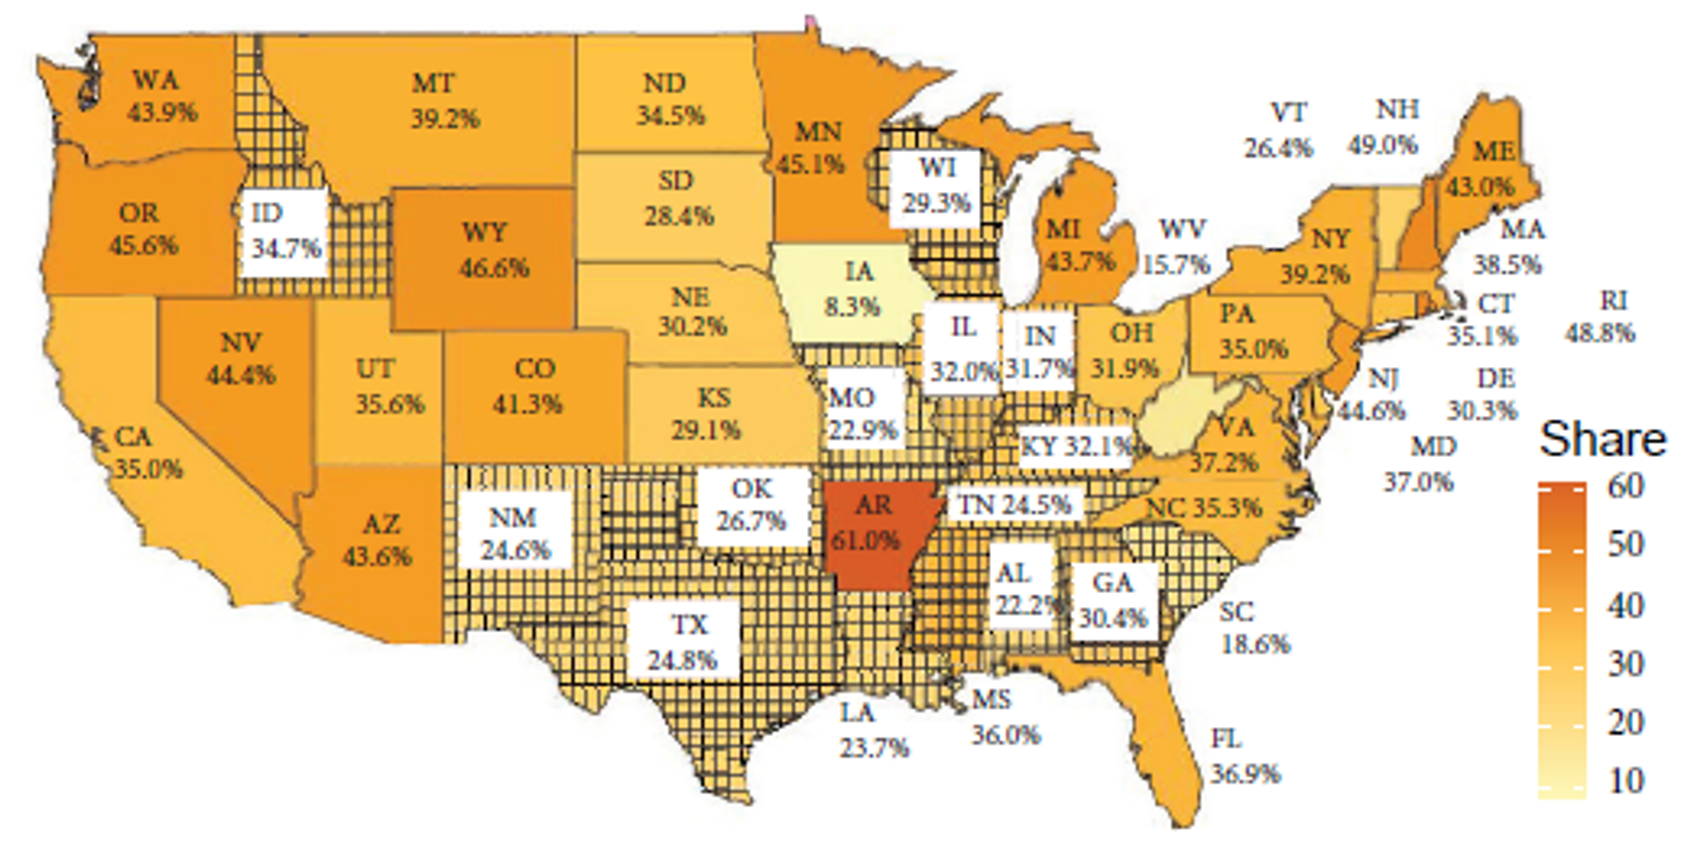
Note: This figure shows the share of FinTech-bank partnership mail volume in total mail volume over the period. High consumer finance interest rate ceiling states are hatched. When issuing offers in partnership with banks, FinTech companies concentrate their mail solicitations in states with low consumer finance rate ceilings, as they are able to avoid these restrictions thanks to banks’ ability to export their home state interest rate. For details see Elliehausen and Hannon (2023).
Source: Mintel Comperemedia.
Second, as Mintel data allow us to identify the main banks enabling FinTech companies to access markets that would otherwise restrict a non-bank presence (Figure 2a), we observe the notable participation of the market leaders WebBank (57 percent of offerings) and Cross River Bank (38 percent of offerings), alongside other banks such as First Bank of Delaware, First Electronic Bank, Farmers Merchant Bank, Mid America Bank & Trust Company, County Bank of Rehoboth Beach, Republic Bank, The Brand Banking Company, FinWise Bank, Goldman Sachs Bank USA, First Bank & Trust, and Capital Community Bank.
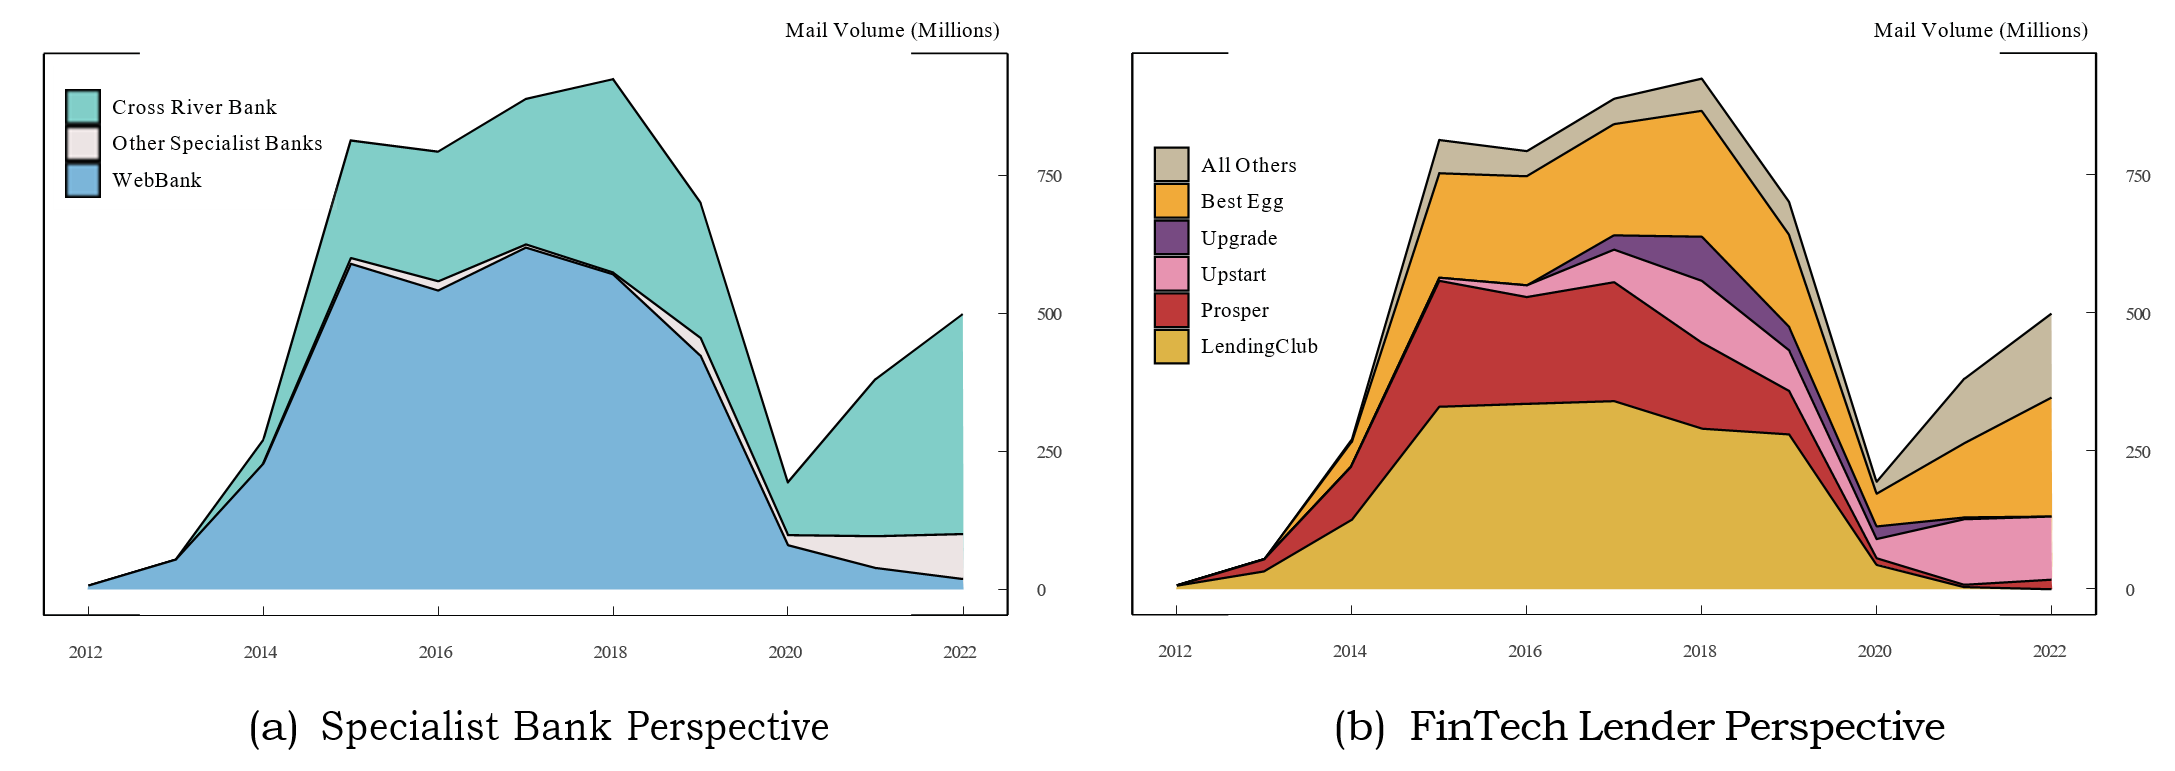
Note: The left panel shows the FinTech-bank partnership mail volume from the perspective of the specialist banks enabling the offers. The right panel shows the FinTech-bank partnership mail volume from the perspective of the FinTech lenders issuing the offer in partnership with the specialist banks. Key identifies in order from top to bottom.
Source: Mintel Comperemedia.
Third, as the data allow us to observe the FinTech lender making the offer in partnership with banks, we note that the FinTech company presence in partnership structures is less concentrated than that of partner banks (Figure 2b). LendingClub, prior to becoming a bank, has the largest share of offerings (33 percent of offerings), followed by Best Egg (26 percent of offerings) and Prosper 18 percent of offerings). Upstart and Upgrade have much smaller shares of offerings (10 percent and 3 percent of offerings, respectively).
To understand how FinTech loans are reported to credit bureaus, we must briefly look at the mechanism behind the FinTech-bank partnerships discussed at length by Elliehausen and Hannon (2023).
2. FinTech-Bank Partnership Mechanism
The FinTech-bank partnership opportunity is born at the intersection of state usury rate ceiling restrictions and the Marquette ruling. Powered by the Marquette ruling, banks are able to export their home state interest rates to most states, irrespective of the state's interest rate ceiling. Limited by the state usury laws, FinTech companies operating alone find that doing business in states with low interest rate ceilings is less profitable than in high- or no-rate ceiling states. However, some FinTech companies have partnered with banks to circumvent the usury rate legislation by offering joint personal loan offers. For these partnerships to be efficient, the banks that are typically involved in these partnerships, specialist banks, have to be either exempt from rate ceilings or located in states with high or no consumer finance rate ceilings. For example, WebBank, one of the major specialist banks engaged in partnerships, has a Utah industrial loan bank charter that exempts it from state lender licensing laws, interest rate ceilings, and money service business laws. In Figure 3 we highlight some of the FinTech-bank partnerships observed in the Mintel data over the past decade and indicate the strength of the relationship between specialist banks and their FinTech partners.
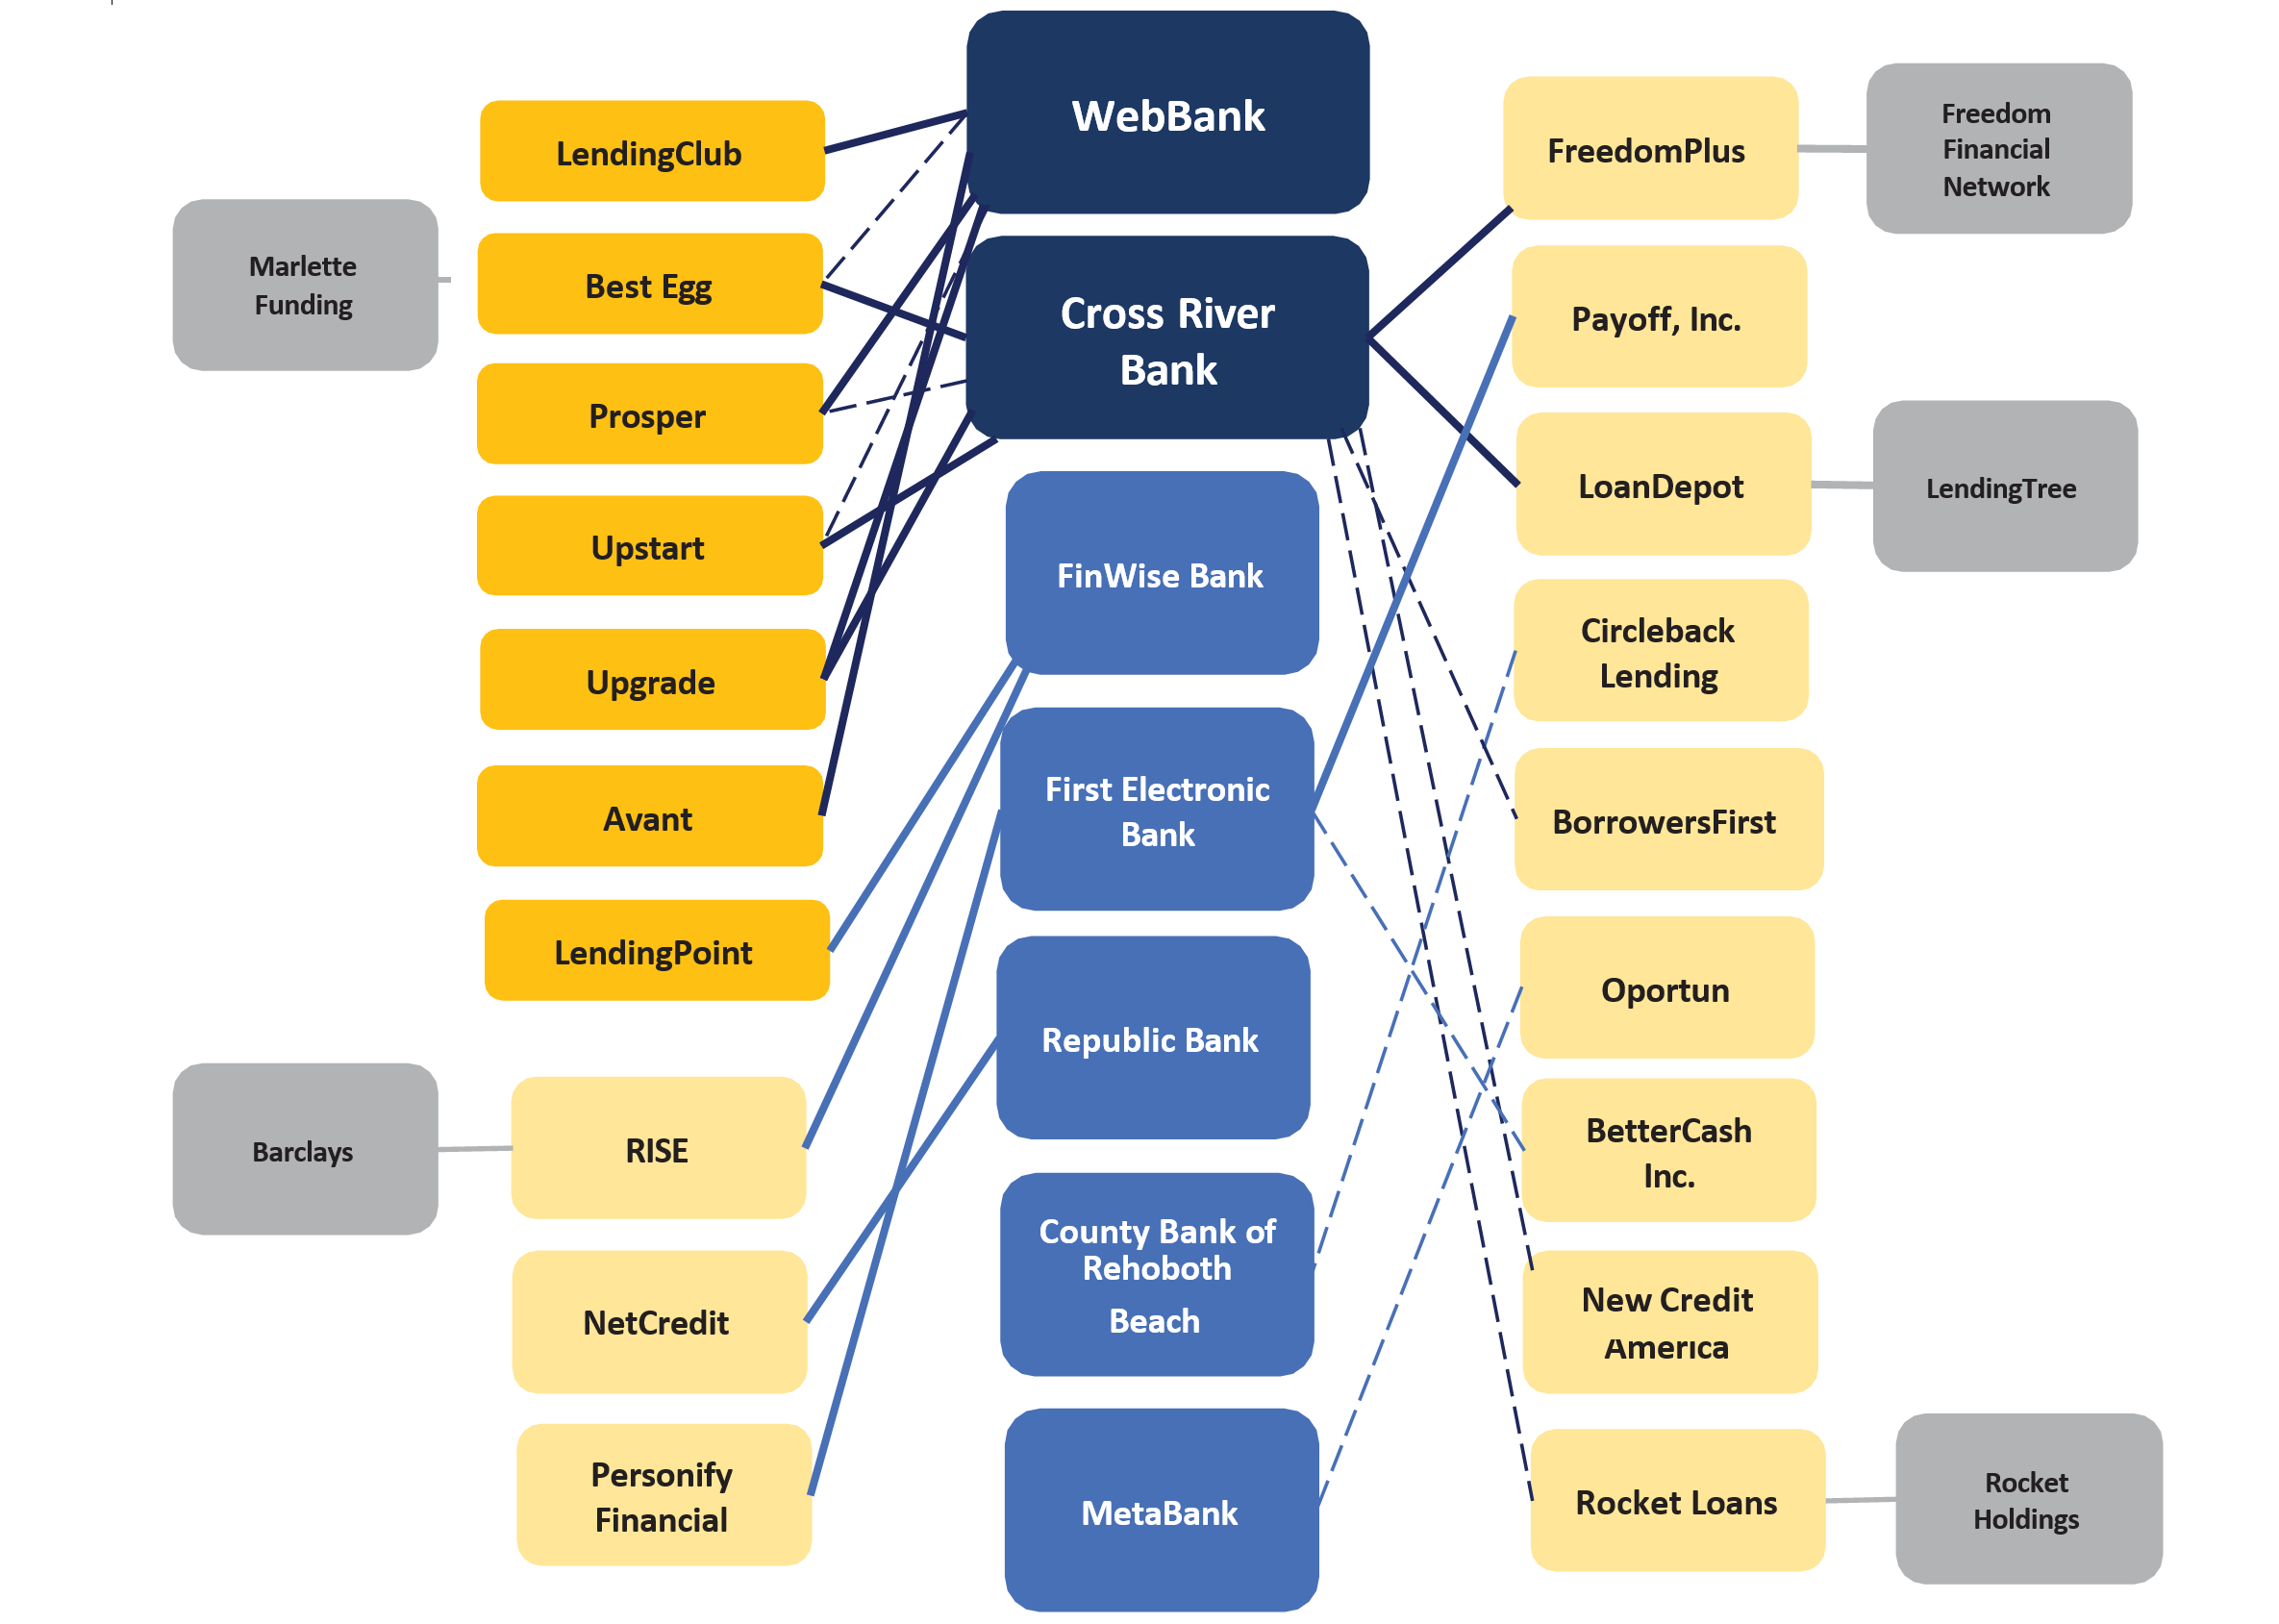
Note: This figure shows the footprint of FinTech-bank relationships observed in our data. In blue, we show a list of the banks engaged in partnerships with FinTech companies. In orange, we show the FinTech companies partnering with the banks we observe. In gray, we show the parents of the FinTech companies engaged in partnerships. We decrease the pigment from strong to weak to indicate market shares, and we use thick solid lines to designate stronger partnership relationships and dashed thin lines for weaker relationships. The relationships and the participants highlighted are non-exhaustive.
Source: Mintel Comperemedia.
When these partnerships occur, the bank becomes the "true lender" by making the loan on behalf of the FinTech company. The bank holds onto the loan for a number of days or even months and may retain a certain percentage of the loan production. Loans are then sold back to the FinTech company, which in turn sells them in either the private or public securitization market (see Scully, 2015). This business model has implications for how these loans are reported to credit bureaus, as, when issued, these loans are being reported as being part of the bank sector, and, later, once transferred to FinTech lenders, these loans appear as part of the finance company sector. As a result, our expectation is that the majority of FinTech-issued loans are included in the finance company sector, while a smaller share of newly issued loans are reflected in bank holdings. To explore this possibility, we examine the FinTech loans outstanding reflected in the CCP.
3. FinTech Loans Outstanding
To examine the FinTech presence within the outstanding universe of personal loans, we examine a newly-released loan-level version of the quarterly Federal Reserve Bank of New York Consumer Credit Panel (CCP), a database on consumers' credit use and payment performance drawn from anonymized Equifax credit bureau records.9 The sample covers personal loan (or account) holdings of finance companies and depository institutions—banks, thrifts, and credit unions— and reflects up to four accounts (or loans) per individual. In addition to sector-specific indicators, the data include narrative codes that enable the grouping of holdings by product type, for example, unsecured or secured, and also indicate whether the interest rate on a certain loan is fixed. Crucially for our analysis, starting with 2022:Q2, the data include a FinTech sector indicator developed by the Federal Reserve System in collaboration with Equifax.10
As personal loans tend to have lower incidence than other loan types, to ensure proper coverage, we use a 10 percent random sample from the total available 5 percent sample for 2022:Q4. As of the end of the fourth quarter of 2022, the consumer finance CCP loan-level sample covered more than 31 million individuals or about 11 percent of the entire adult population covered by the CCP.11 The personal loan sector reached $356.1 billion and consisted of 36.2 million accounts. FinTech lender holdings represented 14 percent of the total, or $49.9 billion, and consisted of 7.7 million accounts.
First, looking at outstanding balances (Table 1), we note that, indeed, as mentioned in the previous section, FinTech lender balances are represented across sectors in the credit bureau data. Finance companies hold the largest share of FinTech-issued loans—$32.2 billion—which represents 39 percent of their personal loan balances. Among finance companies, personal loan companies and miscellaneous companies hold similar amounts of FinTech-lender issued balances—15.5 billion and 16.7 billion, respectively—that represent different shares of their holdings—29 percent for personal loan companies and 79 percent for miscellaneous companies. Sales finance companies hold a very small share of FinTech loans. Nearly all depository institution FinTech holdings are concentrated at banks. Banks hold $17.7 billion of FinTech issued loans, representing 10 percent of their total personal loans, or 6.5 percent of total depository institution personal loan holdings.
Table 1: FinTech Holdings Across Personal Loan Sectors as of 2022:Q4
| Personal Loans By Sector | All (billion $) I |
FinTech (billion $) II |
Share FinTech (%) III |
|---|---|---|---|
| Depository Institutions | 273.6 | 17.7 | 6.5 |
| Banks | 172.4 | 17.7 | 10 |
| Thrifts | 2.5 | 0 | 0 |
| Credit Unions | 98.7 | 0.03 | 0 |
| Finance Companies | 82.5 | 32.2 | 39 |
| Personal Loan Companies | 53.8 | 15.5 | 29 |
| Sales Finance Companies | 7.7 | 0.08 | 1 |
| Miscellaneous Companies | 21 | 16.7 | 79 |
| Total | 356.1 | 49.9 | 14 |
Note: Due to FinTech lenders specific business models, FinTech holdings are reflected in credit bureau data across sectors. In this table we show the share of FinTech lender-issued loans within each personal loan sector.
Source: Federal Reserve Bank of New York Consumer Credit Panel (CCP)/Equifax.
Second, as FinTech-issued loans are almost exclusively unsecured, we examine their characteristics in comparison to unsecured loans issued by other sectors (Table 2). In terms of outstanding loans and balances, the FinTech sector, at nearly $50 billion and 7.6 million accounts, is much larger than the finance company sector ($18 billion and 4.2 million accounts), yet smaller than the depository institutions sector ($74.5 billion and 9 million accounts). The median FinTech account balance is $4,371, comparable to the median depository institution account balance of $4,154 and much higher than the median finance company account of $2,613. FinTech lender issued loans tend to have similar maturities than those issued by banks but higher than those issued by finance companies (2.3 years, 2.5 years, and 1.4 years, respectively). The median monthly payment on a FinTech account is $200, $36 higher than that on a finance company account, but $10 lower than that on a personal loan from a depository institution.
Table 2: Unsecured Personal Loan Holding Characteristics by Sector as of 2022:Q4
| FinTech Lenders I |
Depository Institutions II |
Finance Companies III |
Total Unsecured IV |
|
|---|---|---|---|---|
| Outstanding Balance (billion $) | 49.6 | 74.5 | 18 | 142 |
| Number of Accounts (million) | 7.6 | 9 | 4.2 | 20.8 |
| Balance per Account (median) | 4,371 | 4,154 | 2,613 | 3,877 |
| Median Loan Maturity (years) | 2.3 | 2.5 | 1.4 | 2.2 |
| Account Monthly Payment (median) | 200 | 210 | 164 | 195 |
| Borrower Equifax Risk Score (median) | 673 | 711 | 607 | 677 |
| Borrower Age (median) | 45 | 47 | 48 | 46 |
| Share Balance Fixed Rate (%) | 72 | 53 | 12 | 54 |
| Share Balance Nonprime (%) | 56 | 39 | 88 | 51 |
| Delinquency (%) | 3.38 | 1.89 | 7.01 | 3.06 |
Note: Although separately identified in the table, due to FinTech lenders specific business models, FinTech holdings are reflected in credit bureau data across sectors. In this table, depository institutions and finance company holdings are reported exclusive of FinTech lender holdings. Loan maturities are those for loans issued during the quarter of analysis. The median Equifax Risk Score in the entire covered population is 742 and the median age is 49. Nonprime is an Equifax Risk Score lower than 720. Delinquency measures the fraction of balances that are at least 30 days past due, excluding severe derogatory loans.
Source: Federal Reserve Bank of New York Consumer Credit Panel (CCP)/Equifax.
When examining the personal loan holdings across sectors through the lens of borrowers' credit risk profiles, we note the influence of institutional characteristics. In line with their known risk aversion, depository institutions offer personal loans primarily to higher credit risk score borrowers. In contrast, finance companies stay true to their position as a traditional source of credit for riskier borrowers. FinTech lenders, by targeting near- and low-prime borrowers, positioned themselves in between the two aforementioned lender types. The median borrower Equifax risk score is 711 on an unsecured depository institution account, 607 on a finance company account, and 673 on a FinTech-lender issued account.
The majority of FinTech-issued loans and depository institution loans—72 percent and 53 percent, respectively—have fixed rates. In contrast, only 12 percent of finance company loans have fixed interest rates.
Exposure to nonprime borrowers (those with Equifax Risk Scores lower than 720) varies by sector, in line with the risk aversion levels of each lender type. Finance companies, as the main credit provider to riskier borrowers, have 88 percent of their unsecured personal loan balances held by nonprime consumers. In contrast, depository institutions have 39 percent of their balances held by such consumers. By focusing on offering credit to near-prime and low-prime consumers, FinTech lenders' exposure to nonprime borrowers is somewhere in between that of finance companies and banks, at 56 percent.
Delinquency rates vary by sector. In line with their known risk aversion, depository institutions have the lowest unsecured personal loan delinquency rate at 1.89 percent, followed by FinTech lenders with a delinquency rate of 3.38 percent. Finance companies have the highest delinquency rate at 7 percent.
Finally, when examining the geographical distribution of FinTech loans under the form of a share of total FinTech balances in total outstanding personal loans (Figure 4), we note that by partnering with specialist banks as we have shown above, FinTech lenders circumvent state usury laws and make similar amounts of loans irrespective of state interest rate ceiling height. In other words, the geographical concentration of FinTech loans does not vary with the height of each state's consumer finance interest rate ceiling due to FinTech lenders' partnership with specialist banks.
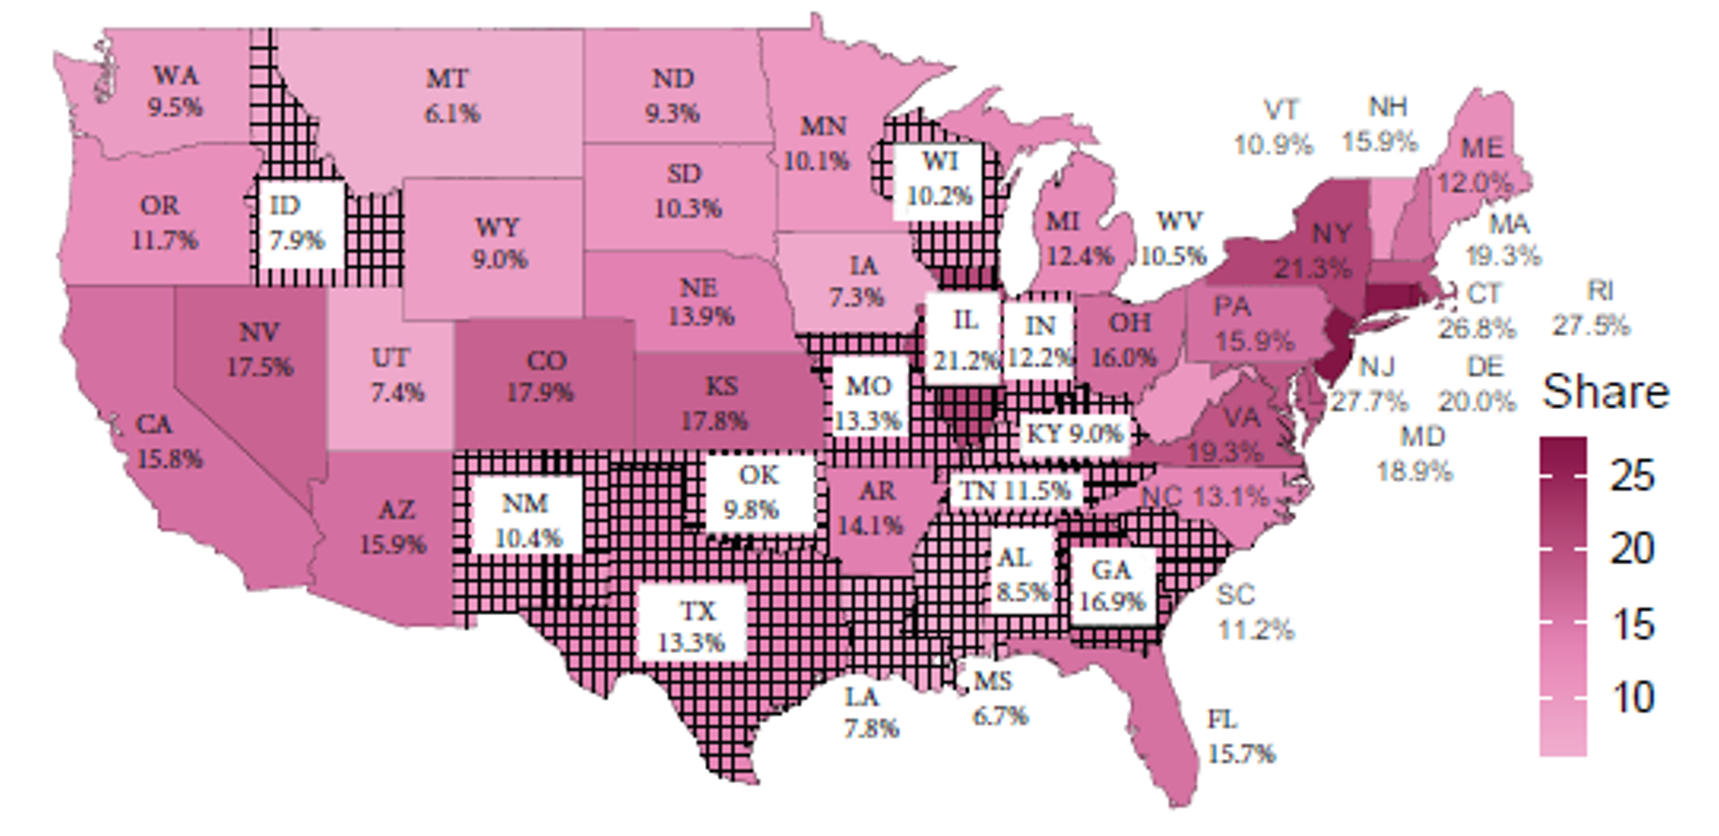
Note: This figure shows the share of FinTech total outstanding balances in total outstanding personal loan balances. High consumer finance interest rate ceiling states are hatched. By partnering with specialist banks, FinTech lenders are able to circumvent usury laws and make similar amounts of loans irrespective of state interest rate ceiling height.
Source: Federal Reserve Bank of New York Consumer Credit Panel (CCP)/Equifax.
References
Danisewicz, P. and I. Elard (2018). "The Real Effects of Financial Technology: Marketplace Lending and Personal Bankruptcy", working paper, July (revised April 2022), https://papers.ssrn.com/sol3/papers.cfm?abstract_id=3208908.
Dettling, L. J. and J. W. Hsu (2021). "Minimum Wages and Consumer Credit: Effects on Access and Borrowing". Review of Financial Studies, vol. 34 (May), pp. 2549–79.
Elliehausen, Gregory, and Simona M. Hannon (2023). "FinTech and Banks: Strategic Partnerships That Circumvent State Usury Laws," Finance and Economics Discussion Series 2023-056. Washington: Board of Governors of the Federal Reserve System, https://doi.org/10.17016/FEDS.2023.056.
Flagg, Jessica N., and Simona M. Hannon (2023). "An Overview of Personal Loans in the U.S.," Finance and Economics Discussion Series 2023-057. Washington: Board of Governors of the Federal Reserve System, https://doi.org/10.17016/FEDS.2023.057.
Han, S., B. J. Keys, and G. Li (2018). "Unsecured Credit Supply, Credit Cycles, and Regulation". Review of Financial Studies, vol. 31 (March), pp. 1184–1217.
Lee, D. and W. V. der Klaauw (2010). "An introduction to the FRBNY Consumer Credit Panel". Technical report, New York: Federal Reserve Bank of New York, November 10, https://www.newyorkfed.org/research/staff_reports/sr479.html.
Scully, M. (2015). "How Bank Partnerships with Marketplace Loan Platforms". American Banker, February 24.
‡Address: Board of Governors of the Federal Reserve System, 20th Street and Constitution Avenue NW, Washington, DC 20551, USA Email: [email protected]. Return to text
§Address: Board of Governors of the Federal Reserve System, 20th Street and Constitution Avenue NW, Washington, DC 20551, USA Email: [email protected]. Return to text
1. We thank Geng Li and Kamila Sommer for helpful comments and suggestions, Anuj Shahani for generous help with Mintel Comperemedia data, and David Jenkins for outstanding editing. The views in this note are those of the authors and do not necessarily reflect those of the Board of Governors of the Federal Reserve System or its staff. Return to text
2. This estimate is based on data from Federal Reserve Bank of New York Consumer Credit Panel (CCP)/Equifax. More details about this estimate can be found in our "An Overview of Personal Loans in the U.S." paper. Return to text
3. Currently, 15 states have high or no interest rate ceilings: South Carolina, Georgia, Texas, Oklahoma, Louisiana, Tennessee, Missouri, Illinois, New Mexico, Kentucky, Alabama, Wisconsin, Indiana, Mississippi, and Idaho. Return to text
4. Dettling and Hsu (2021) and Han et al. (2018) discuss the use of solicitations as a measure of supply. Return to text
5. The Mintel panel is balanced on four major demographic characteristics: region, age, income, and household size. Each month about 2,500 consumers participate in the Mintel survey by mailing back to Mintel offers from across the sectors monitored by the company. Mintel motivates participation with raffles offering prizes, such as gift cards. Return to text
6. Every month, post collection, the data are sent to TransUnion alongside the name and address of the panelist. TransUnion then appends the VantageScore credit score for every panelist. Mintel conducts an additional survey on participating consumers to collect household-level demographic and socioeconomic information. This additional information is merged with the mail offer information. The demographic and socioeconomic information collected by Mintel applies to the household head and is representative at the household level, while the VantageScore is that of the panelist. Return to text
7. We categorize the lenders programmatically when their name allows us to and manually, with the help of the Google search engine, otherwise. Return to text
8. LendingClub became a bank in February 2021. Return to text
9. The sampling procedure ensures that the same individuals remain in the sample in each quarter and allows for entry into and exit from the sample, so that the sample is representative of the target population in each quarter. See Lee and der Klaauw (2010) for a description of the design and content of the CCP. See also https://www.newyorkfed.org/medialibrary/interactives/householdcredit/data/pdf/data_dictionary_HHDC.pdf. Return to text
10. The indicator can take the value of 1 or 2. A value of 1 indicates that the respective loan has been issued by a firm among the following: Advance Financial, All-State Credit Plan, LLC, Avant, Best Egg, BetterCash Inc. offer by Money Lion, BMG Money Inc., BorrowersFirst, CircleBack Lending, Cobalt Advisors, CreditShop, Earnest Operations LLC, Elastic, Fingerhut, Finwise/Opploans, Firstmark/Commonbond/Finance, Firstmark/Commonbond/Nelnet, Firstmark/Commonbond/UBT, Fortiva, Freedom Financial Network, FreedomPlus, GreenSky Financial, iLoan, LendingClub, LendingPoint, LendKey, LendUp, LoanDepot, Marcus by GS, NetCredit, New Credit America, Omni Financial, Opportunity Financial, Payoff, Inc., Personify Financial, Prosper, Quicken Loans Inc., RISE, RocketLoans, Quicken, Social Finance, Inc./SoFi Lending, Springstone Financial LLC, Upgrade, and Upstart. A value of 2 indicates that Equifax has identified the loan issuer as "Alternative Finance/Online," a group of nontraditional lenders that lend exclusively through online channels with minimal human interaction. The list of lenders included in the latter group is not publicly available. Return to text
11. As of 2022:Q4, the CCP covered 282 million individuals, 237 million with credit scores. Return to text
Jessica N. Flagg, Simona M. Hannon (2023). "FinTech-Issued Personal Loans in the U.S.," FEDS Notes. Washington: Board of Governors of the Federal Reserve System, August 30, 2023, https://doi.org/10.17016/2380-7172.3362.
Disclaimer: FEDS Notes are articles in which Board staff offer their own views and present analysis on a range of topics in economics and finance. These articles are shorter and less technically oriented than FEDS Working Papers and IFDP papers.