FEDS Notes
July 15, 2019
Historical Proxies for the Secured Overnight Financing Rate
This note was revised on September 16, 2019 to add the note below Table 1.
The Federal Reserve Board and Federal Reserve Bank of New York (FRBNY) convened the Alternative Reference Rates Committee (ARRC) to recommend an alternative rate to U.S. dollar LIBOR and to develop plans to promote its use. In June 2017, as part of this mandate, the ARRC selected the Secured Overnight Financing Rate (SOFR) as its recommended alternative. In this note, I describe the available history of SOFR data and argue that other historical data published by FRBNY can act as a reasonable proxy for SOFR going back to 1998.
SOFR is the broadest available measure of rates in the overnight repurchase agreement (repo) market in which Treasury securities are posted as collateral. It includes transactions in the tri-party repo market from Bank of New York Mellon, General Collateral Finance Repo Service (GCF Repo®) transactions, and bilaterally settled transactions cleared by the Fixed Income Clearing Corporation (FICC).1 FRBNY, in cooperation with the Office of Financial Research, began publishing SOFR on April 3, 2018.2 Prior to the start of official publication, FRBNY also released data from August 2014 to March 2018 representing modeled, pre-production estimates of SOFR that are based on the same basic underlying transaction data and methodology that now underlie the official publication.
While the data required to calculate SOFR do not exist prior to August 2014, FRBNY has also separately released a much longer historical data series based on primary dealers' overnight Treasury repo borrowing activity. Since the late 1990s, the Open Market Trading Desk at FRBNY has conducted a survey of primary dealers each morning covering their borrowing activity that day in the Treasury general collateral (GC) repo market. Using this survey, FRBNY released a time series, going back to February 1998, of the volume-weighted mean rate of the primary dealers' overnight Treasury GC repo borrowing activity.
It is important to note that there are a number of technical differences between SOFR and the primary dealer survey rate (survey rate). The survey rate is calculated as a volume-weighted mean whereas as SOFR is calculated as a volume-weighted median. In addition, the transactions underlying the survey rate are not as broad as those underlying SOFR, as the survey collects only the GC segments of the repo market and does not capture borrowing activity conducted by non-primary dealer market participants. Nonetheless, despite these differences, this note argues that the historical survey data is an adequate proxy for SOFR for risk modelling or other purposes. In order to understand why this could be the case, it is useful to first cover some details about the structure of Treasury repo markets.
The tri-party repo market is based on clearing and settlement infrastructure provided by the Bank of New York Mellon.3 Tri-party transactions are secured by GC pools of accepted Treasury securities, any of which can be delivered as collateral by the cash borrower. Repo transactions facilitated by the tri-party infrastructure fall into two segments: Tri-party ex-GCF transactions, which are tri-party transactions not cleared through FICC, and GCF transactions, which are cleared through FICC's GCF repo service. The tri-party ex-GCF segment predominantly involves institutional investors--such as money market funds--lending cash to broker-dealers. The GCF segment is largely an inter-dealer market where cash raised from institutional investors is reallocated among broker-dealers. Unlike GC repo, bilateral repo trades can designate specific securities as collateral.4 The majority of netting members in the FICC-cleared bilateral market are broker-dealers, so, like the GCF segment of tri-party repo, the FICC-cleared bilateral market mostly consists of trades among dealers, as opposed to trades between dealers and their clients. Bowman et al. (2017) show that, apart from the lower tail of bilateral trades that are omitted from SOFR, bilateral repo transactions are generally distributed fairly similarly to GCF transactions, as both are essentially inter-dealer markets.5 Many dealers may move with some fluidity between the two market segments depending on relative transactions costs--for example, activity moved from the GCF to the bilateral portion of the market as JPMorgan prepared to exit its government securities settlement services.
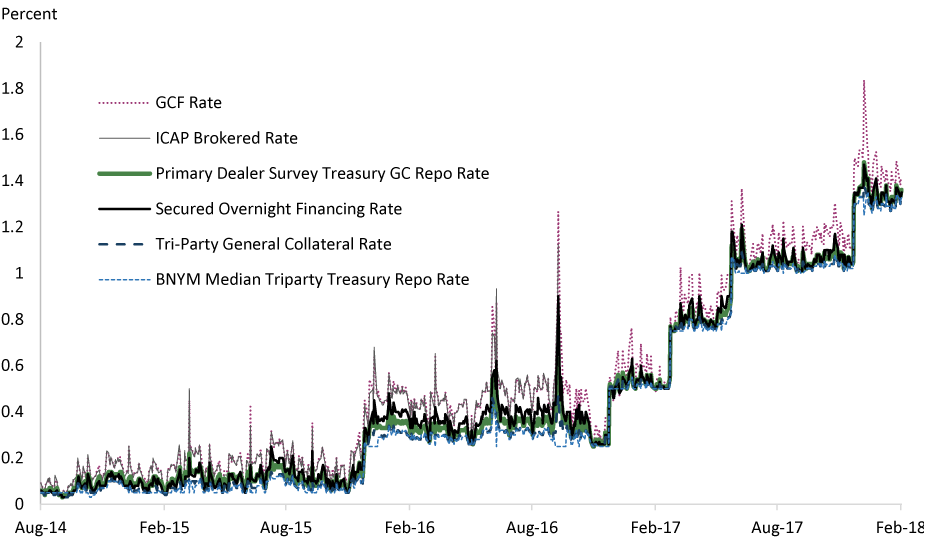
Over the past several years, inter-dealer transactions have tended to be at higher rates, associated with the higher balance sheet cost of repo transactions following post-crisis reforms. Thus, as shown in Figure 1, DTCC's GCF rate (which is based on inter-dealer GCF transactions) or a similar series produced by ICAP (based on brokered repo transactions and quantitatively very similar to the GCF rate) are generally higher than available measures of tri-party ex GCF rates (the Tri-party General Collateral rate produced by FRBNY or a separately produced tri-party rate published by Bank of New York Mellon (BNYM), the BNY Mellon Treasury Tri-Party Repo Index).6 7 Because SOFR is not purely an inter-dealer rate but does include a sizeable proportion of inter-dealer trades, it has tended to be higher than either of the tri-party ex GCF rates but below the GCF and ICAP rates. The historical primary dealer survey rate that FRBNY has released includes both dealer-to-customer and inter-dealer tri-party trades reported by primary dealers, and so likewise tends to lie between the tri-party ex GCF rates and the GCF and ICAP rates. Because SOFR includes both GCF and bilateral trades, it has a higher proportion of interdealer trades and tends to trade close to or a bit above the survey rate.
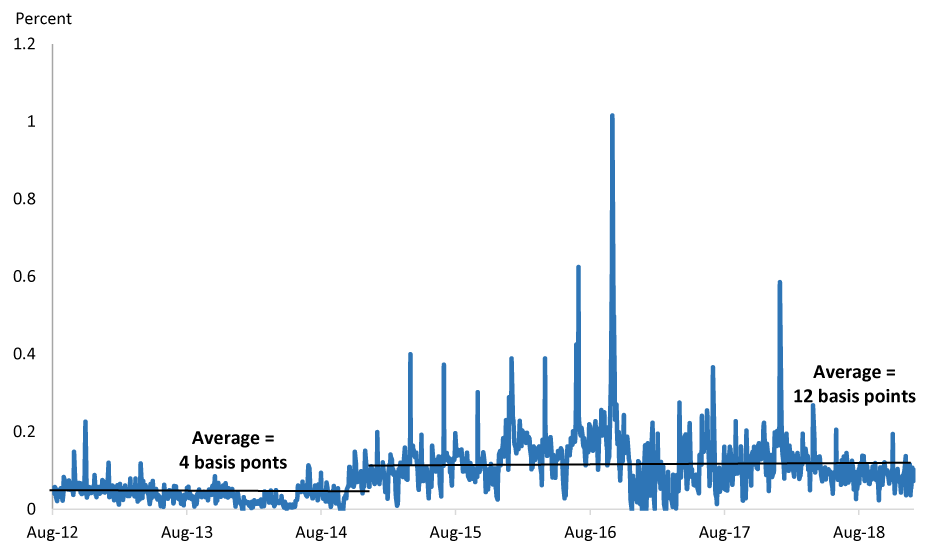
However, as can also be seen, the differences between all of these rates were smaller prior to 2015. Interdealer spreads widened as post-crisis regulations were implemented and became binding, but prior to that time, those spreads were narrower. Figure 2 plots the spread between the GCF and BNYM repo series going back to 2012 (the starting point of the BNYM series), and shows that spreads were clearly lower prior to 2015. Similarly the spread between the GCF rate and the survey rate was notably lower before 2015 as well (Table 1). If we go back before 2009 using the ICAP brokered rate rather than the GCF rate, the spread was lower still, averaging only 2 basis points.
Table 1: Average Differences between Repo Rates (Basis Points)
| GCF - BNYM Spread | GCF - P.D. Survey Spread | ICAP - P.D. Survey Spread | |
|---|---|---|---|
| Jan 2015 - Dec 2018 | 12 | 8 | 9 |
| Aug 2012 - Dec 2014 | 4 | 3 | 3 |
| Nov 2009 - July 2012 | --- | 2 | 2 |
| Aug 2004 - Oct 2009 | 2 |
Note: Primary Dealer Survey data is only available through February 2018.
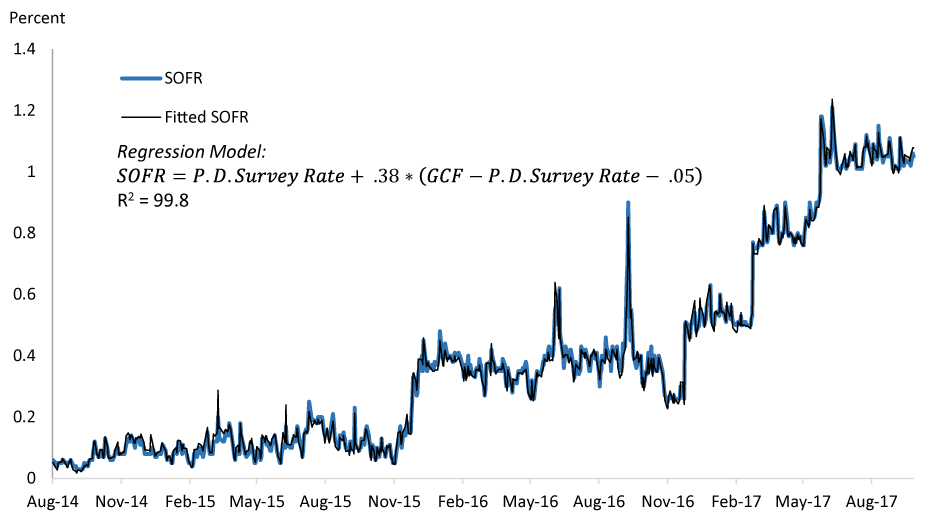
The historical behavior of the spread between inter-dealer and more general repo rates matters because it appears to be a main determinant (or at least highly correlated with the determinants) of the difference between SOFR and the survey rate. In fact, SOFR can be very closely modeled by the following simple regression
Despite its simplicity, this regression has an R2 of 99.8 percent (Figure 3).
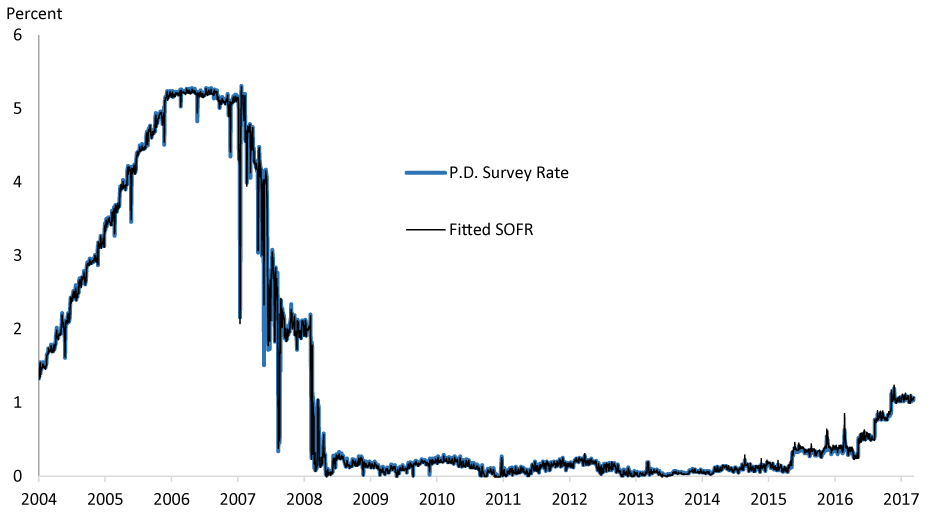
Using this regression, one can model a fitted SOFR for the longer history, which is shown in Figure 4. With smaller differences between interdealer rates and dealer-to-customer rates prior to 2015, the repo market was more homogeneous, and SOFR was quite close to the survey rate. The fitted SOFR is in fact extraordinarily close to the survey rate, which argues that the survey rate should be considered as a reasonable proxy for a longer history of SOFR. There is no way to know for sure how SOFR would have behaved historically, but it appears that the survey is likely to be fairly close given the greater homogeneity of repo markets before 2015. It should certainly be close enough to be a reasonable proxy for risk modeling or other purposes, especially given that historical data always has limitations for forward-looking modeling--even if we had a longer series for SOFR itself, there would be no guarantee that SOFR would behave in exactly the same way going forward as it has in the past.
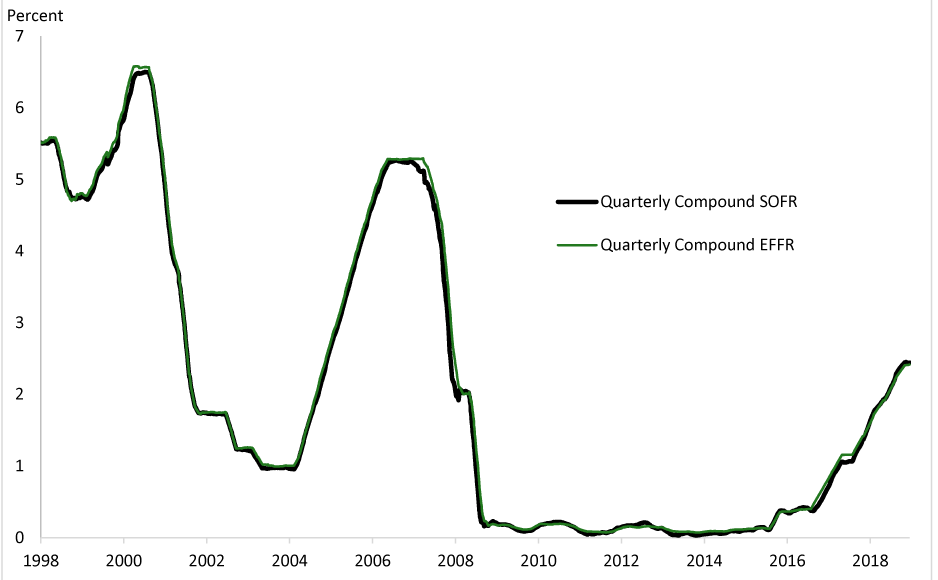
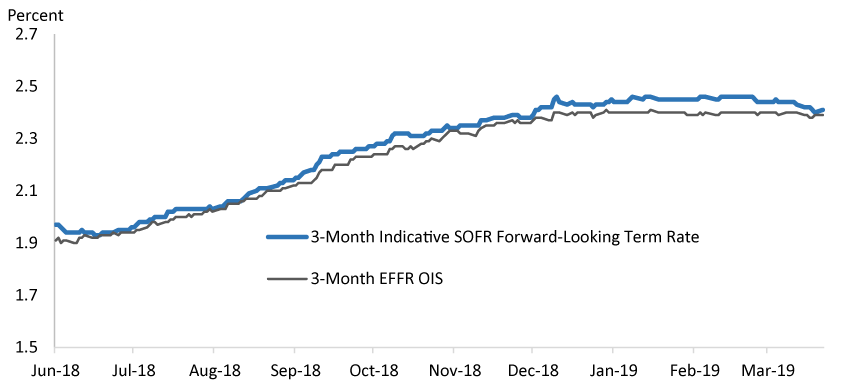
Using this longer historical series, we can gain a greater understanding as to how a rate like SOFR should be expected to behave. As shown in Figure 5, a compound average of the SOFR/P.D. Survey rate has tended to be very close to a compound average of the effective federal funds rate (EFFR), the rate that the Federal Reserve bases its policy target on. Thus, despite the fact that it is a secured rate and has some day-to-day fluctuations, SOFR should be expected to move very closely with Federal Reserve policy and very closely with overnight unsecured rates like EFFR over time. Similarly, the indicative forward-looking term SOFR rates produced by Heitfield and Park (2019) are very close to EFFR OIS rates (Figure 6).8 Over the period shown, SOFR term rate was 3.2 basis points above the EFFR OIS rate, which is very close to the 2.8 basis point difference between compound SOFR and compound EFFR during the same time. Thus, based on the historical data, it seems reasonable to model SOFR OIS rates as likely to be very close to EFFR OIS rates.
Source: Bank of New York Mellon; Bloomberg; DTCC Solutions LLC, an affiliate of The Depository Trust & Clearing Corporation; Federal Reserve Bank of New York.
Source: Bank of New York Mellon; DTCC Solutions LLC, an affiliate of The Depository Trust & Clearing Corporation.
Source: Author's calculations using data data from DTCC Solutions LLC, an affiliate of The Depository Trust & Clearing Corporation, and the Federal Reserve Bank of New York.
Source: Author's calculations using Federal Reserve Bank of New York data.
Source: FRBNY; Federal Reserve Board staff calculations.
Source: Bloomberg; Heitfield and Park (2019).
1. SOFR and other repo reference rates published by FRBNY exclude repo transactions with the Federal Reserve. Additional information on SOFR can be found at www.newyorkfed.org/markets/treasury-repo-reference-rates-information Return to text
2. FRBNY also began publication of two other repo reference rates at this time: the Broad General Collateral Rate (BGCR) is based on transactions in the tri-party repo market from Bank of New York Mellon, including GCF Repo transactions, while the Tri-party General Collateral Rate (TGCR) excludes GCF repo transactions. Both rates exclude bilateral repo transactions. Return to text
3. JPMorgan Chase had previously offered similar infrastructure but announced on July 21, 2016 that it would end its business as a clearing bank for broker-dealer government security services by the end of 2018. Return to text
4. If particular securities are in high demand in the bilateral repo market, then they may trade "special" with much lower rates than other Treasury repo transactions. FRBNY deals with this by filtering the lower quartile of all bilateral trades in its calculation of SOFR. Return to text
5. Further information can be found in see Bowman, Louria, McCormick, and Styczynski (2017), The Cleared Bilateral Repo Market and Proposed Repo Benchmark Rates, February 27, 2017. Return to text
6. Neither DTCC Solutions LLC nor any of its affiliates shall be responsible for any errors or omissions in any DTCC data included in this publication, regardless of the cause and, in no event, shall DTCC or any of its affiliates be liable for any direct, indirect, special or consequential damages, costs, expenses, legal fees, or losses (including lost income or lost profit, trading loses and opportunity costs) in connection with this publication. Return to text
7. BNY Mellon Tri-Party Repo Indices, the data contained therein and any related trademarks and service marks are the sole and exclusive property of The Bank of New York Mellon (the "Company") and its suppliers. The information and data appearing on this site regarding BNY Mellon Tri-Party Repo Indices is for internal use only by the recipient, and may not be modified, copied, redistributed, retransmitted, reproduced, published, or otherwise used in whole or in part for any purpose without the Company's prior written consent. THE COMPANY AND ITS AFFILIATES MAKE NO EXPRESS OR IMPLIED WARRANTIES, AND EXPRESSLY DISCLAIM, ALL WARRANTIES OF ACCURACY, TIMELINESS, COMPLETENESS, NON-INFRINGEMENT MERCHANTABILITY AND FITNESS FOR A PARTICULAR PURPOSE OR USE WITH RESPECT TO THE BNY MELLON TRI-PARTY REPO INDICES AND ANY INFORMATION, DATA OR MATERIALS INCLUDED THEREIN OR FOR ANY DELAYS OR INTERRUPTIONS IN PROVIDING THE BNY MELLON TRI-PARTY REPO INDICES OR ANY DATA INCLUDED THEREIN. WITHOUT LIMITING ANY OF THE FOREGOING, IN NO EVENT SHALL THE COMPANY OR ANY OF ITS AFFILIATES HAVE ANY LIABILITY FOR DIRECT, INDIRECT, SPECIAL, PUNITIVE, OR CONSEQUENTIAL DAMAGES (INCLUDING LOST PROFITS), EVEN IF NOTIFIED OF THE POSSIBILITY OF SUCH DAMAGES AND REGARDLESS OF THE FORM OF ACTION. The information appearing on this site is presented as general information and not in connection with any sale or offer to sell, or solicitation of an offer to buy, securities or other financial instruments. Any decisions regarding any use of the information included in this site, including but not limited to any transaction or trading decisions based on such information, are the sole and exclusive responsibility of the recipient and the Company shall incur no liability whatsoever in connection therewith. Neither the Company nor any of its subsidiaries or affiliates is acting as an advisor or fiduciary by providing information contained in this site. Return to text
8. Heitfield and Park (2019) Indicative Forward-Looking SOFR Term Rates April 19, 2019. Return to text
Bowman, David (2019). "Historical Proxies for the Secured Overnight Financing Rate," FEDS Notes. Washington: Board of Governors of the Federal Reserve System, July 15, 2019, https://doi.org/10.17016/2380-7172.2386.
Disclaimer: FEDS Notes are articles in which Board staff offer their own views and present analysis on a range of topics in economics and finance. These articles are shorter and less technically oriented than FEDS Working Papers and IFDP papers.