FEDS Notes
December 03, 2020
Interest Coverage Ratios: Assessing Vulnerabilities in Nonfinancial Corporate Credit1
Jack McCoy, Francisco Palomino, Ander Perez-Orive, Charles Press, and Gerardo Sanz-Maldonado
Summary
This note introduces a methodology to assess whether the ability of nonfinancial corporations to meet their interest expenses out of earnings can be a source of financial vulnerability. We measure this ability using the interest coverage ratio (ICR)—the ratio of earnings before interest and taxes relative to interest expenses—and propose a strategy to project an aggregate ICR index for the U.S. corporate sector under alternative economic scenarios. The projected evolution of the ICR index serves as a vulnerability indicator as lower ratios are associated with higher probabilities of default and financial distress. Our average index reading can be updated on a quarterly basis and adapted to generate projections under a variety of economic scenarios.
To illustrate our methodology, we describe an application that uses the economic conditions prevailing in June 2020. We start with information on corporate earnings and on the composition of the U.S. nonfinancial public corporate stock of debt by instrument type (bond or loan), credit category (investment- or speculative-grade), and maturity. Our application considers several scenarios for the period from the second quarter of 2020 to the end of 2022. These scenarios project the evolution of corporate earnings, bond and loan spreads, corporate debt growth, and bond downgrades, among other macroeconomic and financial variables.2 For macroeconomic conditions, starting from Blue Chip forecasts and Comprehensive Capital Analysis and Review scenarios, we construct a baseline scenario in which economic activity recovers and financial strains subside in the second half of 2020, and a significantly more unfavorable (tail) scenario with a stronger and longer recession followed by a slower recovery.
In our illustrative application, the aggregate interest coverage ratio for corporate borrowers remains healthy in the baseline scenario, but deteriorates substantially in the tail scenario. The COVID-19 outbreak started in a generally favorable corporate credit environment characterized by low interest expenses and high earnings, despite historically elevated leverage. In the baseline scenario, the recession and financial distress are short-lived, and only a small fraction of corporate debt has to be refinanced during the period of high spreads. In contrast, under the tail scenario, the persistence of the recession, the significant drop in earnings, and the rise in borrowing costs imply a decline in interest coverage ratios to levels close to their historical lows since 1980. In addition, projections of higher debt growth imply a moderate additional deterioration in interest coverage ratios, while projections of bond credit-rating downgrades have a small impact on these ratios as the downgraded fixed-coupon investment-grade bonds have long maturities, on average.
Finally, we suggest how to use the information contained in the dispersion of interest coverage ratios across firms to detect additional, firm-level vulnerabilities using quantile regressions. Although the distribution of the ICR ratios had shifted to the left as of June 2020, pointing to higher vulnerability, our alternative scenarios suggest that ICRs of more vulnerable firms in the left tail of the distribution evolve roughly in line with changes in the projected aggregate ICR index. This result supports the use of our aggregate ICR index as a key indicator of corporate debt vulnerabilities.
Nonfinancial corporate debt market and balance sheet overview
At the end of the first quarter of 2020, public nonfinancial corporations headquartered in the United States had a total of $6.9 trillion in bonds and loans outstanding (Table 1).3 Corporate loans make up about 21 percent of this total ($1.4 trillion) and corporate bonds make up about 79 percent ($5.5 trillion).4 In the corporate bond market, investment-grade (IG) bonds make up about four-fifths of the market ($4.2 trillion) and speculative-grade (high yield, HY) bonds make up about 20 percent of the market ($1.1 trillion). The share of investment grade bonds rated BBB—the lowest credit rating in this category—is 48.5 percent, while the share of high-yield bonds rated deep junk is 21.6 percent.
Table 1. Breakdown of Aggregate Debt of Publicly Listed Nonfinancial Corporations
| ($ millions) | Outstanding as of 3/31/2020 |
|---|---|
| Total Debt of Public Nonfinancial Corporations | 6,915,222 |
| Corporate Bonds | 5,466,724 |
| Investment Grade | 4,187,511 |
| Rated A and above | 2,156,568 |
| Rated BBB | 2,030,943 |
| High Yield | 1,066,011 |
| Rated B2 or higher | 835,753 |
| Rated deep junk (B3 or lower) | 230,258 |
| Unrated | 213,202 |
| Bank Loans | 1,448,498 |
Source: Mergent Inc., Mergent Corporate FISD Daily Feed (FITF); Board of Governors of the Federal Reserve System, FR Y-14 and Statistical Release Z.1, ”Financial Accounts of the United States”; S&P Global, Compustat and Capital IQ.
Bonds with maturities between 2020 and 2022 account for around 22 percent and 20 percent of the total amount outstanding of IG and HY bonds, respectively (Figure 1). In contrast, most corporate loans outstanding, which include term loans and lines of credit, have significantly shorter maturities; loans with maturities between 2020 and 2022 account for around 56 percent of the total loans outstanding.5
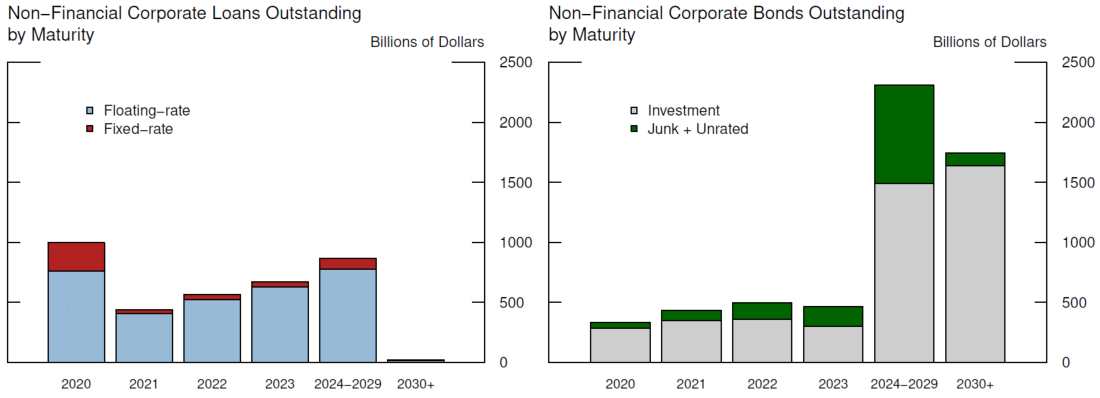
(Left Figure) Source: Board of Governors of the Federal Reserve System, FR Y-14 and Statistical Release Z.1, “Financial Accounts of the United States”; Refinitiv, Dealscan.
(Right Figure) Source: Mergent Inc., Mergent Corporate FISD Daily Feed (FITF); Refinitiv, Dealscan.
Table 2 displays the distribution of some relevant balance sheet variables for the nonfinancial corporate sector using 2020Q1 data. Median earnings before interest and taxes (EBIT) and median free cash flows relative to total assets are between 0 and 2 percent.6 A significant fraction of firms, in excess of 25 percent, has negative EBIT or negative free cash flows. Median values for leverage, expressed as total debt over assets, and credit line availability, expressed as total undrawn lines of credit over assets, stand at 0.29 and 0.10, respectively. The interest coverage ratio, computed as the ratio of EBIT relative to interest expenses, has substantial variation in the sample, with a median of 1.59 and an interquartile range (75 percentile to 25 percentile) of 5.78. For the median firm, only around 4 percent of debt matures within a year, and the median share of bonds relative to total debt is about 69 percent.
Projections of Aggregate Interest Rate Coverage Ratios under Different Scenarios
Lower interest coverage ratios may signal increased vulnerabilities in the nonfinancial corporate sector as a lower ability to meet interest payments using internal cash flows tends to be associated with higher probabilities of default and financial distress. Interest coverage ratios may decrease because of reduced earnings, increased debt, or higher interest rates. We project these variables under two different economic scenarios—a baseline scenario, and a more adverse one (tail) scenario—to obtain quarterly projections from 2020 to 2022 for the interest coverage ratio for the public nonfinancial corporate sector.
Table 2. Breakdown of Aggregate Debt of Publicly Listed Nonfinancial Corporations7
| Profitability (quarterly) | Indebtedness and Access to Credit | Subsample: Leverage>0.05 & Interest > $0.5 mill. | |||||
|---|---|---|---|---|---|---|---|
| EBIT /Assets | Free Cash Flow /Assets | Total Debt/ Assets | Undrawn Credit Lines/ Assets | ICR (=EBIT/ interest expense) | Share of Debt Maturing within year | Bonds /Total Debt | |
| 10th percentile | -0.13 | -0.12 | 0.01 | 0 | <0 | 0.20% | 0.00% |
| 25th percentile | -0.04 | -0.02 | 0.1 | 0.05 | 0 | 1.50% | 0.00% |
| Median | 0 | 0.02 | 0.29 | 0.1 | 1.59 | 3.90% | 68.50% |
| 75th percentile | 0.02 | 0.04 | 0.48 | 0.16 | 5.78 | 9.30% | 100.00% |
| 90th percentile | 0.03 | 0.08 | 0.67 | 0.23 | 13.38 | 21.90% | 100.00% |
| Count | 2,929 | 2,929 | 2,929 | 2,888 | 1,677 | 1,677 | 1,646 |
Source: S&P Global, Compustat and Capital IQ.
Table 3 shows the quarterly evolution of relevant macroeconomic and financial variables under the baseline scenario (Panel A) and the tail scenario (Panel B) from 2020Q2 to 2022Q4. To construct the scenarios, we rely on the June 2020 Blue Chip Analysts' forecasts of economic and financial indicators and the Comprehensive Capital Analysis and Review (CCAR) stress-test summary released in February 2020.8 The 2020Q2 to 2021Q4 projections for GDP growth, the 3-month T-Bill rate, and the 10-year Treasury yield for the baseline and tail scenarios are the corresponding Blue Chip consensus and bottom-10 average forecasts, respectively. To extend the quarterly projections until 2022Q4 for the baseline and tail scenarios, we use the CCAR baseline and severely adverse scenarios, respectively, adjusted to incorporate the information in the June Blue Chip survey.9 Similarly, the projections for the BBB corporate bond yield and the loan (prime) rate in the baseline scenario are obtained from the Blue Chip consensus forecast and the CCAR baseline scenario. For the tail scenario, the BBB corporate bond yield is the 10-year Treasury yield plus the spread between these two yields in the CCAR severely adverse scenario for the corresponding quarter, and the loan rate is the 3-month T-Bill rate plus the spread between these two rates in the CCAR severely adverse scenario for the corresponding quarter. The projected speculative-grade bond yields in both scenarios are the 3-month T-Bill plus a spread. This spread is the corresponding spread for a percentile in its historical distribution that is equal to the percentile implied by the forecasted spread between BBB yields and the 3-month T-Bill rate. Since the Blue Chip survey and the CCAR summary do not provide scenarios for earnings growth, we rely on the average historical relationship between earnings growth and GDP growth to construct earnings growth projections. For both scenarios, we construct values for debt growth, debt downgraded from investment grade to speculative grade, and speculative-grade bond yields. Debt growth and downgraded debt values are obtained from the respective average historical relations between these variables and GDP growth.10
In the baseline scenario, there is a drastic decline in economic activity in the second quarter of 2020 accompanied by historically low 3-month T-bill rates and 10-year Treasury yields and wide spreads in loan rates and corporate bond yields. Starting in the second half of 2020, there is a gradual and sustained economic recovery, amid low interest rates and declining bond spreads. In contrast, in the tail scenario, the economic recovery is significantly slower, interest rates are lower, spreads remain wider for a longer time, and the fraction of debt downgraded to speculative grade is larger.
To construct the evolution of interest coverage ratios under the two scenarios, we start with information on current earnings, and the current composition of debt by instrument type (bond or loan), credit category (investment- or speculative-grade), and maturity. We break down all debt into investment-grade bonds, speculative-grade bonds, and loans, and estimate, as described in Section 2, the amounts outstanding as of March 31, 2020 as well as maturities for each bond or loan. The bond data are from the Mergent Fixed Income Securities Database (FISD), the loan data are from the Y-14 and the STBL survey, and the composition of bonds and loans in the sample of public firms is taken from Capital IQ.
Projected earnings for each quarter are constructed by multiplying earnings by the cumulative (gross) earnings growth up to that quarter under each scenario. Projected interest expenses depend on projections of debt growth, debt downgrades, and interest rates. We assume that all outstanding debt—adjusted by debt growth and downgrades—is rolled over at maturity into the same debt type (investment- or speculative grade bonds, or loans), at interest rates prevailing at maturity for its debt type and credit category, with a new maturity equal to the weighted average maturity for its debt type and credit category as of March 31, 2020.
Table 3: Scenarios for Economic and Financial Conditions
PANEL A: BASELINE SCENARIO
| Growth rate of nominal debt outstanding (quarterly) | |||||||||||||
|---|---|---|---|---|---|---|---|---|---|---|---|---|---|
| Quarter | Real GDP growth | CPI inflation rate | Nominal profit growth | IG Bonds | HY Bonds | Loans | IG Bonds Downgraded (Cumulative) | Syndicated Loans Downgraded (Cumulative) | 3-month T-bill | 10-year UST rate | BBB yield | HY yield | Loan Rate |
| 2020 Q1 | -6.1 | 1.3 | -13.4 | 4.7 | 11.7 | 21.6 | 0 | 0 | 0.1 | 1.4 | 3.5 | 5.5 | 4.5 |
| 2020 Q2 | -35.7 | -3.3 | -76.2 | 6.5 | 0.9 | 16.2 | 5.6 | 5.6 | 0.1 | 0.7 | 4 | 6.1 | 3.3 |
| 2020 Q3 | 17.2 | 1.7 | 32.8 | 1.2 | 1.2 | 0.9 | 3.9 | 3.9 | 0.1 | 0.8 | 4 | 6.1 | 3.3 |
| 2020 Q4 | 8.6 | 1.9 | 16.2 | 1.2 | 1.2 | 0.9 | 3.5 | 3.5 | 0.1 | 0.9 | 4 | 6.1 | 3.3 |
| 2021 Q1 | 6.5 | 2 | 12 | 1.2 | 1.2 | 0.9 | 3.4 | 3.4 | 0.2 | 1 | 4.2 | 6.2 | 3.3 |
| 2021 Q2 | 5.1 | 2.1 | 9.6 | 1.2 | 1.2 | 0.9 | 3.5 | 3.5 | 0.2 | 1.1 | 4.2 | 6.2 | 3.3 |
| 2021 Q3 | 4.2 | 2.1 | 7.8 | 1.2 | 1.2 | 0.9 | 3.7 | 3.7 | 0.2 | 1.2 | 4.3 | 6.3 | 3.4 |
| 2021 Q4 | 3.6 | 2.1 | 6.6 | 1.2 | 1.2 | 0.9 | 4 | 4 | 0.2 | 1.3 | 4.3 | 6.3 | 3.4 |
| 2022 Q1 | 3.6 | 2.3 | 6.6 | 1.2 | 1.2 | 0.9 | 4.2 | 4.2 | 0.3 | 1.3 | 4.4 | 6.4 | 3.5 |
| 2022 Q2 | 3.6 | 2.2 | 6.4 | 1.2 | 1.2 | 0.9 | 4.5 | 4.5 | 0.3 | 1.5 | 4.5 | 6.5 | 3.5 |
| 2022 Q3 | 3.6 | 2.2 | 6.4 | 1.2 | 1.2 | 0.9 | 4.8 | 4.8 | 0.4 | 1.6 | 4.7 | 6.8 | 3.6 |
| 2022 Q4 | 3.6 | 2.2 | 6.4 | 1.2 | 1.2 | 0.9 | 5.1 | 5.1 | 0.4 | 1.7 | 4.8 | 6.9 | 3.6 |
Note: all numbers are reported in percentage terms.
PANEL B: TAIL SCENARIO
| Growth rate of nominal debt outstanding (quarterly) | |||||||||||||
|---|---|---|---|---|---|---|---|---|---|---|---|---|---|
| Quarter | Real GDP growth | CPI inflation rate | Nominal profit growth | IG Bonds | HY Bonds | Loans | IG Bonds Downgraded (Cumulative) | Syndicated Loans Downgraded (Cumulative) | 3-month T-bill | 10-year UST rate | BBB yield | HY yield | Loan Rate |
| 2020 Q1 | -6.1 | 1.3 | -13.4 | 4.7 | 11.7 | 21.6 | 0 | 0 | 0.1 | 1.4 | 3.5 | 5.5 | 4.5 |
| 2020 Q2 | -41.6 | -5 | -87.2 | 6.5 | 0.9 | 16.2 | 6.4 | 6.4 | 0 | 0.6 | 6 | 9.1 | 3.3 |
| 2020 Q3 | 3.6 | -0.1 | 3.2 | 1.2 | 1.2 | 0.9 | 6.7 | 6.7 | 0.1 | 0.6 | 6.5 | 9.7 | 3.3 |
| 2020 Q4 | 2 | 0.3 | 0 | 1.2 | 1.2 | 0.9 | 7.2 | 7.2 | 0.1 | 0.7 | 6.6 | 10 | 3.3 |
| 2021 Q1 | 2.9 | 0.9 | 1.8 | 1.2 | 1.2 | 0.9 | 7.6 | 7.6 | 0.1 | 0.7 | 6.2 | 9.4 | 3.3 |
| 2021 Q2 | 2.4 | 1.2 | 0.8 | 1.2 | 1.2 | 0.9 | 8.1 | 8.1 | 0.1 | 0.8 | 5.9 | 8.7 | 3.3 |
| 2021 Q3 | 2 | 1.1 | 0 | 1.2 | 1.2 | 0.9 | 8.6 | 8.6 | 0.1 | 0.8 | 5.6 | 8.3 | 3.3 |
| 2021 Q4 | 2 | 1.3 | 0 | 1.2 | 1.2 | 0.9 | 9.1 | 9.1 | 0.1 | 0.8 | 5.2 | 7.6 | 3.2 |
| 2022 Q1 | 2.8 | 1.4 | 1.6 | 1.2 | 1.2 | 0.9 | 9.6 | 9.6 | 0.1 | 0.9 | 4.9 | 7.2 | 3.2 |
| 2022 Q2 | 3.3 | 1.4 | 2.6 | 1.2 | 1.2 | 0.9 | 9.9 | 9.9 | 0.1 | 1.1 | 4.6 | 6.7 | 3.2 |
| 2022 Q3 | 3.6 | 1.4 | 3.2 | 1.2 | 1.2 | 0.9 | 10.2 | 10.2 | 0.1 | 1.2 | 4.4 | 6.5 | 3.2 |
| 2022 Q4 | 3.8 | 1.4 | 3.6 | 1.2 | 1.2 | 0.9 | 10.5 | 10.5 | 0.1 | 1.4 | 4.1 | 6.1 | 3.2 |
Note: all numbers are reported in percentage terms.
Figures 2 and 3 show the interest coverage rate projections in our baseline and tail scenarios, respectively. The historical series reflects comfortably high interest coverage ratios before the COVID-19 outbreak as corporate credit conditions were generally favorable, with low interest expenses and high earnings despite historically elevated leverage. In our baseline scenario (Figure 2), the interest coverage ratio declines sharply from 5.8 in 2019 to 4.8 in 2020Q1 and 3.4 in 2020Q2—mostly as a result of a notable decline in earnings—but quickly recovers to stabilize at levels around 4 thereafter. Because of the short duration of the recession in this scenario, the majority of corporate debt does not need to be refinanced during the period of high spreads, keeping interest expenses contained. In contrast, in the tail scenario (Figure 3) the burden for corporate borrowers from aggregate interest expenses relative to earnings is projected to deteriorate significantly. The interest coverage ratio declines notably throughout the forecast horizon from 5.8 in 2019 to 2.9 in 2020Q4 and 2.7 in 2021Q4, reaching levels close to its historical lows since 1980. The persistence of the recession implies that a larger fraction of corporate debt will mature and have to be refinanced at significantly higher spreads, while, at the same time, earnings continue to be considerably depressed.
Figure 2. Aggregate Interest Rate Coverage Ratio: Bond Downgrades and Debt Growth under the Baseline Scenario
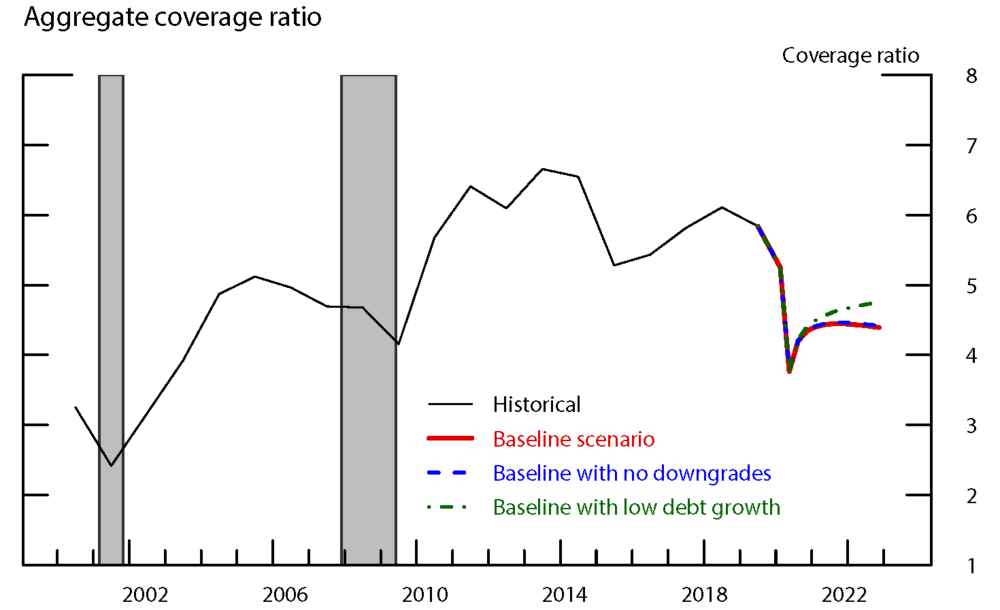
The shaded bars indicate periods of business recession as defined by the National Bureau of Economic Research: March 2001–November 2001 and December 2007–June 2009.
Note: Interest rate coverage ratio is measured as the ratio of earnings before interest and taxes (EBIT) to interest expense.
To understand the impact on interest coverage ratios of debt growth and debt downgrades in both scenarios, we also compute the evolution of interest coverage ratios under the assumption of lower debt growth, and, separately, under the assumption of no debt downgrades. Figure 2 shows the projected evolution of the corporate interest rate coverage ratio in the baseline scenario under the assumptions of no growth in corporate debt and no debt downgrades from investment-grade to speculative grade. A comparison of interest coverage ratios in the baseline scenario and in the absence of debt downgrades reveals a minor effect of downgrades on these ratios as the fraction of downgraded debt refinancing at higher rates is small given the rapid recovery and the long average maturity of investment grade bonds. The effect of bonds downgraded to speculative grade is muted as the downgrades do not impact a firm unless it needs to refinance its debt (or issue new debt), while investment-grade bonds have very long average maturities. The figure also shows that interest coverage ratios under lower debt growth are moderately higher than in the baseline scenario as a result of lower interest expenses, as all new debt is issued at the prevailing rates, which are projected to be high.
Figure 3 shows a similar pattern for the effect of lower debt growth and no downgrades under the tail scenario. Higher debt growth or bond downgrades do not have a considerable effect on these ratios, although the relative effect is somewhat larger. The higher spreads under the tail scenario mean that the negative effects of having to issue new debt, or to refinance downgraded debt, are stronger.
Figure 3. Aggregate Interest Rate Coverage Ratio: Bond Downgrades and Debt Growth under the Tail Scenario
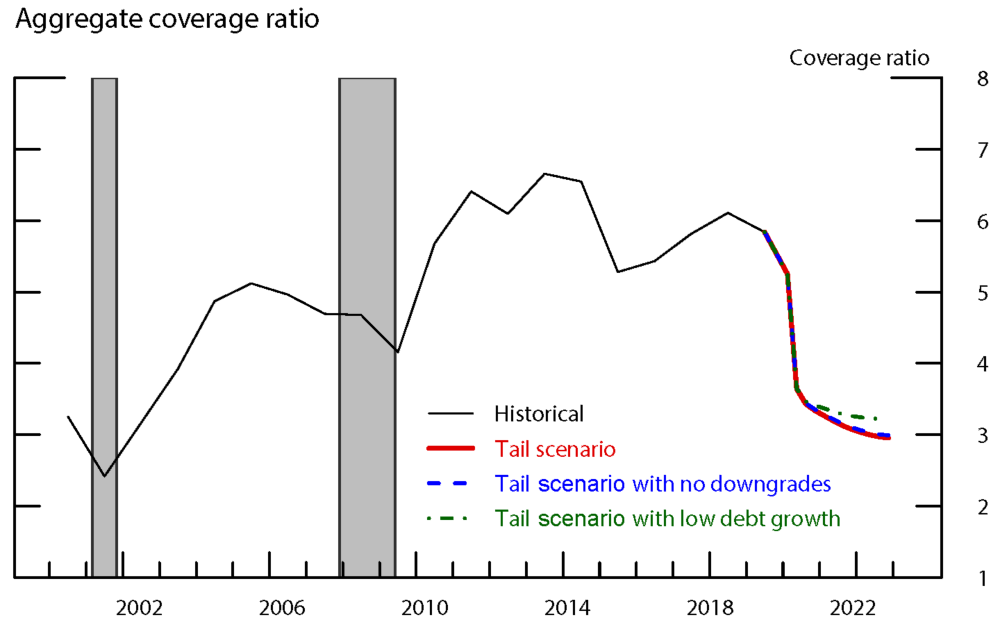
The shaded bars indicate periods of business recession as defined by the National Bureau of Economic Research: March 2001–November 2001 and December 2007–June 2009.
Note: Interest rate coverage ratio is measured as the ratio of earnings before interest and taxes (EBIT) to interest expense.
The Distribution of Interest Coverage Ratios Across Firms
To complement the aggregate-level analysis, we study recent shifts in the distribution of interest coverage ratios and use quantile regressions to project the evolution of the tails of the distribution.
Figure 4 provides a comparison of the distribution of debt-weighted interest coverage ratios in 2019Q1 and 2020Q1. Interest coverage ratios at the firm level are computed as the ratio of four-quarter EBIT to four-quarter interest expenses, to smooth out the seasonality in firms earnings cycles, and are multiplied by the weight of the firm debt over total debt in the nonfinancial business sector.11 The figure shows that the distribution of debt-weighted interest coverage ratios is skewed to the left, with a substantial fraction of debt associated with interest coverage ratios below 5, and a non-negligible fraction of debt associated with significantly higher ratios. This distribution shifted to the left between 2019Q1 and 2020Q1, reflecting that a larger fraction of debt is characterized by lower ratios.
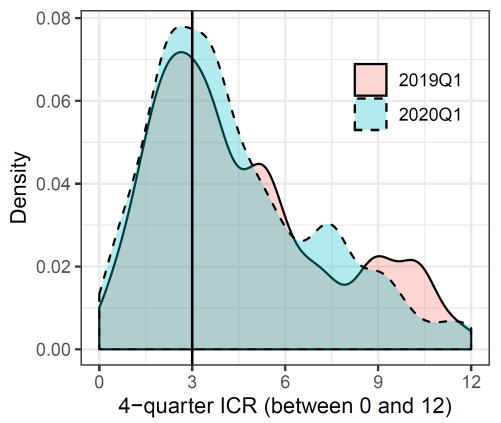
Note: The region where the two distributions intersect is depicted in teal. Source: S&P Global, Compustat and Capital IQ.
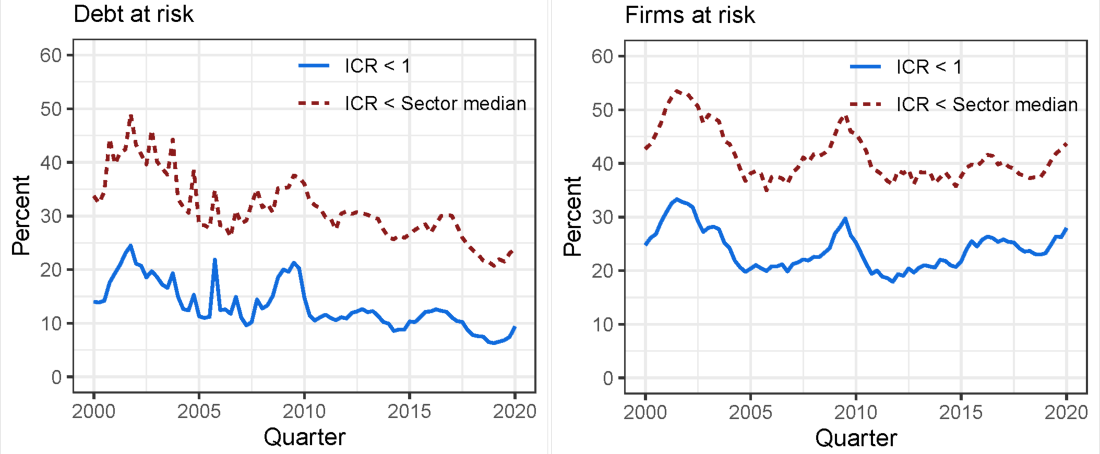
To assess vulnerabilities from these lower ratios, we calculate the fraction of firms and the fraction of debt below two meaningful interest coverage ratio thresholds. First, a simple threshold of 1, below which a firm cannot completely cover its interest expenses using earnings. Second, a sector-level threshold that is the median across firms within a sector of interest coverage ratios in loan covenants. The ratio specified in the covenant is the level below which a technical default would be triggered in the absence of renegotiation.12
Figure 5 shows that the fraction of firms and debt below the threshold of 1 are lower than the corresponding fractions below the median-sector thresholds as, on average, loan covenants specify interest coverage ratios between 2 and 3. Despite the different levels, the fractions broadly follow similar trends. While the percentage of debt below the thresholds has shown a broad secular decline, the percentage of firms below the thresholds has trended upwards since 2011. Recently, both the fraction of debt and the fraction of firms below the thresholds have increased somewhat. This pattern mostly reflects a negative impact on earnings and somewhat higher interest rates prior to 2019, which is more noticeable for smaller firms with a lower share of total debt outstanding. These findings suggest that the tails of the distribution may behave differently than the aggregate interest coverage ratio.
To further explore how the tails of the distribution evolve in response to macroeconomic conditions, we perform a quantile regression analysis. We study whether the left tail of the distribution has been systematically more sensitive to shocks and business cycle fluctuations than the rest of the distribution.
To obtain the quantile forecasts, we model each quantile $$\tau$$ as a linear function of a set of contemporaneous and lagged predictors:
$$$$ Q_{\tau}({ICR}_{i,t} \vert X_t, Q_{t-1}) = \alpha_{\tau} + \beta_{\tau}X_t + \beta_{\tau, Q}Q_{t-1} $$$$.
The vector $$X$$ of predictors includes 1-quarter nominal GDP growth, 1-quarter CPI inflation, the 3-month and 10-year nominal Treasury yields, a maturity-adjusted measure of BBB bond yields, as well as three lags of these five variables. The vector $$Q$$ is a one-period lag of the 10th, 25th, 50th, 75th, and 90th percentiles of the ICR distribution. The model is estimated at quarterly frequency using historical data from 1996Q4 through 2020Q1. We use the scenarios described above to generate forecasts based on the estimated relationship,
Figure 6 shows the results of the quantile estimation and scenario analysis. The left and right panels display the results for the baseline and tail scenarios, respectively, for the 25th percentile and the median of the distribution of interest coverage ratios. In both cases, the results suggest that the tails are not disproportionately affected by macroeconomic shocks compared with average dynamics for the nonfinancial corporate sector.
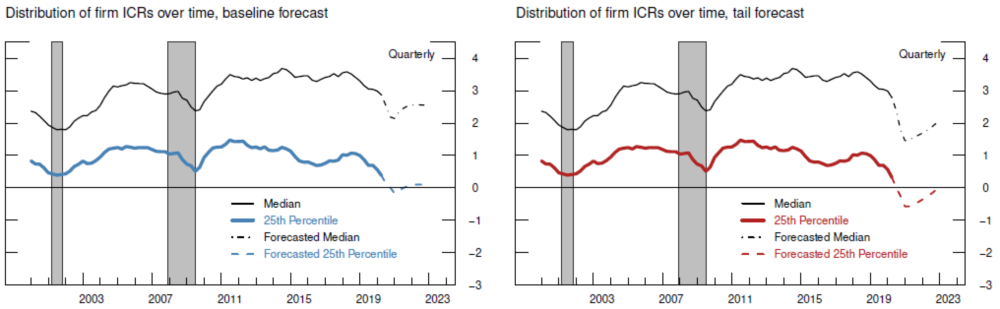
The shaded bars indicate periods of business recession as defined by the National Bureau of Economic Research: March 2001–November 2001 and December 2007–June 2009.
Conclusion
We have described a methodology that can be readily updated on a quarterly basis to examine whether the ability of nonfinancial corporations to meet their interest expenses out of earnings is a vulnerability for financial stability. In our example based on data as of June 2020, interest coverage ratios are expected to decline sharply in subsequent months along with the deterioration in economic conditions resulting from the COVID-19 pandemic. Despite this decline, our analysis suggests that the ability of the corporate sector to meet interest expenses will not be drastically affected—interest coverage ratios stabilize around a healthy level—as long as a rapid economic recovery materializes. In contrast, a slow economic recovery would produce a more notable deterioration in this ability, and may increase financial vulnerabilities in the corporate sector. This increase is mostly linked to a bleak corporate earnings outlook, as the relatively long duration and low interest rates of current debt obligations lessen the projected increase in interest expenses from debt growth and debt downgrades. Firms with low interest coverage ratios do not appear to contribute disproportionally to these vulnerabilities.
1. Authors: Jack McCoy, Francisco Palomino, Ander Perez-Orive, Charles Press, and Gerardo Sanz-Maldonado. We would like to thank Elizabeth Klee and Kirstin Hubrich for helpful comments and suggestions. The analysis and conclusions set forth are those of the authors and do not reflect the views of the Board of Governors or the Federal Reserve staff. Return to text
2. This note was developed during the second quarter of 2020 using information available at that time. Return to text
3. Given limited data availability, we ignore private firms in our analysis. Public firms, however, account for the majority of the aggregate nonfinancial corporate debt. As of 3/31/2020, total debt in public nonfinancial corporations accounted for 73% of the total debt of nonfinancial corporations ($9.5 trillion) according to the Financial Accounts of the United States - Z.1. Return to text
4. The breakdown of corporate debt of public firms into bonds and loans as of 3/31/2020 is not available at the time of writing this note. We estimate this breakdown using the latest available data from Capital IQ (as of 12/31/2019) and data on the growth rate of aggregate bonds and loans outstanding in the first quarter of 2020 obtained from the Financial Accounts of the United States - Z.1. The disaggregation of corporate bonds into their different rating categories is based on the actual distribution as of 3/31/2020 from Mergent FISD for all nonfinancial corporate bonds in the U.S. (issued by private or public firms). Return to text
5. Another important distinction between loans and bonds is that most corporate bonds pay fixed coupons, while most loans pay floating interest rates. Common reference rates for loans include LIBOR and the prime rate, both of which tend to move in tandem with the federal funds rate. Return to text
6. Free cash flow is computed as operating income before depreciation minus interest expenses minus taxes minus capital expenditures. Return to text
7. Statistics for undrawn credit lines over assets and bonds over total debt are as of 2019Q4, given the reporting lags in Capital IQ. Credit line drawdowns in the later part of the first quarter of 2020 were large and availability of undrawn credit likely dropped by the end of the quarter. Return to text
8. All Blue Chip forecasts are obtained from the June 10, 2020 Blue Chip Economic Indicators, except for forecasts for the 10-year Treasury yield and the BBB corporate bond yield, which are obtained from the June 1, 2020 Blue Chip Financial Forecasts. Return to text
9. Specifically, the forecast for any quarter after 2021Q4 is the Blue Chip forecast for 2021Q4 plus the difference between the CCAR forecast for the quarter and the CCAR forecast for 2021Q4. Return to text
10. Debt growth in 2020Q1 and 2020Q2 is as observed in the data. Starting in 2020Q3, we rely on estimates of debt growth cyclicality. In the data, the contemporaneous relationship between quarterly nominal debt growth and quarterly nominal GDP growth is mildly pro-cyclical but weak, especially for bonds. As a result, and given the relative short forecast horizon, we assume a constant debt growth starting in 2020Q3 which, in the baseline scenario, is the observed quarterly growth rate since 2000, estimated separately for bonds and loans. For downgraded debt, we take the historical relationship between downgraded debt and GDP growth from the JPMorgan article "Fallen angel risk in this crisis", North America Credit Research, March 23, 2020. Roughly, a decline of 1 percent in GDP is associated with a 2.2 percent of debt downgraded to speculative grade. Return to text
11. We filter out those firms with less than $500,000 in interest or less than 5% leverage. The distribution is shown for ICRs from zero to twelve to highlight the leftward shift in ICRs at the margin, which are hidden by the long tails in the full distribution. In 2019Q1, approximately 19% of firms had ICR < 0 and 12% of firms had ICR > 12. In 2020, approximately 23% of firms had ICR < 0 and 11% of firms had ICR > 12. Return to text
12. Balance sheet data are available from Compustat, and covenant data are available from LPC Dealscan. We take the 5-year trailing average of median firm-level interest coverage ratios in loan covenants for each quarter. We then match these data to each firm in our Compustat sample by quarter and sector. We then calculate the percentage of firms and debt below each threshold for each quarter. Return to text
McCoy, Jack, Francisco Palomino, Ander Perez-Orive, Charles Press, and Gerardo Sanz-Maldonado (2020). "Interest Coverage Ratios: Assessing Vulnerabilities in Nonfinancial Corporate Credit," FEDS Notes. Washington: Board of Governors of the Federal Reserve System, December 3, 2020, https://doi.org/10.17016/2380-7172.2779.
Disclaimer: FEDS Notes are articles in which Board staff offer their own views and present analysis on a range of topics in economics and finance. These articles are shorter and less technically oriented than FEDS Working Papers and IFDP papers.