FEDS Notes
June 17, 2022
Interest Rates Expectations and Flow Dynamics in High Yield Corporate Debt Mutual funds
Ayelen Banegas and Christopher Finch1
1. Introduction
Fixed-income mutual funds saw massive outflows during the onset of the COVID-19 crisis, with funds investing primarily in high yield debt markets experiencing the largest redemptions, as a percentage of assets. In March 2020 alone, high yield bond (HYB) and bank loan (BL) mutual fund withdrawals reached an estimated 4.1 and 13.6 percent of assets under management (AUM), accounting for close to $10.4 and $11.4 billion, respectively. Following interventions from the Federal Reserve that helped restore credit market conditions and brought U.S. interest rates back to new lows, flow dynamics of HYB and BL funds began to diverge substantially. In a context of unprecedented monetary policy accommodation, investors continued to withdraw from BL mutual funds over the subsequent months, while HYB fund outflows reversed sharply in April and reported net inflows through most of the rest of the year (Figure 1).
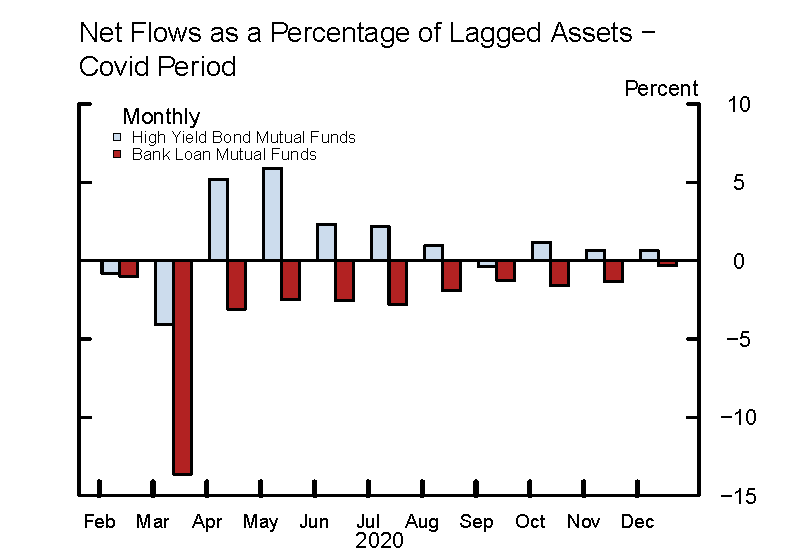
Note: Key identifies bars in order from left to right. Calculated as monthly flows divided by one month lagged assets. Covid period defined as February 2020 − December 2020.
Source: Morningstar, Inc.
The taper tantrum in the summer of 2013 also saw opposite flow dynamics for HYB and BL funds following the Federal Reserve Chairman's remarks that were interpreted as a signal the central bank would begin removing monetary policy accommodation earlier than expected. HYB mutual funds experienced heavy outflows at 4.5 percent of AUM in June of that year. In contrast, BL funds reported strong inflows, in the order of 6.2 percent of assets, highlighting the different reaction function of fund investors in these two segments of the high yield corporate debt market.
Our study is motivated by these events and the observation that, although HYB and BL funds show some common characteristics, such as the fixed-income asset class they invest in, the credit quality of their portfolios, the illiquid nature of their holdings, and the investor base, among other features, they have shown opposite investor flow dynamics in the wake of changes in the interest rate environment.2 To shed light on these observed fund flow-rates dynamics, this study evaluates the sensitivity of U.S. fund investors' allocation decisions in high yield corporate debt markets to expectations about future interest rates. More specifically, we ask whether expectations about future rates can help explain flow dynamics of mutual funds investing in U.S. HYB and BL markets during different rate environments. Our prior is that, despite some commonalities in HYB and BL funds, a difference in the coupon structure of bank loans and high yield bonds can trigger opposite flow dynamics in response to changes in interest rate expectations. Given the floating rate structure of BLs, typically defined as Libor (transitioning to SOFR) plus a fixed spread, coupon rates and associated income cashflows increase (decrease) in tandem with interest rate hikes (declines).3 Conversely, HYBs usually have fixed coupons, profiting (losing) from declining (increasing) interest rates.4
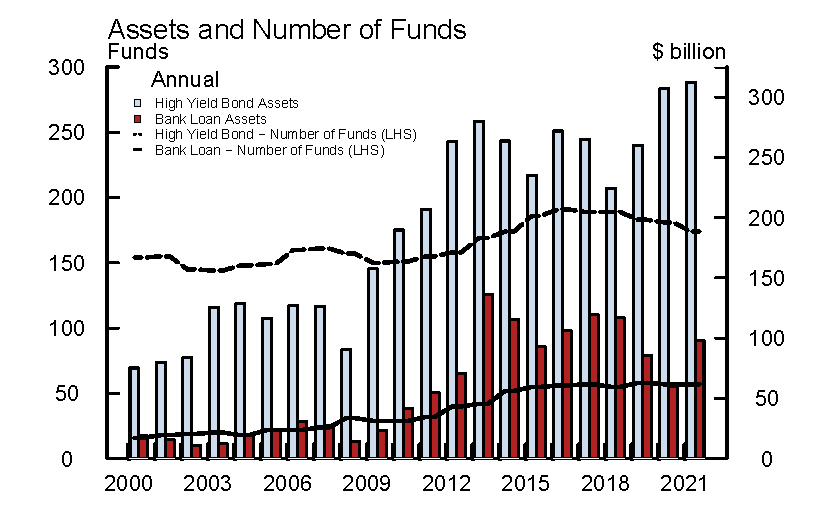
Addressing this question is of particular relevance as the Federal Reserve embarks in removing the massive policy accommodation in place since the COVID crisis, and therefore it is important to understand how non-bank financial intermediaries and investors can be expected to transition into a new, higher interest rate environment. This is especially important for mutual funds investing in less-liquid and rate-sensitive segments of credit markets, such as HYB and BL funds. In times of prolonged or acute market stress, the liquidity mismatch between their holdings and the daily withdrawals they offer to fund investors could incentivize and trigger sudden runs and asset fire sales that could eventually dislocate underlying corporate debt markets and affect overall credit conditions.5 Furthermore, with the strong growth in AUM and increased market share (i.e. Figures 2 and 3) since the Great Financial Crisis (GFC), particularly for HYB, mutual funds have become an increasingly important player in corporate debt markets. As this trend continues, we can expect that risks to credit market functioning arising from large HYB and BL fund redemptions may also increase.
Left Figure.
Note: High Yield includes unrated.
Source: Mergent, Inc. and Thomson Reuters LPC.
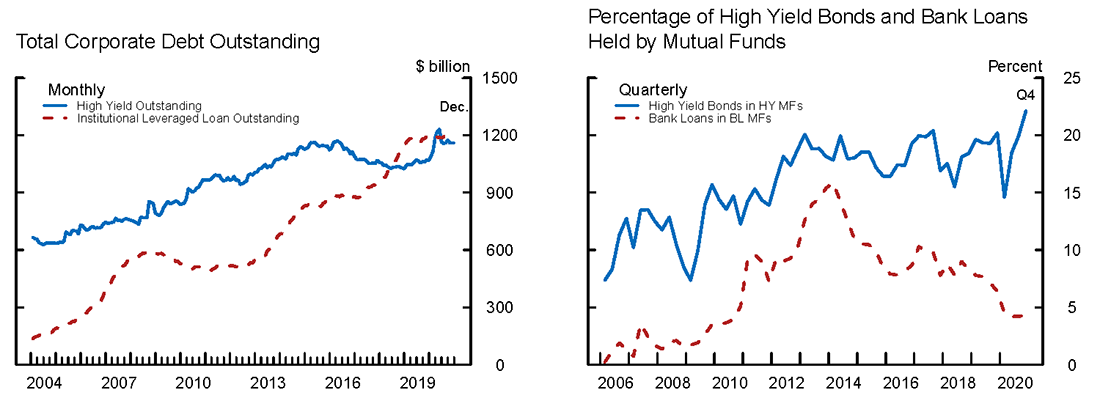
Right Figure.
Note: Ratio for HY is the assets of HY bonds held by HY MFs to HY bonds total outstanding. HY CB outstanding excludes unrated. The ratio for BL is the assets of BL held by BL MFs to institutional leveraged loan outstanding.
Source: Morningstar, Inc. and Mergent, Inc.
Several results stand out from our analysis. First, we find empirical evidence that HYB and BL fund flows show different sensitivity to changes in interest rate expectations about the policy rate (i.e. the federal funds rate), and U.S. Treasury yields, including both short- and long-term yields. While expectations of a tightening rate environment are negatively associated with outflows from HYB mutual funds, results show that as fund investors anticipate future rate hikes, they increase their allocations to BL mutual funds. We argue that this opposite rate sensitivity can be linked to the structural features of the underlying assets of HYB and BL portfolios. BLs are floating rate investments, with coupons typically defined as a variable rate (e.g. Libor, and more recently SOFR) plus a fixed spread. As a result, as interest rates rise, coupon rates also increase, benefiting floating rate BLs. In contrast, HYBs typically have fixed coupons, becoming a less attractive asset for investors in a rising interest rate environment.6 Conversely, HY bonds will benefit from declining interest rates and periods of easing monetary policy. Second, results also show that these flow-rate relations are robust to different rate environments and forecasting horizons. Moreover, results also hold for both HYB and BL mutual funds when switching from survey- to market-based interest rate expectations as proxied by one year-ahead federal funds rate OIS contracts. Finally, we investigate the effect of unexpected changes in the stance of U.S. monetary policy on fund flows. Overall, we find evidence that monetary policy surprises can have a direct effect on HYB and BL flow dynamics. In particular, and consistent with our prior, results point to a positive relationship between a tightening (i.e. interest rate hike) monetary policy shock and BL fund flows, while similar shocks have a negative effect on investor flows into HYB funds.
Our study contributes to the growing mutual fund literature on corporate bond and leveraged loan investing.7 In particular, our work is more closely related to studies on the impact of U.S. monetary policy on mutual fund investing. Focusing in the post-GFC period, Banegas, Montes-Rojas, and Siga (2022) find that monetary policy shocks have a negative effect on the performance and flows of HYB mutual funds, and that these countercyclical effects are larger for lower levels of liquidity. Recent work by Cetorelli, La Spada, and Santos (2022) find a procyclical and asymmetric relationship between monetary policy shocks and BL fund flows during the 2010-2019 period. They also argue that the effect of monetary policy surprises depends on the initial level of short-term rates at the time of the shock. Our work complements these studies in two main dimensions: first, we assess and provide evidence of the sensitivity of investor flows in HYB and BL mutual funds to changes in interest rates expectations over different stages of the monetary policy cycle. Second, using data over the 2000-2020 period, we show that unexpected changes in the stance of monetary policy can have a direct effect on HYB and BL investor fund flows. We document that a higher-than-expected tightening of the stance of policy is associated with investors pulling out from HYB mutual funds and new money flowing into BL funds.
2. Data
We use a panel of monthly mutual fund share class level data aggregated at the fund level on gross returns, net flows, and AUM from Morningstar Direct (MD). Our sample includes U.S. domiciled mutual funds that invest primarily in high yield bond (HYB) and bank loans (BL) U.S. markets, totaling 8,822 and 40,422 observations, respectively, over the February 2000-December 2020 period. 8 To mitigate concerns over survivorship bias, our sample includes both active and inactive funds. In addition, we consider both actively managed funds and funds with a passive investment objective.
As depicted in Figure 2, AUM of BL more than doubled, on net, during our sample period, jumping from close to $19 billion in early 2000 to $60 billion at the end of 2020. Of note, after reaching a peak in 2013, BL assets have trended down, oscillating within a wide range. More recently, BL assets were particularly hurt by the COVID-19 crisis in 2020, driven both by price declines and heavy investor redemptions. Meanwhile, assets of HYB funds grew at an even faster pace than BL funds over the sample period, rising from about $75 billion to close to $307 billion at the end of 2020, more than triplicating their initial 2000 level. Furthermore, the growth in assets of both fund categories was also associated with strong inflows and an expansion of the universe of mutual funds investing in the high yield segment of corporate debt markets. As shown in Figure 2, the number of new mutual funds investing in BL and HYB markets rose from 16 and 154 funds in 2000, to 57 and 182 funds in 2020, respectively. Of note, despite the strong growth of the BL market (Figure 3, left panel), estimates indicate that the market share of BL mutual funds has been decreasing over the past years, as shown by the right panel of Figure 3. In contrast, the market share of HYB funds has risen notably over the sample period, reaching 22 percent at 2020-year end, and highlighting the increased role of mutual funds in the HYB market.
In evaluating mutual funds sensitivity to changes in interest rate expectations, we rely on survey data from the Blue-Chip Financial Forecasts (BCFF). Our analysis uses consensus forecasts for the federal funds rate, the 2-year Treasury yield, and the 10-year Treasury yield rates over different time horizons, including the current quarter, one quarter ahead, two quarters ahead and one year ahead.9
3. Empirical Strategy
We estimate the effect of interest rate expectations on HYB and BL fund flows using a fixed effects panel regression model. The baseline multivariate setting is defined as follows:
(1) $${flow}_{i,t} = \alpha_i + \beta {rate}^e_t + \gamma X_{i,t-1} + \phi {ADS}_t + u_{i,t}$$
Where $${flow}_{i,t}$$ is the monthly fund flows as a percentage of lagged assets of fund $$i$$ at month $$t$$. $${rate}^e_t$$ is the standardized monthly change in the interest rate expectation variable (i.e. expectations for the federal funds rate, the 2-year U.S. Treasury (UST) yield, and the 10-year UST yield).10 $$X_{i,t-1}$$ is a set of fund level lagged control variables including gross monthly fund returns and the ratio of fund flows to lagged assets. We also include the monthly ADS business conditions index to control for changing economic conditions. $$\alpha_i$$ are entity fixed effects to control for time-invariant fund characteristics. Note that when we run specifications that do not control for macro conditions, we include time fixed effects to control for changes over time that affect all funds. Finally, $$u_i,t$$ are fund-specific innovations. Standard errors are clustered at the fund level.
4. Empirical results
This section presents the empirical findings for our set of regressions for HYB and BL mutual funds. Section 4.1 introduces results for the baseline specification. Section 4.2 adds an additional dimension to our baseline analysis, the forecasting horizon. In section 4.3 we acknowledge that our analysis encompasses different environments and split our panel into sub-periods to reflect these different scenarios.
4.1 Baseline analysis
Table 1 presents results for our baseline analysis where we assess the effect of near-term expectations about the policy rate, the 2-year UST yield, and the 10-year UST yield on investor flows into HYB and BL mutual funds over the February 2000-December 2020 period. Overall, results point to opposite directional effects for HYB and BL funds across the maturity spectrum. For HYB mutual funds, coefficients are statistically and economically significant for the policy rate and both the 2-year and 10-year Treasury yields, indicating that expectations of higher interest rates are negatively related to mutual fund investor flows. Specifically, and after controlling for past fund flows, lagged returns, and macro conditions, a one standard deviation increase in the fed funds rate covariate is associated with redemptions in the order of 0.38 percent of assets from HYB mutual funds. Similarly, a one standard deviation increase in the expected 2-year and in the 10-year Treasury yield translate into net outflows of 0.33 and 0.19 percent of assets, respectively. These results are consistent with the argument that expectations of a higher (lower) interest rate environment compresses (expands) demand for HYB funds, as valuations of fixed-coupon HY bonds will be negatively affected by rate increases.
Table 1. Baseline results
Interest Rate Expectations and Fund Flows. Full Sample (February 2000-December 2020)
Net Flows as a Percentage of Assets
| High Yield Bond (HYB) | Bank Loan (BL) | |||||||||||
|---|---|---|---|---|---|---|---|---|---|---|---|---|
| (1) | (2) | (3) | (4) | (5) | (6) | (7) | (8) | (9) | (10) | (11) | (12) | |
| ff.exp.score | -0.181*** | -0.377*** | 0.145* | -0.049 | ||||||||
| (0.042) | (0.038) | (0.087) | (0.104) | |||||||||
| t2yr.exp.score | -0.154*** | -0.328*** | 0.605*** | 0.246** | ||||||||
| (0.039) | (0.038) | (0.095) | (0.101) | |||||||||
| t10yr.exp.score | -0.164*** | -0.193*** | 0.867*** | 0.382*** | ||||||||
| (0.043) | (0.044) | (0.089) | (0.09) | |||||||||
| lag.gross.return | 0.088*** | 0.081*** | 0.069*** | 0.275*** | 0.237*** | 0.229*** | ||||||
| (0.016) | (0.016) | 0.016 | (0.041) | (0.040) | (0.039) | |||||||
| lag.flows.poa | 0.136*** | 0.137*** | 0.138*** | 0.467*** | 0.464*** | 0.460*** | ||||||
| (0.013) | (0.013) | (0.013) | (0.024) | (0.024) | (0.025) | |||||||
| ADSIndex | -0.035* | -0.055*** | -0.083*** | -0.087*** | -0.122*** | -0.126*** | ||||||
| (0.020) | (0.020) | (0.020) | (0.030) | (0.028) | (0.026) | |||||||
| No. Obs | 40,422 | 38,815 | 40,422 | 38,815 | 40,422 | 38,815 | 8,822 | 8,580 | 8,822 | 8,580 | 8,822 | 8,580 |
| Adj. R-squared | 0.086 | 0.089 | 0.086 | 0.089 | 0.086 | 0.087 | 0.193 | 0.328 | 0.197 | 0.329 | 0.204 | 0.33 |
| Entity FE | Yes | Yes | Yes | Yes | Yes | Yes | Yes | Yes | Yes | Yes | Yes | Yes |
| Time FE | Yes | No | Yes | No | Yes | No | Yes | No | Yes | No | Yes | No |
Note: *p<0.1; **p<0.05; ***p<0.01. Clustered standard errors. Monthly data from Morningstar.
In contrast, results show that BL fund flows are positively related to expectations of higher rates in the near-term, as reflected by the positive loadings on the expected fed funds rate, 2-year and 10- year Treasury yield variables (Table 1). BLs are floating rate investments, and therefore as interest rates fluctuate BL coupon rates also adjust in tandem with the rate environment. Thus, interest rate increases tend to benefit BL investments, supporting the argument that as investors expect a rise in interest rates, they increase demand for funds investing in BL, resulting in positive flows into such funds. This positive rate sensitivity also holds for the expected UST yields when controlling for past flows, lagged returns, and macro conditions, but we lose statistical significance on the expected fed funds rates coefficient. Further analysis suggests that the lack of statistical significance in the policy rate variable are driven in part by both periods of acute market stress encompassed in our sample, such as the GFC and the COVID-19 crisis, and the earlier stages of the BL mutual fund sector.11
In addition, as shown by the univariate regressions in Table 1 (odd columns), rate expectations appear to explain more of the variation in BL fund flows than in HYB flows, as indicated by their higher adjusted R-squared statistics, suggesting that BL flows are more sensitive to changes in expected rates than their HYB counterparts.
Results are also consistent with the mutual fund literature that study the relation between corporate bond mutual fund flows and performance (e.g. Goldstein, Jiang, and Ng (2017), Choi and Kronlund (2018), Mählmann (2022)). We find strong evidence that HYB and BL fund flows are positively related to recent fund performance. Overall, coefficients are statistically and economically significant across specifications, with BL funds presenting the strongest flow-performance relation.
4.2 Forecasting Horizons
To gain further insights on the relationship between interest rate expectations and fund flows, we add the forecasting horizon as an additional dimension to our baseline analysis. We ask whether expectations about the fed funds rate, the 2-year and the 10-year Treasury yield over the one quarter, two quarters, and one year ahead affects current investor allocation decisions, as proxied by fund flows. Table 2 presents a summary of the coefficients of interest over different forecasting horizons for HYB and BL funds. Note that each rate expectation variable is tested separately at each forecasting horizon as defined by equation (1). As shown in the table, expectations of a higher fed funds rate and UST yields are negatively related to investor flows into HYB funds across horizons over the February 2000-December 2020 period. In contrast, and similar to our baseline results, BL fund flows' positive relationship with rate expectations continues to hold across horizons and rates.
Table 2. Forecasting horizons
Full Sample (February 2000-December 2020)
Net Flows as a Percentage of Assets
| HYB | BL | |||||
|---|---|---|---|---|---|---|
| 1Q | 2Q | 4Q | 1Q | 2Q | 4Q | |
| ff.exp.score | -0.389*** | -0.335*** | -0.199*** | 0.103 | 0.191* | 0.190** |
| (0.037) | (0.037) | (0.036) | (0.104) | (0.099) | (0.091) | |
| t2yr.exp.score | -0.314*** | -0.259*** | -0.156*** | 0.283*** | 0.330*** | 0.273*** |
| (0.037) | (0.037) | (0.036) | (0.096) | (0.094) | (0.086) | |
| t10yr.exp.score | -0.177*** | -0.134*** | -0.063 | 0.395*** | 0.437*** | 0.417*** |
| (0.042) | (0.041) | (0.039) | (0.088) | (0.087) | (0.085) | |
| Controls | Yes | Yes | Yes | Yes | Yes | Yes |
| No. Obs | 38,815 | 38,815 | 38,815 | 8,580 | 8,580 | 8,580 |
| Entity FE | Yes | Yes | Yes | Yes | Yes | Yes |
Note: *p<0.1; **p<0.05; ***p<0.01. Clustered standard errors. Monthly data from Morningstar.
4.3 Sub-sample analysis
Our study encompasses different growth stages of the HYB and BL mutual fund sectors as well as different rate environments. To gain further insights on the sensitivity of HYB and BL fund flows to interest rate expectations and the stability of our baseline results, we next conduct a sub-sample analysis reflecting the different sector conditions and environments covered by our study.12
4.3.1 Pre- and post-GFC
We define the pre- and post-GFC as the periods spanning from February 2000 to November 2007 and July 2009 to February 2020, respectively. As shown in Table 3, our baseline results are strikingly robust for HYB funds, both when restricting our analysis to the pre- and post-GFC period, providing further evidence that higher expectations about the policy rate and Treasury yields are associated with investor outflows from HYB mutual funds. For BL funds, the evidence strongly supports the view that as investor expect higher interest rates, net demand for BL investments increases, as reflected by the positive loadings across rates. Results are particularly robust during the July 2009 to February 2020 period. For the pre-GCF period, which coincides with the early stages of the BL mutual fund sector, results point to similar directional effects, although lack statistical significance.
Table 3. Pre- and Post-GFC
Interest Rate Expectations and Fund Flows
Net Flows as a Percentage of Assets
| Pre-Crisis (February 2000-November 2007) | Post-Crisis (July 2009-February 2020) | |||||||||||
|---|---|---|---|---|---|---|---|---|---|---|---|---|
| HYB | BL | HYB | BL | |||||||||
| (1) | (2) | (3) | (4) | (5) | (6) | (7) | (8) | (9) | (10) | (11) | (12) | |
| ff.exp.score | -0.296*** | 0.218 | -0.517*** | 0.458*** | ||||||||
| (0.053) | (0.219) | (0.099) | (0.160) | |||||||||
| t2yr.exp.score | -0.370*** | 0.198 | -0.404*** | 0.529*** | ||||||||
| (0.052) | (0.209) | (0.076) | (0.132) | |||||||||
| t10yr.exp.score | -0.381*** | 0.143 | -0.215*** | 0.720*** | ||||||||
| (0.063) | (0.234) | (0.059) | (0.112) | |||||||||
| Controls | Yes | Yes | Yes | Yes | Yes | Yes | Yes | Yes | Yes | Yes | Yes | Yes |
| No. Obs | 12,575 | 12,575 | 12,575 | 1,639 | 1,639 | 1,639 | 21,520 | 21,520 | 21,520 | 5,838 | 5,838 | 5,838 |
| Adj. R-squared | 0.131 | 0.133 | 0.132 | 0.345 | 0.345 | 0.344 | 0.086 | 0.086 | 0.086 | 0.37 | 0.371 | 0.375 |
| Entity FE | Yes | Yes | Yes | Yes | Yes | Yes | Yes | Yes | Yes | Yes | Yes | Yes |
Note: *p<0.1; **p<0.05; ***p<0.01. Clustered standard errors. Monthly data from Morningstar.
4.3.2 Lift-off
By the end of 2015, the Federal Reserve lifted interest rates from near zero after years at the zero-lower bound.13 To gain further insights over the HYB and BL fund flow-rates relation, we next focus our analysis on the lift-off period, spanning from December 2015 to February 2020. As reported in Table 4, the effects of expected rates on HYB and BL fund flows persist during this period of contractionary monetary policy, with results being remarkably strong for BL mutual funds. A one standard deviation increase in the policy rate and Treasury yield variables is associated with new cash flows into BL funds ranging from close to 0.9 to 1.2 percent of assets. Overall, results provide evidence of the strong sensitivity of BL funds to expectations about future rates, and that demand for BL funds tend to increase when expected interest rates rise. These results, together with additional post-GFC analysis excluding the lift-off period (not shown), suggest that, for BL funds, the effect of interest rate expectations on investor fund flows appears to be stronger during periods of monetary policy tightening. Taken together, our findings suggest that the sensitivity of fund flows to expected rates will be conditional to the stage of the monetary policy cycle.
Table 4. Lift-off
Interest Rate Expectations and Fund Flows (December 2015-February 2020)
Net Flows as a Percentage of Assets
| HYB | BL | |||||
|---|---|---|---|---|---|---|
| (1) | (2) | (3) | (4) | (5) | (6) | |
| ff.exp.score | -0.179* | 0.923*** | ||||
| (0.095) | (0.166) | |||||
| t2yr.exp.score | -0.440*** | 1.056*** | ||||
| (0.081) | (0.148) | |||||
| t10yr.exp.score | -0.364*** | 1.150*** | ||||
| (0.076) | (0.148) | |||||
| Controls | Yes | Yes | Yes | Yes | Yes | Yes |
| No. Obs | 9,091 | 9,091 | 9,091 | 2,734 | 2,734 | 2,734 |
| Adj. R-squared | 0.097 | 0.1 | 0.099 | 0.242 | 0.249 | 0.256 |
| Entity FE | Yes | Yes | Yes | Yes | Yes | Yes |
Note: *p<0.1; **p<0.05; ***p<0.01. Clustered standard errors. Monthly data from Morningstar.
5. Market-based interest rates expectations
In this section we depart from survey-based rate forecasts to test whether our results hold when estimating the effect of rates on fund flows using a proxy of market-based interest rate expectations. We use the one year ahead federal funds rates from OIS (overnight index swap) contracts, which we interpret as a market-based measure of federal funds rate expectations. Table 5 presents our findings for the full sample period. Overall, after controlling for lagged fund returns and flows, and macro conditions, results hold both for HYB and BL mutual funds, indicating that market-based expectations for a higher federal funds rate are positively associated with new cash flows into BL funds and redemptions from HYB mutual funds.
Table 5. Market-based interest rate expectations
Full Sample (February 2000-December 2020)
Net Flows as a Percentage of Assets
| HYB | BL | |
|---|---|---|
| (1) | (2) | |
| OIS.exp.score | -0.157*** | 0.723*** |
| (0.040) | (0.093) | |
| lag.flows.poa | 0.137*** | 0.461*** |
| (0.013) | (0.024) | |
| lag.gross.returns | 0.078*** | 0.215*** |
| (0.016) | (0.039) | |
| ADSIndex | -0.102*** | -0.102*** |
| (0.019) | (0.025) | |
| Adj. R-Squared | 0.087 | 0.336 |
| No. Obs | 38,815 | 8,580 |
| Entity FE | Yes | Yes |
Note: *p<0.1; **p<0.05; ***p<0.01. Clustered standard errors. Monthly data from Morningstar.
6. Monetary policy shocks and fund flows
In this section we introduce the discussion on the effect of unexpected changes in the stance of monetary policy on both HYB and BL fund investor flows. We build a proxy of policy shocks using intra-day data on the two-year nominal UST yield as proposed by Hanson and Stein (2015). Specifically, we use the change in the 2-year nominal UST yield on FOMC announcement dates as proxy for monetary policy surprises. The underlying idea is to capture unanticipated changes about the expected medium-term path of interest rates, which would correspond to both target and path surprises. To avoid the omitted variable bias due to changes in the 2-year UST yield on FOMC days not reflecting monetary policy surprises but rather other macroeconomic news, we use the change in 2-year UST yield in a 60-minute window (15 minutes before and 45 minutes after) around FOMC announcements. Shocks are aggregated into a monthly frequency. If the Federal Reserve made no announcements on a given month, we input a 0 value. For months with multiple announcements on a month, we compute and use the average monthly shock.14 We denote this exogenous shock HS.
Overall, results indicate that a higher-than-expected tightening of the stance of policy is associated with investors pulling out from HYB mutual funds and new money flowing into BL funds. As shown in Table 6, a one standard deviation positive monetary policy shock translates into HYB fund outflows in the order of 0.24 percent of assets, after controlling for past returns, lagged flows, and macro conditions. In contrast, a similar shock is associated with net inflows into BL mutual funds at 0.26 percent of assets.
Table 6. Monetary policy shocks
Full Sample (February 2000-December 2020)
Net Flows as a Percentage of Assets
| HYB | BL | |
|---|---|---|
| (1) | (2) | |
| hsShock | -0.236*** | 0.263*** |
| (0.034) | (0.075) | |
| lag.flows.poa | 0.138*** | 0.466*** |
| (0.013) | (0.024) | |
| lag.gross.returns | 0.076*** | 0.265*** |
| (0.016) | (0.039) | |
| ADSIndex | -0.110*** | -0.092*** |
| (0.019) | (0.026) | |
| Adj. R-Squared | 0.088 | 0.329 |
| No. Obs | 38,815 | 8,580 |
| Entity FE | Yes | Yes |
Note: *p<0.1; **p<0.05; ***p<0.01. Clustered standard errors. Monthly data from Morningstar.
References
Anadu, K and F Cai, "Liquidity transformation risks in U.S. bank loan and high-yield mutual funds", FEDS Notes (2019)
Banegas, Ayelen and Goldenring, Jessica, "Leveraged Bank Loan Versus High Yield Bond Mutual Funds", FEDS Working Paper No. 2019-047 (2019)
Banegas, Ayelen, Gabriel Montes-Rojas, and Lucas Siga, "The effects of U.S. monetary policy shocks on mutual fund investing", Journal of International Money and Finance, Volume 123 (2022)
Cetorelli, Nicola, Gabriele La Spada, and Joao Santos, "Monetary Policy and the Run Risk of Loan Funds", Federal Reserve Bank of New York Staff Reports (March 2022)
Choi, Jaewon and Mathias Kronlund, "Reaching for Yield in Corporate Bond Mutual Funds", Review of Financial Studies, Society for Financial Studies, vol. 31(5), pages 1930-1965 (2018)
Falato, Antonio, Itay Goldstein, and Ali Hortaçsu, "Financial fragility in the COVID-19 crisis: The case of investment funds in corporate bond markets", Journal of Monetary Economics, Volume 123 (2021)
Faust, Jon, Simon Gilchrist, Jonathan H. Wright, and Egon Zakrajšsek, "Credit Spreads as Predictors of Real-Time Economic Activity: A Bayesian Model-Averaging Approach", The Review of Economics and Statistics, (2013)
Goldstein, I., H. Jiang, and D. T. Ng, "Investor Flows and Fragility in Corporate Bond Funds", Journal of Financial Economics, 126(3), 592 – 613 (2017)
Hanson, Samuel G. and Jeremy C. Stein, "Monetary policy and long-term real rates", Journal of Financial Economics, Volume 115, Issue 3 (2015)
Jiang, Hao, Yi Li, Zheng Sun, and Ashley Wang, "Does Mutual Fund Illiquidity Introduce Fragility into Asset Prices? Evidence from the Corporate Bond Market", Journal of Financial Economics, Volume 143, (2022)
Ma, Yiming, Kairong Xiao, and Yao Zeng, "Mutual Fund Liquidity Transformation and Reverse Flight to Liquidity", Review of Financial Studies (2022)
Mählmann, Thomas, "Negative externalities of mutual fund instability: Evidence from leveraged loan funds", Journal of Banking & Finance, Volume 134 (2022)
1. We thank Jessica Goldenring for excellent research assistance in earlier versions of the analysis. Return to text
2. See Banegas and Goldenring (2019) for a detailed characterization and comparison of the universe of BL and HYB mutual funds, and Anadu and Cai (2019) for an in-depth analysis of the liquidity profiles of the largest BL and HYB funds. Return to text
3. Since 2022, new leveraged loans have been using the SOFR as the reference variable rate instead of the U.S. LIBOR, which will be discontinued in 2023. Return to text
4. Note that the callability option embedded in some corporate debt instruments (mostly BLs) introduce prepayment risks, and therefore has also the potential to affect fund flows responses to changes in interest rates (see Faust, Gilchrist, Wright and Zakrajšsek (2013) for a discussion on callable bonds). Return to text
5. For instance, recent studies find that the heavy redemptions from mutual funds during the March 2020 turmoil contributed to the disruptions in U.S. corporate debt markets (i.e. Liang (2020) and Jiang et al. (2021), among others). Return to text
6. All else equal, higher UST yields, compress credit spreads and risk premia. As the expected excess return of the HYBs over its UST counterparts decline, demand for HYB can also be expected to drop (i.e. fund outflows) Return to text
7. Recent studies have focus on the COVID-19 crisis to assess the risks to financial stability arising from sudden runs by mutual fund investors in corporate debt markets (see Jiang, Li, Sun, and Wang (2022); Falato, Goldstein, and Hortaçsu (2021); Ma, Xiao, and Zeng (2021); among others). Return to text
8. Specifically, the sample considers the Morningstar "Bank Loan" and "High Yield Bond" categories of MD "Taxable Bond" (TB) U.S. Category Group. The sample excludes fund of funds. We winsorized the top and bottom 1 percent data points at each point in time. Return to text
9. Consensus rates are the average value of all individual respondents' rate forecasts. The BCFF participants are surveyed the last week of the previous month for current month expectations. Return to text
10. For example, in month t, we calculate the change in the expected rate for the current quarter-end relative to the previous month forecast for the same quarter. Return to text
11. Our full sample results also hold to including dummies to account for crisis episodes such as March 2020. In this alternative setting, while results remained largely unchanged, the rate sensitivity of BL fund flows appears to be somewhat stronger (not shown). Return to text
12. We exclude extreme episodes from the subsample analysis, such as the GFC (December 2007-June 2009) and the COVID-19 pandemic (February 2020-December 2020). Return to text
13. Following the onset of the GFC the Federal Reserve began aggressively cutting the Fed Funds target rate, reaching the ZLB by the end of 2008 and turning to unconventional policy tools to provide additional downward pressure on longer-term interest rates. Return to text
14. We also consider removing those observations when there is no monetary policy announcements (not shown). Results hold for both HYB and BL funds, with a somewhat larger positive statistically significant loading for BL funds. Return to text
Banegas, Ayelen, and Christopher Finch (2022). "Interest Rates Expectations and Flow Dynamics in High Yield Corporate Debt Mutual funds," FEDS Notes. Washington: Board of Governors of the Federal Reserve System, June 17, 2022, https://doi.org/10.17016/2380-7172.3115.
Disclaimer: FEDS Notes are articles in which Board staff offer their own views and present analysis on a range of topics in economics and finance. These articles are shorter and less technically oriented than FEDS Working Papers and IFDP papers.