FEDS Notes
June 26, 2025
Introducing New Detail on the Racial Composition of Families in the 2022 Survey of Consumer Finances: Implications for the Distribution of U.S. Student Loan Debt
Sarena Goodman and Eva Ma1
Student loan debt is the second-largest liability on U.S. household balance sheets, next after mortgages (Federal Reserve Bank of New York, 2025). While the availability of student loans can open educational opportunities that might not have otherwise existed, many borrowers struggle with repayment and may see their credit records damaged or wages garnished if they fall behind. Indeed, in the current zeitgeist, student loan debt has been linked to economic mobility concerns in the United States, particularly across racial groups, where notable differences in student loan debt burdens and repayment rates exist (e.g., Looney, 2022).
The leading source of these and similar racial wealth statistics is the Federal Reserve Board's Survey of Consumer Finances (SCF). The SCF is a triennial household survey that collects detailed financial information, most recently in 2022.2 It is one of the only nationally representative datasets that can connect a family's student loan debt to their broader economic well-being and demographic characteristics, including race and ethnicity. However, one key challenge when using the SCF to make these connections is that its unit of observation for most balance sheet items, including student loan debt, is a family, which usually consists of multiple people, but race and ethnicity has historically only been collected for one person in the family, the survey respondent.3, 4 As a result, distributional wealth statistics over race and ethnicity that are constructed from the SCF generally assign all of a family's balance sheet information to the group to which the survey respondent belongs, even for families where other members' racial or ethnic group differs from the respondent's. If a large share of student loan debt is owed by such families, the statistics over race and ethnicity that are commonly relied upon for policy analysis could be misleading. For context, in 2022, 78 percent of student loan debt was owed by families that included more members than just the survey respondent.
In 2022, however, the SCF began collecting the race and ethnicity of the respondent's spouse or partner, offering a better window into the large portion of families that include a spouse or partner (56 percent) and the even larger portion of student loan debt owed by such families (69 percent).5 This note leverages this additional information to introduce new insight into the racial and ethnic composition of U.S. families covered by the SCF and, as an important case study, refine key statistics that describe how U.S. student loan debt is distributed over race and ethnicity. We find that, in 2022, interracial couples constituted about 10 percent of families covered by the SCF, roughly the same share of families that were classified in each of the Black non-Hispanic, Hispanic, and Other or Multiple Race racial groups in the published statistics (Aladangady et al., 2023).6 Moreover, a substantial portion of families in all four of the racial groups that form these statistics were in fact interracial couples, ranging from 26 percent of the Other or Multiple Race racial group to 7 percent of the Black non-Hispanic racial group. We also discover that collectively, 18 percent of 2022 student loan debt was owed by interracial couples, indicating that a fairly large share of student loan debt is misclassified in commonly used distributional statistics over race and ethnicity. Even so, factoring the spouse or partner's race and ethnicity into those statistics does not meaningfully affect the distribution of aggregate student loan debt across racial groups nor does it substantially shift the average or median student loan debt burden among any of these groups. That said, the within-group changes are large enough to affect the conclusions one might draw about the relative challenges faced by different racial groups from their student loan debt.
Analysis
Family Composition
Figure 1 describes the distribution of families in the 2022 SCF based on the race and ethnicity of the survey respondent. For maximum comparability with published statistics, throughout the analysis, an individual's racial and ethnic information is distilled into 1 of 4 mutually exclusive "racial groups"—White non-Hispanic ("White"), Black non-Hispanic ("Black"), Hispanic ("Hispanic"), and Other or Multiple Race ("Other").7 Panel 1a delineates the share of respondents in each racial group according to whether they are part of a couple and, if so, whether their spouse or partner is in the same racial group. For convenience, we refer to the three groups as "non-couples," "same-race couples," and "interracial couples," even though families in any of these groups may include other members (parents, children, or siblings, for example).
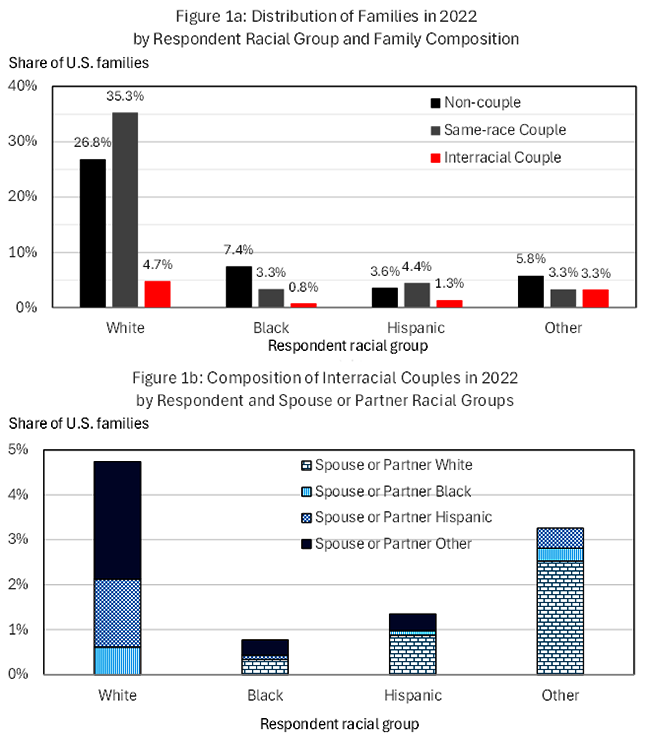
Note: Legend in Panel 1a identifies series in order from left to right.
A few facts emerge. First, summing the red columns, interracial couples constitute about 10 percent of families and 18 percent of couples. These shares are quite large, considering that the Black, Hispanic, and Other racial groups each constitute around 10 percent of families themselves. Second, interracial couples are unevenly distributed across the published racial wealth statistics. Most of them are classified as White (47 percent), followed by Other (32 percent), then Hispanic (13 percent), then Black (8 percent). Finally, and a key consideration for distributional analysis, the prevalence of interracial couples is not symmetric across racial groups. Interracial couples constitute 26 percent of the Other racial group, 14 percent of the Hispanic racial group, 7 percent of the White racial group, and 7 percent of the Black racial group.
Panel 1b zooms in on the red bars from Panel 1a and divides them based on the spouse or partner's racial group. Summing the corresponding segment across columns, the respondent's spouse or partner in an interracial couple most commonly belongs to the White racial group (about 4 percent of all families), followed by Other (about 3 percent), Hispanic (about 2 percent), and Black (about 1 percent). But, such a framing ignores the relative sizes of the different racial groups noted above, which is also a relevant factor for understanding distributional impacts. For example, only around 9 percent of respondents are Hispanic, so that 2 percent is actually a very large portion of the Hispanic racial group that is concealed within the published statistics (22 percent). These figures are 27 percent, 9 percent, and 6 percent for the Other, Black, and White racial groups, respectively.
These findings are particularly interesting, given that either member of the central couple in an SCF family is eligible to be the survey respondent (although preference is given to the person who is more knowledgeable about the family's finances).8 Suppose that for all instances of interracial couples in which the spouse or partner belonged to the Other racial group in 2022, the SCF had wound up interviewing the spouse or partner instead of the actual survey respondent. In that event, the Other racial group would constitute a substantially larger share of families (16 percent) than the share reflected in the published statistics based solely on the respondent's information (12 percent).
Beyond knowledgeability, many potential factors can influence which spouse or partner is the survey respondent, including, for example, differences in availability and willingness to complete the survey. We can use the figures in Panel 1b to derive, for each racial group, the likelihood that a member of that group is the respondent when they are part of an interracial couple. Figures close to 50 percent for each group would suggest that either member of an interracial couple is equally likely to be the respondent. In contrast, large-enough deviations from 50 percent would suggest a tendency for certain groups to be (or not be) the survey respondent, which could influence aggregate estimates across groups.9 Dividing the height of the White column by the sum of all of the White segments in Panel 1b indicates that, when one member of an interracial couple is in the White racial group, that individual is the survey respondent 56 percent of the time. The corresponding figures for the Black, Hispanic, and Other racial groups are 43 percent, 40 percent, and 50 percent, respectively. These figures are reasonably close to 50 percent but could possibly suggest some overresponse by White members of interracial couples and under-response by Hispanic and Black members that should be better understood in future research.
Student Loan Debt
Now, turning to our case study, consider the distribution of student loan debt. It's already been well-documented that, based on the survey respondent's racial group, non-White families are disproportionately likely to owe student loan debt. They also owe a disproportionate share of aggregate student loan debt relative to the share of families they constitute. Indeed, in the 2022 SCF, 19 percent of families with student loan debt were in the Black racial group, 14 percent were in the Other racial group, and 7 percent were in the Hispanic racial group. Together, these groups owed 40 percent of student loan debt: 21 percent was owed by the Black racial group, 15 percent by the Other racial group, and 4 percent by the Hispanic racial group.
The new detail introduced by the 2022 SCF reveals that interracial couples are also disproportionately likely to owe student loan debt relative to their size. In 2022, they constituted 15 percent of families with student loan debt and 23 percent of couples with student loan debt. Collectively, they owed 18 percent of student loan debt, implying that a substantial share of student loan debt is misclassified in racial statistics.
Figure 2 describes the distribution of student loan debt in 2022, with the first two panels organized the same as Figure 1. Analogous to above, Panel 2a indicates that debt owed by interracial couples is unevenly incorporated into the published statistics by respondent race. About 8 percent of student loan debt shows up in the statistics for White families when it is actually owed by an interracial couple, compared with about 7 percent, 2 percent, and 1 percent into the statistics for Other, Black, and Hispanic families. That said, the influence that misclassification stemming from the spouse or partner's race being different than the respondent has on the student loan debt statistics for a given racial group depends on the portion of that group's debt that is owed by an interracial couple. About 13 percent of student loan debt ascribed to the White racial group is owed by an interracial couple. That figure is 11 percent, 33 percent, and 44 percent for the Black, Hispanic, and Other racial groups, respectively. It is quite striking how high some of these figures are!
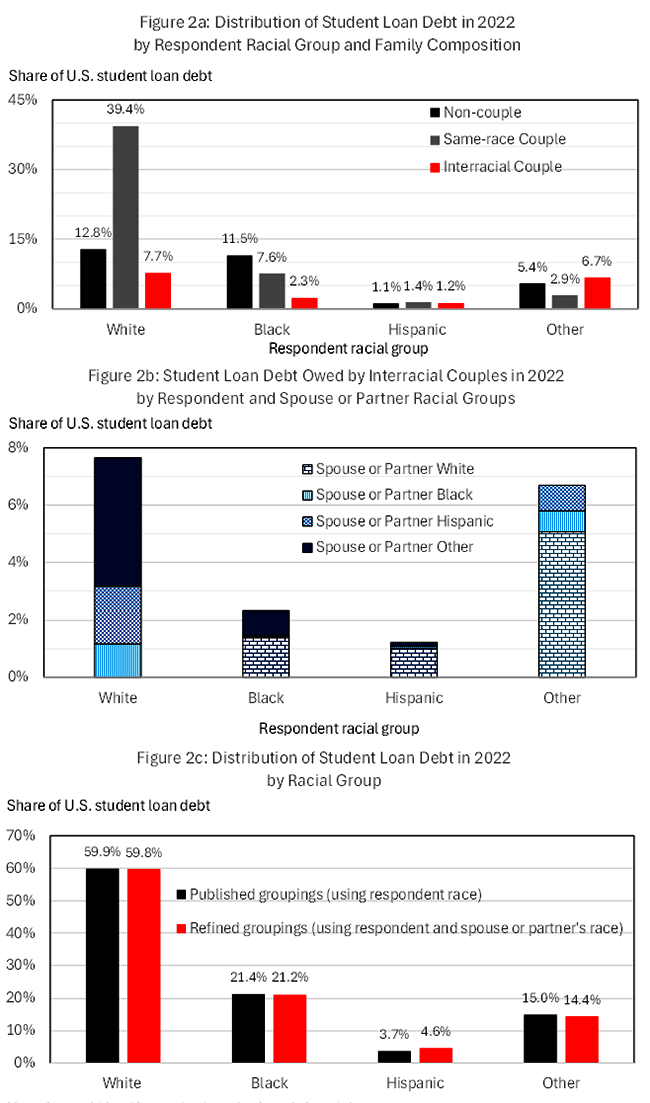
Note: Legends in Panel 2a and Panel 2c identify series in order from left to right.
Panel 2b divides the red bars in Panel 2a according to the spouse or partner's racial group. Summing the corresponding segment across columns, elsewhere-classified student loan debt most commonly belongs to the White racial group (7 percent of all such debt), followed by the Other (5 percent), Hispanic (3 percent), and Black (2 percent) racial groups.
Panel 2c presents side-by-side distributions of student loan debt by racial group, where the black columns represent the distribution that emerges when relying on just the respondent's information (as in Figure 2a and the published statistics) and the red columns represent the one that emerges when the spouse or partner's information is considered as well.10 On net, moving to the more refined measure in the red columns does not change the distribution across racial groups all that much. That said, families in the Hispanic racial group owe nearly 1 p.p. more debt, which is off a tiny initial share, such that accounting for the spouse or partner's racial group generates nearly a 25 percent increase in that group's overall stake of the nation's student loan debt.
Finally, we consider the implications for student loan debt loads for the average and median family with student loan debt by racial group in Figure 3a and 3b, respectively.11 These measures are commonly used to draw comparisons between racial groups in the challenges that they experience from student loan borrowing. For example, a larger student loan debt burden could signal greater repayment difficulty or reduced access to other types of credit. Generally speaking, averages are arithmetically cleaner for subgroup analysis, but medians place less weight on outliers and better characterize what is "typical" for families in each group. Across the board, the averages are far above the medians, a reflection of upward skewness in student loan debt loads within every group. We discuss both measures for completeness.
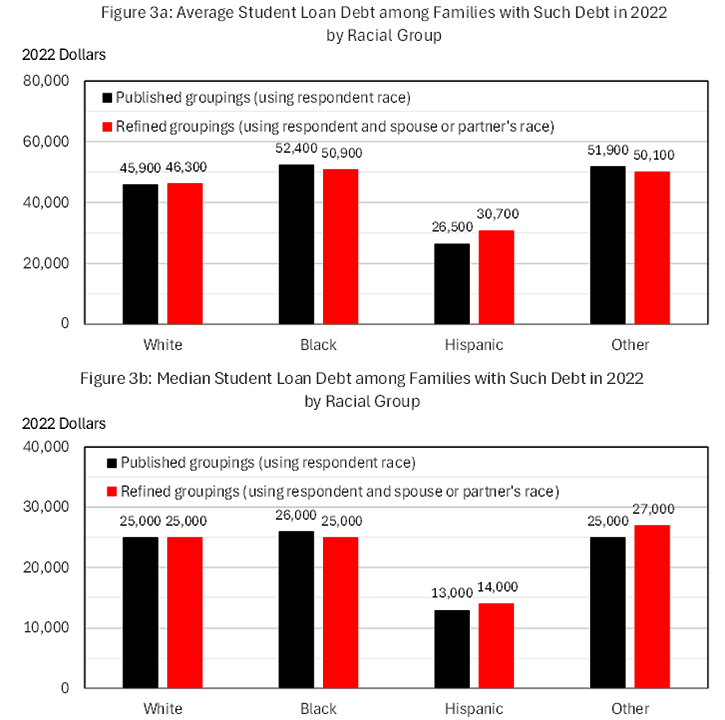
Note: Legends identify series in order from left to right.
As we'd expect from the shares of the relevant distributions that interracial couples represent, moving to the more refined measure does not generate very dramatic changes in either the average or median student loan debt owed by families with such debt in any racial group. In addition, measuring student loan debt by group more granularly generally results in larger changes for means than medians. That said, due to the influence of extreme values, the rankings across groups are preserved when restricting attention to means, while the changes in medians are large enough to affect the conclusions one might draw about relative challenges between groups. Specifically, ranking the median amount of student loan debt owed by families with such debt in each racial group using just the respondent's information, the Black racial group owes the most, followed next by the White and Other racial groups (which owe the same), and last by the Hispanic racial group, which owes about half as much as the other groups. Moving to the more refined measure shifts these rankings: the median for the Other racial group increases to the highest of the four groups, and the median for the Black racial group decreases to the same level as the White racial group, which has the same median debt whether or not the spouse or partner's race is taken into account. Based on this measure alone, it would seem that families in the Other racial group potentially face the largest challenges from their student loan debt, with those in the Black and White racial groups on fairly even footing behind them, a notable deviation from standard characterizations (Looney, 2022).
Work Cited
Aladangady, Aditya, Andrew C. Chang, and Jacob Krimmel (2024). "Greater Wealth, Greater Uncertainty: Changes in Racial Inequality in the Survey of Consumer Finances." The Journal of Economic Inequality.
Aladangady, Aditya, Jesse Bricker, Andrew C. Chang, Sarena Goodman, Jacob Krimmel, Kevin B. Moore, Sarah Reber, Alice Henriques Volz, and Richard A. Windle (2023). Changes in U.S. Family Finances from 2019 to 2022: Evidence from the Survey of Consumer Finances. Washington: Board of Governors of the Federal Reserve System, October.
Bricker, Jesse, Meta Brown, Simona Hannon, and Karen Pence (2015). "How Much Student Debt is Out There?" FEDS Notes. Washington: Board of Governors of the Federal Reserve System, August 07, 2015.
Dettling, Lisa, Sarena Goodman, and Sarah Reber (2024). "Saving and Wealth Accumulation among Student Loan Borrowers: Implications for Retirement Preparedness," in Real-World Shocks and Retirement System Resiliency, edited by Mitchell, Olivia S., John Sabelhaus, and Stephen Utkus, Oxford.
Federal Reserve Bank of New York (2025). Quarterly Report on Household Debt and Credit 2025:Q1. Federal Reserve Bank of New York, May.
Looney, Adam (2022). "Student Loan Forgiveness Is Regressive Whether Measured by Income, Education, or Wealth: Why Only Targeted Debt Relief Policies Can Reduce Injustices in Student Loans," Hutchins Center Working Paper 75, The Brookings Institution.
1. Division of Research and Statistics, Board of Governors of the Federal Reserve System. The analysis and conclusions set forth are those of the authors and do not necessarily reflect the views of the Board of Governors or the Federal Reserve staff. We thank Adi Aladangady, Joanne Hsu, Gina Li, Kevin Moore, Michael Palumbo, and Alice Volz for very helpful conversations. Return to text
2. Aladangady et al. (2023) provides more information about the SCF, including a summary of the 2022 findings. Return to text
3. Another challenge in making these connections with the SCF is that due to its design, the SCF excludes about one-third of U.S. student loan debt, owed by institutional populations (such as students in dormitories) and household members that are financially independent from the family that the SCF surveys (Bricker et al., 2015; Dettling, Goodman, and Reber, 2024). Return to text
4. In addition to the survey respondent, an SCF family will include the respondent's spouse or partner, their dependent children, and other individuals in the household that are financially interdependent with the respondent. Return to text
5. A small share of families (1.01 percent in 2022) include married or partnered respondents whose spouse or partner lives elsewhere. In such instances, the SCF does not collect racial or ethnic information for the spouse or partner. Our analysis treats such families as non-coupled. In contrast to the general population, the majority of these families (70 percent) are classified as non-White, distributed fairly equally across the Black non-Hispanic, Hispanic, and Other or Multiple Race racial groups. Return to text
6. Elsewhere, the U.S. Census Bureau publishes counts of opposite-sex interracial couples from the Current Population Survey (CPS), which has some sample and conceptual differences from the SCF that affect the comparability of the two data sources (Aladangady et al., 2023). Nonetheless, in the 2022 CPS, 12 percent of opposite-sex couples were interracial compared to 18 percent in the SCF, which, generally speaking, corroborates the SCF data. (For more, see https://www.census.gov/data/tables/2022/demo/families/cps-2022.html, tables FG3 and UC3.) Return to text
7. While not separately analyzed here, the 2022 SCF also introduced changes to the sampling design that made it possible to distinguish a 5th "Asian" racial group within the set of families classified as "Other." Return to text
8. While the SCF has strict criteria dictating who can respond to the survey, within a couple that is deemed eligible, either spouse or partner may respond. Return to text
9. Aladangady, Chang, and Krimmel (2024) found differences in SCF families' perceptions of their financial futures and the economy by racial group. Return to text
10. Specifically, we split couples into two observations, assigning each member the family's total student loan debt and half the family's sample weight. Return to text
11. Over all families (not just those with student loan debt), the average amount of student loan debt is highest for the Black racial group ($18,800), followed by the Other racial group ($12,400), the White racial group ($9,100), and the Hispanic racial group ($4,100). The unconditional median is $0 for all four groups. Moving to the granular measure, the unconditional mean does not change for the White racial group. There are small changes for non-White families, but the rankings stay the same. The unconditional mean is $18,500 for the Black racial group, $11,900 for the Other racial group, and $4,800 for the Hispanic racial group. The median remains $0 for all four groups. Return to text
Goodman, Sarena, and Eva Ma (2025). "Introducing New Detail on the Racial Composition of Families in the 2022 Survey of Consumer Finances: Implications for the Distribution of U.S. Student Loan Debt," FEDS Notes. Washington: Board of Governors of the Federal Reserve System, June 26, 2025, https://doi.org/10.17016/2380-7172.3826.
Disclaimer: FEDS Notes are articles in which Board staff offer their own views and present analysis on a range of topics in economics and finance. These articles are shorter and less technically oriented than FEDS Working Papers and IFDP papers.