FEDS Notes
October 11, 2017
Natural Disasters and the Measurement of Industrial Production: Hurricane Harvey, a Case Study
Kimberly Bayard, Ryan Decker, and Charles Gilbert
The Federal Reserve's G.17 release on industrial production (IP) and capacity utilization published on September 15, 2017, included one of the first estimates of the impact on a specific measure of economic activity by Hurricane Harvey, which made landfall in Texas on August 25. As reported in the release, total industrial production fell 0.9 percent in August, most of which (about 3/4 percentage point) could be accounted for by storm-related outages. It is instructive to understand how the monthly IP indexes are estimated in light of massive disruptions, and how the effect of those disruptions is measured.
Industrial Production
The indexes of industrial production are monthly measures of the real output of manufacturing, mining, and electric and gas utilities. The indexes date back to 1919 and were initiated to satisfy the need of the Federal Reserve for timely data depicting a very cyclical sector of the economy. Unlike many other economic indicators, the IP indexes are estimated based on detailed industry-level or product-level data compiled by other organizations rather than on the results from a survey of its own.
The aggregate index for total industrial production is composed of 299 detailed indexes that measure production in separate parts of the industrial sector. Some of these indexes are based on direct measures of output in an industry. Others, however, are constructed from indirect measures of production; in particular, many indexes reflect monthly production worker hours for an industry, as collected by the Bureau of Labor Statistics. In these cases, output is estimated by combining the data on production worker hours with model-based estimates of labor productivity growth that reflect productivity trends in recent years.
About two weeks after a month ends, the Federal Reserve publishes an initial estimate of IP for that month along with revised estimates for the five previous months. This schedule allows for the incorporation of data that are very timely (but perhaps preliminary), while also allowing for the incorporation of more comprehensive data that may only become available in subsequent months. This quick turnaround on the initial estimate of IP makes the index one of the first statistics to provide information on economic activity in the previous month.
Measuring IP in the Presence of Hurricane Harvey
When Hurricane Harvey struck the Gulf Coast of Texas in late August 2017, many businesses in its direct path shut down temporarily to weather the storm. The Gulf Coast is a major center of activity for oil and gas extraction, petroleum refining, petrochemical, and plastic resin production. The curtailment of operations for those industries, as well as for many industries that have a smaller presence in the Gulf region, had a sizable impact on U.S. industrial production in August.
The Federal Reserve staff had two goals in estimating IP in the presence of Hurricane Harvey: Determining the best estimate of overall U.S. production in August and quantifying the lost production due to storm-related shutdowns. Because the IP indexes are constructed from a variety of sources rather than from a single survey, different industries posed different problems. For example, for the first estimate of August IP, the production indexes for many industries relied on production worker hours--either as a primary data source or as a preliminary source until other data become available. Because the data on production worker hours are drawn from a survey that covers the early part of the month, they did not reflect outages that occurred at the end of the month. For other industries--especially many energy-related industries in the Gulf region--the standard data used in the first estimate provided a good reading on overall activity in the country for the month but did not directly address the impact of the hurricane.
Estimating the Effects of Hurricane Harvey for Industries with Timely, High-frequency Data
The storm-related shutdowns for the major Gulf Coast industries contributed to a reduction in the change in total IP of about 1/2 percentage point. The sections below describe for each of these industries the detailed high-frequency data that were brought to bear in making these estimates. The contribution to the overall impact of Harvey on total IP for each industry is the product of the industry's relative importance weight in total industrial production and an estimate of the share of monthly output that was lost because of the hurricane.
Petroleum Refining
The IP index for petroleum refining is based on data from the Energy Information Administration (EIA) of the Department of Energy (DOE). The EIA publishes the very timely Weekly Petroleum Status Report, which includes production data for products such as gasoline and distillate fuel oils and is usually available about five days after the end of a week. In the case of Hurricane Harvey, the report for the week ending September 1, which covered the period since the hurricane made landfall, was available on September 7. The data from the September 7th report, along with data for earlier weeks in the month, were incorporated in the initial estimates for IP in the standard fashion.
The initial published August estimates for petroleum refining will be supplanted in the IP release published in mid-November by new estimates based on comprehensive monthly data for production from the EIA's Petroleum Supply Monthly.
To estimate the share of refinery output that was shut in for August because of Hurricane Harvey, Federal Reserve staff monitored multiple sources that kept track of outages in the affected region. The DOE's once- or twice-daily Situation Reports provided information on whether petroleum refineries were shut down, operating at reduced rates, or in the process of restarting.1 Federal Reserve staff made assumptions about the operating rates at these different levels and aggregated the rates to the industry level. Combining all of this information allowed Federal Reserve staff to track daily refinery outages.2
Chart 1 shows estimates of U.S. working capacity for oil refineries before, during, and after Hurricane Harvey. Prior to landfall, more than 95 percent of refinery capacity was in operation, but that share fell sharply during the storm and stayed low through the end of August. The recovery in September has been steady, but even by the end of the month, working capacity had not yet returned to its pre-Harvey level.

Source: Federal Reserve Board staff calculations based on U.S. Department of Energy, Situation Reports
After incorporating the detailed information from the Dallas Fed and from DOE Situation Reports, Federal Reserve staff estimated that Hurricane Harvey reduced national refinery output by about 3-1/2 percent and reduced the change in total IP in August by 0.1 percentage point.
Crude Oil Extraction
The standard IP measures of crude oil extraction rely on the same weekly and monthly data sources from the EIA as the IP measures of refinery output. The initial estimate for IP in August reflects data from the Weekly Petroleum Status Report and this estimate will be updated when more detailed data from the Petroleum Supply Monthly become available.
As with the IP measures of refinery output, Federal Reserve staff used information from additional sources to estimate the share of monthly oil extraction (both onshore and offshore) that was lost because of Hurricane Harvey. Offshore oil production outages in the Gulf of Mexico, which were tracked carefully in DOE Situation Reports, peaked at about 430 thousand barrels per day, representing about 4-1/2 percent of total U.S. production. Hurricane Harvey affected onshore oil production in conventional oil fields near Houston and in the nearby Eagle Ford shale area. According to the Situation Reports, the Eagle Ford shale area lost between 300 and 500 thousand barrels per day, an estimate that was confirmed by staff at the Dallas Fed, who were in contact with Texas regulators and oil producers.3 Eagle Ford outages were particularly difficult to track, and some press reports estimated much higher outages.
Overall, the daily path of total oil outages was difficult to track precisely. In the weeks before the hurricane hit, crude oil extraction in the United States was averaging about 9.5 million barrels per day. Given the available data, a reasonable estimate is that the hurricane shut in 3/4 million barrels per day, on average, from August 25 to August 31, which cumulates to about 1-3/4 percent of monthly production. With a relative importance weight in IP of about 6-1/4 percent, lost oil extraction reduced the change in total IP in August by about 0.1 percentage point.
Natural Gas Extraction
The primary source data for the IP index for natural gas extraction come from the EIA's Natural Gas Monthly publication, which is typically available for the second revision to the IP index for a month. Before the EIA data are published, the IP index for natural gas extraction is unpublished, but daily data from Bentek Energy are used to construct preliminary estimates of output for the industry.
To determine effects of Hurricane Harvey on natural gas extraction, Federal Reserve staff used the DOE's Situation Reports and other sources to track daily outages of offshore and onshore production. The Situation Reports offered fairly detailed information on the amount of offshore production that was shut in, but its information on onshore outages needed to be supplemented by press reports and by other assumptions. According to these sources, at its peak, the storm shut in about 25 percent of natural gas extraction in the Gulf of Mexico and nearly one-half of all natural gas extraction in the Eagle Ford shale region. The Gulf accounts for about 3-1/2 percent of U.S. natural gas production and the Eagle Ford region accounts for about 6-3/4 percent. Combining all available data, it was estimated that the hurricane reduced overall natural gas extraction by about 0.9 percent, which held down the change in total IP by less than 0.05 percentage point.
Oil and Gas Drilling
The IP indexes for oil and gas drilling and support services rely in large part on a weighted total of weekly rig counts from Baker Hughes. In the early aftermath of the hurricane, the DOE Situation Reports published detailed rig outage information for the Gulf of Mexico; however, information on drilling activity in the Eagle Ford shale area was more difficult to obtain. When the Baker Hughes update for the week including September 1 was published, it stated that an updated status report was not possible for rigs operating in 47 counties in South Texas. Consequently, Federal Reserve staff judgmentally estimated an adjustment to the rig count for the last week in August based on information received from industry contacts and from the Dallas Fed. Taken together, these sources suggested that about 5 percent of U.S. rig activity--with higher weight given to the larger offshore rigs--was offline for the last several days in August. With its IP weight at about 1/2 percent, drilling and support reduced the change in total IP in August by about 0.01 percentage point.
Organic Chemicals
The petrochemical industry is heavily concentrated in the Gulf Coast region, and it was hit hard by Harvey. The IP index for organic chemicals typically reflects two separate data sources, a quarterly report on petrochemical production from the National Petrochemical Refiners Association and weekly data on rail car loadings of chemicals from the Association of American Railroads. The railcar loadings data are very timely and serve as a preliminary indicator of IP until the quarterly data become available; they also used to provide information for the monthly movements of IP within a quarter.
To calculate the effect of Hurricane Harvey on IP for organic chemicals, Federal Reserve staff relied on daily plant-level reports from PetroChem Wire, a daily news source for organic chemicals and plastic resins. For each plant in the Harvey-affected region, these reports included information on its capacity as well as whether the plant was shut down, restarting, operating at reduced rates, or operating at normal rates. As with the reports on petroleum refineries, Federal Reserve staff made assumptions about the operation rates for those plants listed as "restarting" or "operating at reduced rates" and aggregated the plant-level rates (using individual plant capacity as weights) to industry-level totals.
Averaging over the month, Federal Reserve staff estimated that the hurricane reduced U.S. output of petrochemicals by about 8 percent in August. The industry represents about 2-1/4 percent of total IP, so the hurricane-related reduction in production reduced the rate of change in total IP by about 0.2 percentage point.4
Plastic Resins
The effect of Hurricane Harvey on the output of the plastic resin industry was calculated in the same way as the effect on the organic chemicals industry. The standard data used to measure IP for resins are from a monthly publication from the American Chemistry Council that reports pounds of resins produced. These data are available for the second estimate of IP; until then, the IP index is based on production worker hours and other information about the industry.
Like the petrochemical industry, a high proportion of the plastics resins industry is located in the hurricane-affected areas in Texas and Louisiana, and because of storm-related shutdowns, about half of the industry's capacity was offline in late August. Using the daily plant-level data and averaging across the entire month, it was estimated that Hurricane Harvey caused the shut-in of about 7-1/2 percent of resins output in August. With an IP weight of about 0.8 percent, Federal Reserve staff estimated that outages of plastic resins reduced the change in total IP in August by about 0.06 percentage point.
Chart 2 shows working U.S. capacity for organic chemicals and for resins as estimated by Federal Reserve staff. Prior to Harvey's landfall, about 90 percent of capacity was in operation; as the days passed, more capacity was shut in, and by the end of August, less than half was available. Since then, several plants have resumed operating at normal rates, but, even well into September, working capacity in both industries has remained below pre-Harvey levels.
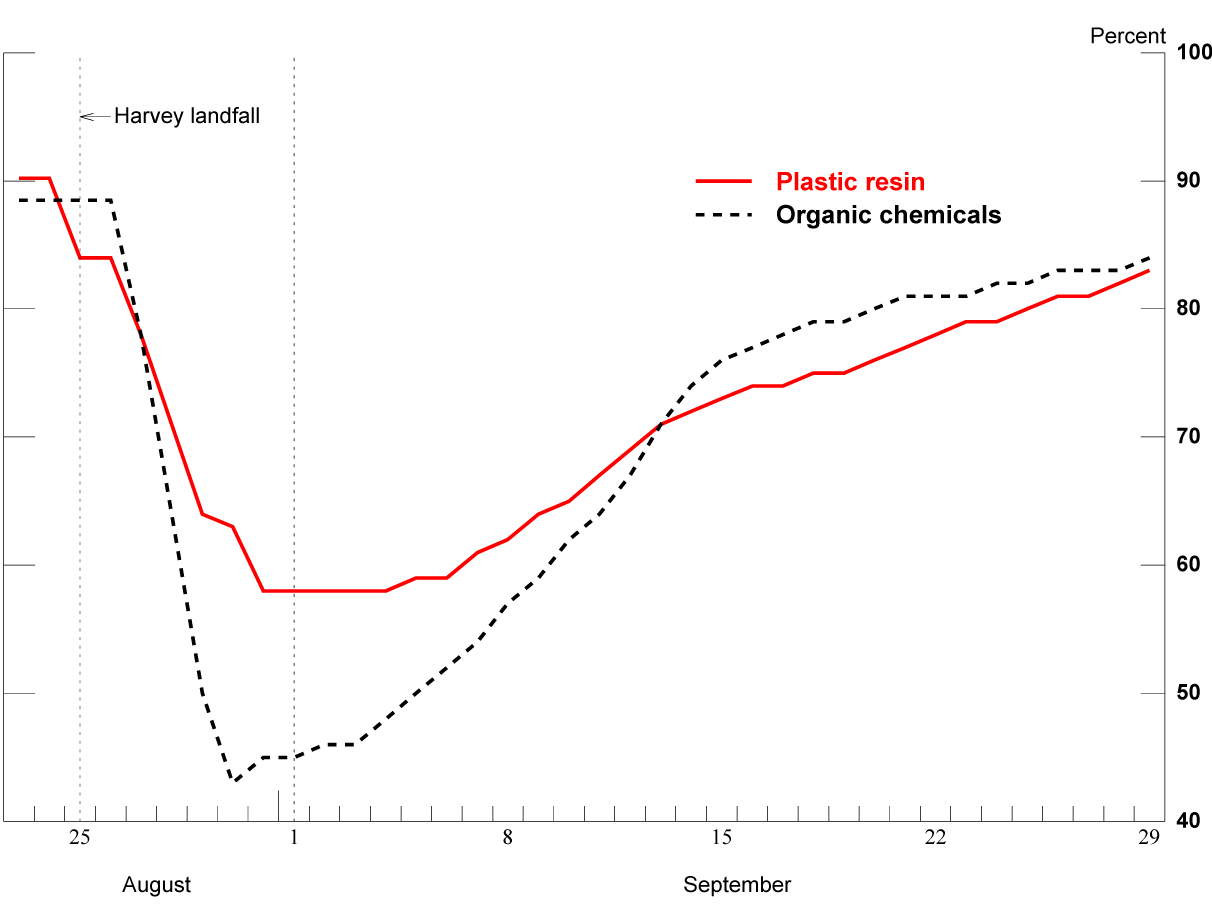
Source: PetroChem Wire, Chemical Plants database
Estimating the Effects of Hurricane Harvey for other industries
Most industries, however, neither are as concentrated in the area affected by Hurricane Harvey nor have such direct, timely information as for the industries discussed above.5 For industries where direct, timely data were unavailable, Federal Reserve staff estimated the effect of the storm on IP through a procedure that has been used for a number of other natural disasters and is described below.6 The procedure is applied to those industries (about 40 percent of IP) in which the output indexes are based on production worker hours from the BLS. The procedure is also applied to the initial estimates for industries in which the output indexes rely on direct product data that are not available at the time of publication.
For the indexes that depend on production worker hours, a natural disaster in the month can affect the interpretation of the raw data. The data on production worker hours cover the pay period containing the 12th of a month rather than a full month. This presents a problem for measuring the impact of Hurricane Harvey because of its landfall in late August--the pay period for most reporters would have ended before Hurricane Harvey affected them; that is, the worker-hour data for August would bear no imprint of the hurricane.
For industries without direct, timely data, the procedure to estimate IP and the effect of Hurricane Harvey on IP followed a series of steps. First, a group of counties were identified as being the area affected by Hurricane Harvey, with counties assigned a rating from 0 to 1 indicating the severity of the impact. In this case, the counties targeted for FEMA assistance (considered to be the most affected) were assigned a weight of 1, and the counties declared as disaster areas by the State of Texas were assigned a weight of 0.5. These severity weights are then applied to the share of U.S. employment in an industry that was located in the affected counties, which was based on the Census Bureau's County Business Patterns. Then an estimate was made of the share of monthly production that businesses in the most severely affected counties would not be able to make up over the course of the month. In the case of Harvey, that was roughly 20 percent of the monthly production; because the hurricane hit toward the end of the month, any make-up in production likely did not occur until September. The product of the lost production share and the employment share in the affected region provides an estimate of the reduction in IP due to the storm. These are necessarily rough estimates of the actual effect, but they allow for timely estimation with easily understandable assumptions.
In sum, for the industries that did not have detailed high-frequency data available, it is estimated that Hurricane Harvey held down the change in output by about 1/4 percentage point in August.
Looking Ahead--Storm Effects in September
On October 17, the Federal Reserve will publish estimates of industrial production for September. Both Harvey and Irma, which struck Florida on September 10, affected output in the month, and pulling together estimates of IP will present a number of challenges. Several plants that shut down at the end of August because of Harvey remained closed into September; indeed some have still not reopened. As the situation has improved, there is generally less demand for detailed, timely data, so it is more difficult to obtain information on the timing of resumption of operations.
In addition, Hurricane Irma caused severe disruptions in Florida in September, and estimating its effects will be somewhat different than for Hurricane Harvey.7 In particular, industrial activity in Florida is not particularly concentrated in any industry, so timely data covering major areas of activity are not available. Furthermore, Irma hit earlier in the month than Harvey did and is therefore more likely to have directly affected the readings on production worker hours reported to the BLS.8 Finally, because Irma hit early in September, it will be necessary to make assumptions about the share of output that producers were able to make up before the end of the month. All these considerations will be reflected in the initial estimates of industrial production for September.
1. The DOE's Situation Reports are available on their energy.gov website. As stated on the website, the Situation Reports "provide details on the storms' impacts, and the energy industry's recovery and restoration activities being undertaken." Return to text
2. As a check on the daily updates, Federal Reserve staff used data from the National Establishment Time Series (NETS) database overlaid with floodplain maps from FEMA as another measure of the share of an industry that was likely affected by the hurricane. NETS is a national database of establishments that includes detailed information on geography (street address, longitude and latitude) and industry. The NETS results closely matched the results from Census Bureau's County Business Patterns. In future analyses, NETS may be used more extensively. Return to text
3. In particular, we thank the Dallas Fed's energy team for regular updates. Return to text
4. These figures refer to organic chemicals excluding ethanol, or NAICS 32511 and 32519 excluding 325193. Return to text
5. One exception in terms of industry concentration is oil and gas field machinery (NAICS 333132), in which about 40 percent of U.S. employment is in the affected region. Return to text
6. The procedure was first employed more than 10 years ago, and it has been used and refined numerous times since then. It is detailed in a Federal Reserve Bulletin article from 2009, an Annual Revision article for 2013, and Technical Q&As from November 2012 and February 2014. Return to text
7. The devastation wrought on Puerto Rico by Hurricane Maria will have no direct effect on IP, as the geographic scope of IP is limited to the 50 states and the District of Columbia. Return to text
8. The timing of a hurricane, or any other major disruption to activity, significantly affects the interpretation of the data on production-worker hours, which reflects a survey covering the pay period containing the 12th of the month. In the presence of a hurricane (such as Harvey) that hits at the end of the month, production-worker hours would show no imprint of disruptions during the month and would tend to overstate economic activity. In the presence of a hurricane (such as Irma) that hits during the BLS survey period, hours worked would likely be held down and a straight read of the data would tend to understate economic activity. Return to text
Bayard, Kimberly, Ryan Decker, and Charles Gilbert (2017). "Natural Disasters and the Measurement of Industrial Production: Hurricane Harvey, a Case Study," FEDS Notes. Washington: Board of Governors of the Federal Reserve System, October 11, 2017, https://doi.org/10.17016/2380-7172.2086.
Disclaimer: FEDS Notes are articles in which Board staff offer their own views and present analysis on a range of topics in economics and finance. These articles are shorter and less technically oriented than FEDS Working Papers and IFDP papers.