FEDS Notes
October 19, 2017
Oil Price Pass-Through into Core Inflation1
Cristina Conflitti and Matteo Luciani
This note was revised on April 29, 2019 to correct the data table for Figure 1 on the accessible page. The previous version omitted the second table which describes the common component depicted in the right panel of the image.
Quantifying the magnitude and establishing the timing of the pass-through of oil price changes to consumer prices is crucial for forecasting inflation. Characterizing this pass-through is particularly important because oil prices tend to undergo wide fluctuations. Consider the recent plunge of oil prices from July 2014 to February 2016, from about $100 per barrel to $30. What is the effect of such a large swing in oil prices on core inflation? And how long will this effect last?
Various authors have estimated the pass-through of oil price changes to core prices and the general consensus is that since the mid-eighties it has declined, to the point that it is very limited if not zero (for example Hooker, 2002; Cavallo, 2008; Chen, 2009; Clark and Terry, 2010).
Compared to this literature, we use a novel econometric approach to estimate the oil price
pass-through, and we conclude that oil price fluctuations have a limited but long lasting effect on core inflation. According to our estimates the recent plunge in oil prices shaved-off just a couple of tenths of a percentage point from core inflation in both the US and the euro area, but this effect is far from being fully absorbed as it will only vanish by 2020.
Methodology
Before discussing the methodology, it is helpful to understand how oil price changes affect core prices. In theory, an increase in oil prices could affect inflation through one of two channels: first, it might have a direct (or idiosyncratic in our modeling framework) effect because energy prices represent a, sometimes considerable, portion of production costs. Second, because changes in oil prices contribute to macroeconomic fluctuations, changes in oil prices could have an indirect (or common/macroeconomic in our modeling framework) effect on inflation (see Hamilton, 1983, 2003; Hooker, 1996; Barsky and Kilian, 2002; Kilian, 2008, among others).
Our method is based on Dynamic Factor models and VAR analysis and it allows us to disentangle the idiosyncratic (direct) effect that an oil price change might have on each disaggregate price, depending on the product's energy intensity, from the common/macroeconomic (indirect) effect that an oil price change has on all prices. We first estimate a dynamic factor model on a panel of disaggregate prices, which allows us to disentangle common changes in disaggregate prices due to macroeconomic fluctuations from idiosyncratic changes due to sector specific characteristics. We next use VAR techniques to estimate the oil price pass-through via the common component, as well as via the idiosyncratic component.2 Technical details on the methodology are available in the working paper version of this note.
Empirical analysis
Our empirical analysis is carried out on a panel of 88 US Personal Consumption Expenditure (PCE) disaggregate price indexes, and on a panel of 88 euro area (EA) Harmonized Index of Consumer Prices (HICP) at a disaggregate level. The model is estimated on a sample starting on January 1999 and ending in June 2016.3
Idiosyncratic (Left) / Common (Right)
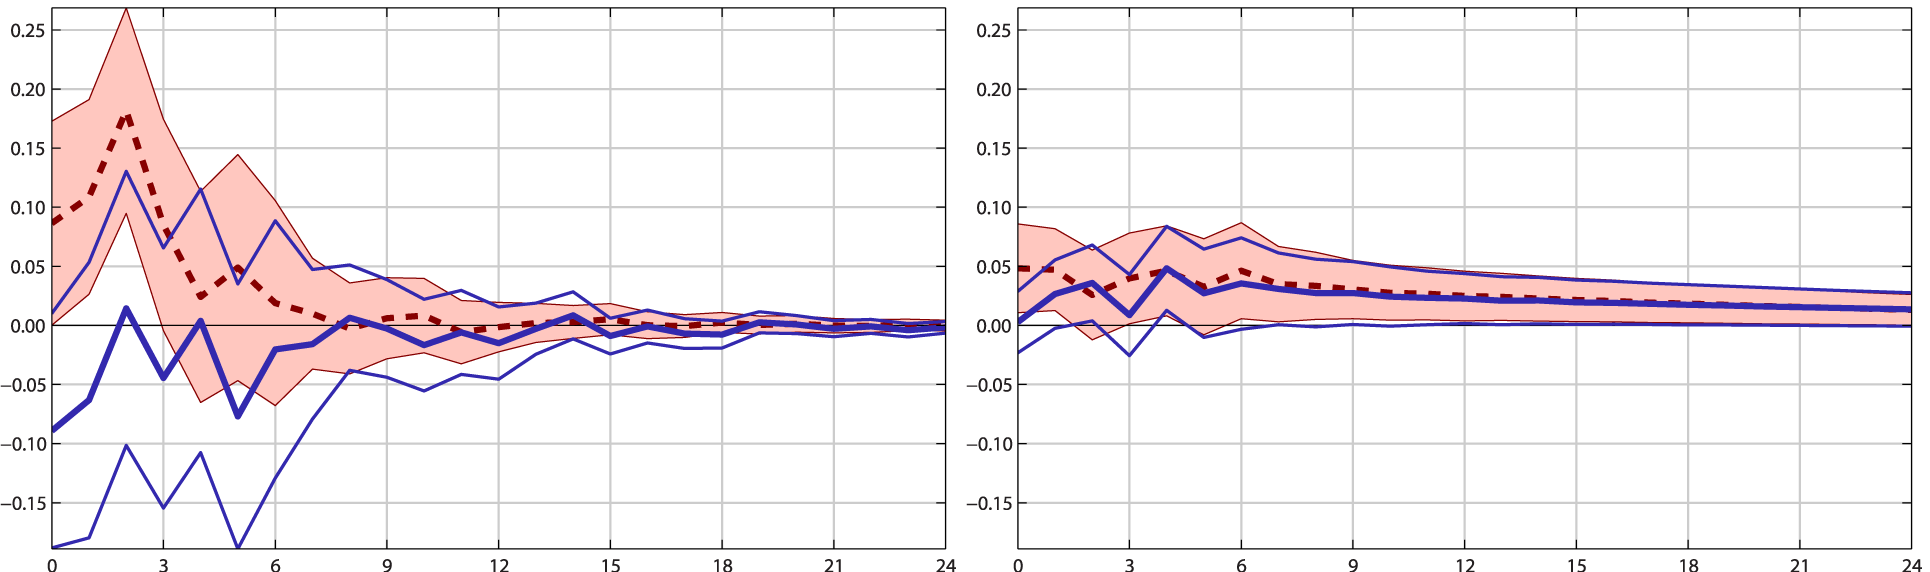
Notes: The right plot show the pass-through of an unexpected 10% increase in the real oil price into the common component, while the left plot show the pass-through into the idiosyncratic component. On each plot the thick blue line is the point estimate for the EA, while the thin blue lines are the 90% confidence bands. Likewise, the dotted red line and the shaded area are the point estimate and the confidence bands for the US, respectively. The x-axis represents months after the oil price increases, while the y-axis represents percentage points.
Figure 1 reports the estimated oil price pass-through in the US and in the EA, where the left plot shows the estimated idiosyncratic (direct) pass-through, and the right plot shows the common/macroeconomic (indirect) pass-through. By looking at Figure 1 it is clear that disentangling these two components is crucial when estimating the oil price pass-through into core inflation, as the estimated pass-through into the idiosyncratic component is not statistically different from zero,4 whereas the pass-through via the common component is small, but statistically different from zero, and long lasting.
Having estimated the pass-through from oil prices to price inflation, we can calculate what the oil price contribution to core PCE price inflation and HICP inflation was, respectively. Figure 2 shows the average contribution per year of changes in the oil price to core inflation in both the US and the EA up to 2020. We estimate that the plunge in the oil price shaved-off approximately two tenths of a percentage point from core inflation in 2015 and 2016, that is, in both 2015 and 2016 core inflation was 0.2 percentage points lower than it would have been. The drag from oil prices will persist in 2017 and 2018 (approximately 5 basis points), but it will fade away by 2019.
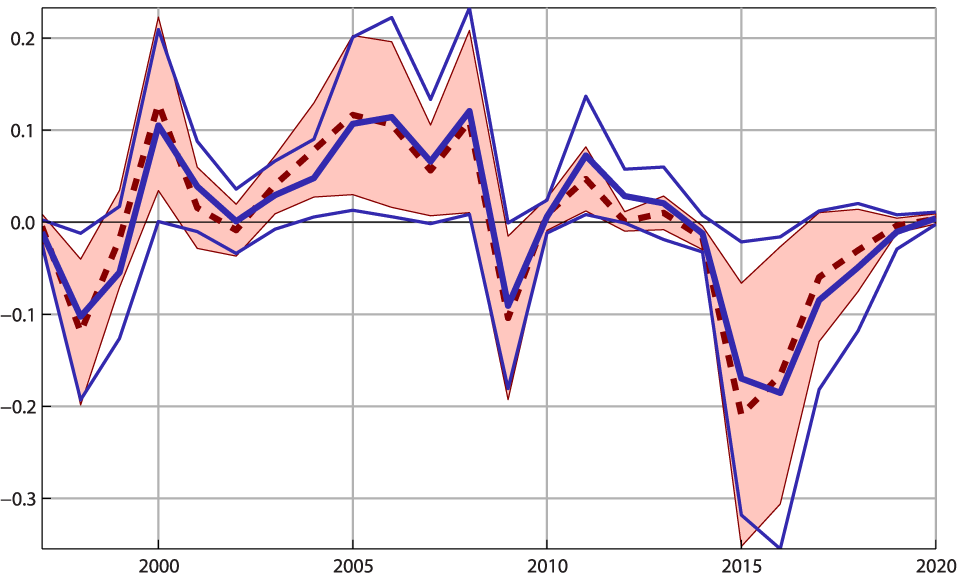
Notes: This plot shows the average contribution per year of real oil price to core HICP inflation measured in percentage points (y-axis). The thick blue line is the point estimate for the EA while the thin blue lines are the 90% confidence bands. Likewise, the dotted red line and the shaded area are the point estimate and the confidence bands for the US, respectively.
Conclusions
In this note we presented estimates of the oil price pass-through into consumer prices both in the US and in the euro area. The results presented here are based on a novel econometric approach based on dynamic factor models and VARs. Thanks to this approach we were able to distinguish between the direct (idiosyncratic) effect that oil price changes might have on each disaggregate price, and the indirect (common/macroeconomic) effect that oil price changes might have since they contribute to macroeconomic fluctuations. Disentangling these two effects proved crucial, as we estimate that there is essentially no oil price pass-through into core inflation via the idiosyncratic component, while the pass-through via the common component is small, but statistically different from zero and long lasting.
References
Barsky, R. B. and L. Kilian (2002). Do we really know that oil caused the great stagflation? A monetary alternative. In NBER Macroeconomics Annual 2001, Volume 16.
Cavallo, M. (2008). Oil prices and inflation. Economic Letter 2008-31, Federal Reserve Bank of San Francisco.
Chen, S.-S. (2009). Oil price pass-through into inflation. Energy Economics 31, 126–133.
Clark, T. E. and S. Terry (2010). Time variation in the inflation pass-through of energy prices. Journal of Money, Credit and Banking 42, 1419–1433.
Hamilton, J. D. (1983). Oil and the macroeconomy since World War II. Journal of Political Economy 91, 228–248.
Hamilton, J. D. (2003). What is an oil shock? Journal of Econometrics 113, 363–398.
Hooker, M. A. (1996). What happened to the oil price-macroeconomy relationship? Journal of Monetary Economics 38, 195–213.
Kilian, L. (2008). Exogenous oil supply shocks: how big are they and how much do they matter for the U.S. economy? Review of Economics and Statistics 90, 216–240.
1. This note is a shorter and less technical version of Conflitti, Cristina, and Matteo Luciani (2017). "Oil price pass-through into core inflation," Finance and Economics Discussion Series 2017-085. Washington: Board of Governors of the Federal Reserve System, https://doi.org/10.17016/FEDS.2017.085. Return to text
2. The benchmark specification includes one factor and six lags for the VARs. Return to text
3. The price data for the US are monthly price indexes for personal consumption expenditures (PCE) by type of product. The data are taken from the NIPA Table 2.4.4U from the Bureau of Economic Analysis. The price data for the euro area are monthly Harmonized Indexes of Consumer Prices (HICP) available from Eurostat. When the model is estimated for the US, the oil price is measured by the West Texas Intermediate (WTI) spot crude oil price, which is deflated by the core PCE price index. When the model is estimated for the EA, the oil price is measured by the Brent spot crude oil price, which is deflated by the HICP core price index. Return to text
4. The idiosyncratic pass-through estimated for the US shown in Figure 1 is, indeed, statistically different from zero, both one month, and two months after the shock. Note, however, that this result is not robust, as the estimated pass-through is not statistically different from zero when the model is estimated on a longer sample (see the working paper version of this note). For this reason we state that "the estimated pass-through into the idiosyncratic component is not statistically different from zero". Return to text
Conflitti, Cristina, and Matteo Luciani (2017). "Oil price pass-through into core inflation," FEDS Notes. Washington: Board of Governors of the Federal Reserve System, October 19, 2017, https://doi.org/10.17016/2380-7172.2066.
Disclaimer: FEDS Notes are articles in which Board staff offer their own views and present analysis on a range of topics in economics and finance. These articles are shorter and less technically oriented than FEDS Working Papers and IFDP papers.