FEDS Notes
August 29, 2023
Price-Setting During the Covid Era
Hugh Montag and Daniel Villar1
1. Introduction
The Covid-19 pandemic has had enormous effects on every aspect of the economy, including inflation which has become one of the most pressing economic problems of the recovery period. Although inflation fell significantly at the onset of the pandemic, the increase seen since early 2021 has brought inflation to levels not seen since the 1980's. While the inflationary surge has captured the attention of economic policymakers, academics, and commentators, there has so far been little documentation of individual price-setting dynamics that have been behind this surge and how these dynamics may or may not have changed.
In this note we present a series of statistics related to "micro" price-setting behavior in the US and document how they have evolved since the start of the pandemic. These statistics have been extensively studied before the pandemic by a large literature on individual price adjustment and used to gain insight into the drivers behind inflation dynamics and the conduct of monetary policy.2 By documenting facts related to these statistics during the current inflationary surge, we will shed some light on what this episode of high inflation reveals about the price setting constraints faced by firms and on the relative importance of aggregate, sectoral, and firm-specific shocks in driving inflation during this period.
2. Consumer Price Index (CPI) Micro Data
Our analysis is based on the Bureau of Labor Statistics' CPI Commodities and Services Pricing Survey microdata (C&S). The C&S regularly samples price quotes of about 94,000 products and services each month. The C&S includes most types of goods and services, but notably excludes some components such as shelter and medical insurance.3 In total, the dataset samples prices from goods and services that comprise around 70% of the CPI, according to the CPI weights which are based on the Consumer Expenditure Survey. The C&S has been collected for a long period of time, which facilitates comparisons between the Covid era and earlier periods of elevated inflation. The C&S also has the advantage of tracking specific products sold at specific outlets over time. This makes it possible to accurately identify price changes that are not due to changes in product features.
We classify the sector of each good or service according to its Elementary Level Index (ELI) as defined by the BLS.4 We calculate most statistics through a two-step process. First, we create a statistic for each ELI category (e.g. frequency of price changes for AA011, "men's suits"). Second, we aggregate the statistic across ELI's by computing the weighted mean or median. We use ELI-level expenditure weights derived from the 2018 Consumer Expenditure Survey.
We present trends on the frequency of price change, the average absolute price change among non-zero price changes (or the "size of price changes"), and the standard deviation among non-zero price changes.5 We will also present the frequency and size statistics for price increases and decreases separately. Finally, because these series contain seasonal variation, we seasonally adjust our time series using the Census Bureau's X-13 procedure.
The frequency of price change for ELI $$k$$ in month $$t$$ is given by:
$$$$ fr_{kt} = \frac{\sum_{i \epsilon K_t} 1(\Delta p_{it} \neq 0)}{N_{kt}} $$$$
, where $$ K_t $$ is the set of products in ELI $$k$$ for which a price is observed in months t and t-1. $$ N_{kt} $$ is the number of products in that set, and 1(.) is an indicator function. The average size is given by:
$$$$ s_{kt} = \frac{\sum_{i \epsilon K_t} \Delta log(p_{it})}{\sum_{i \epsilon K_t} I(\Delta p_{it} \neq 0)} $$$$
The average absolute value is defined in the same way but using the absolute value of the change in the log price in the calculation.
2.1 The Frequency and Size of Price Changes
As inflation began to rise in 2021, firms began updating their prices more rapidly and by larger amounts . Figure 1 displays the frequency and size of price changes during the Covid pandemic, along with the 12-month percent change in the CPI. We graph a further two years of data before the pandemic for comparison, while still emphasizing the pandemic period. We follow Nakamura and Steinsson 2008 in focusing on the median frequency of price changes across ELI's, as these are more representative of pricing behavior. For the size of price changes we use the mean across ELI's. We present the statistics excluding temporary sales.
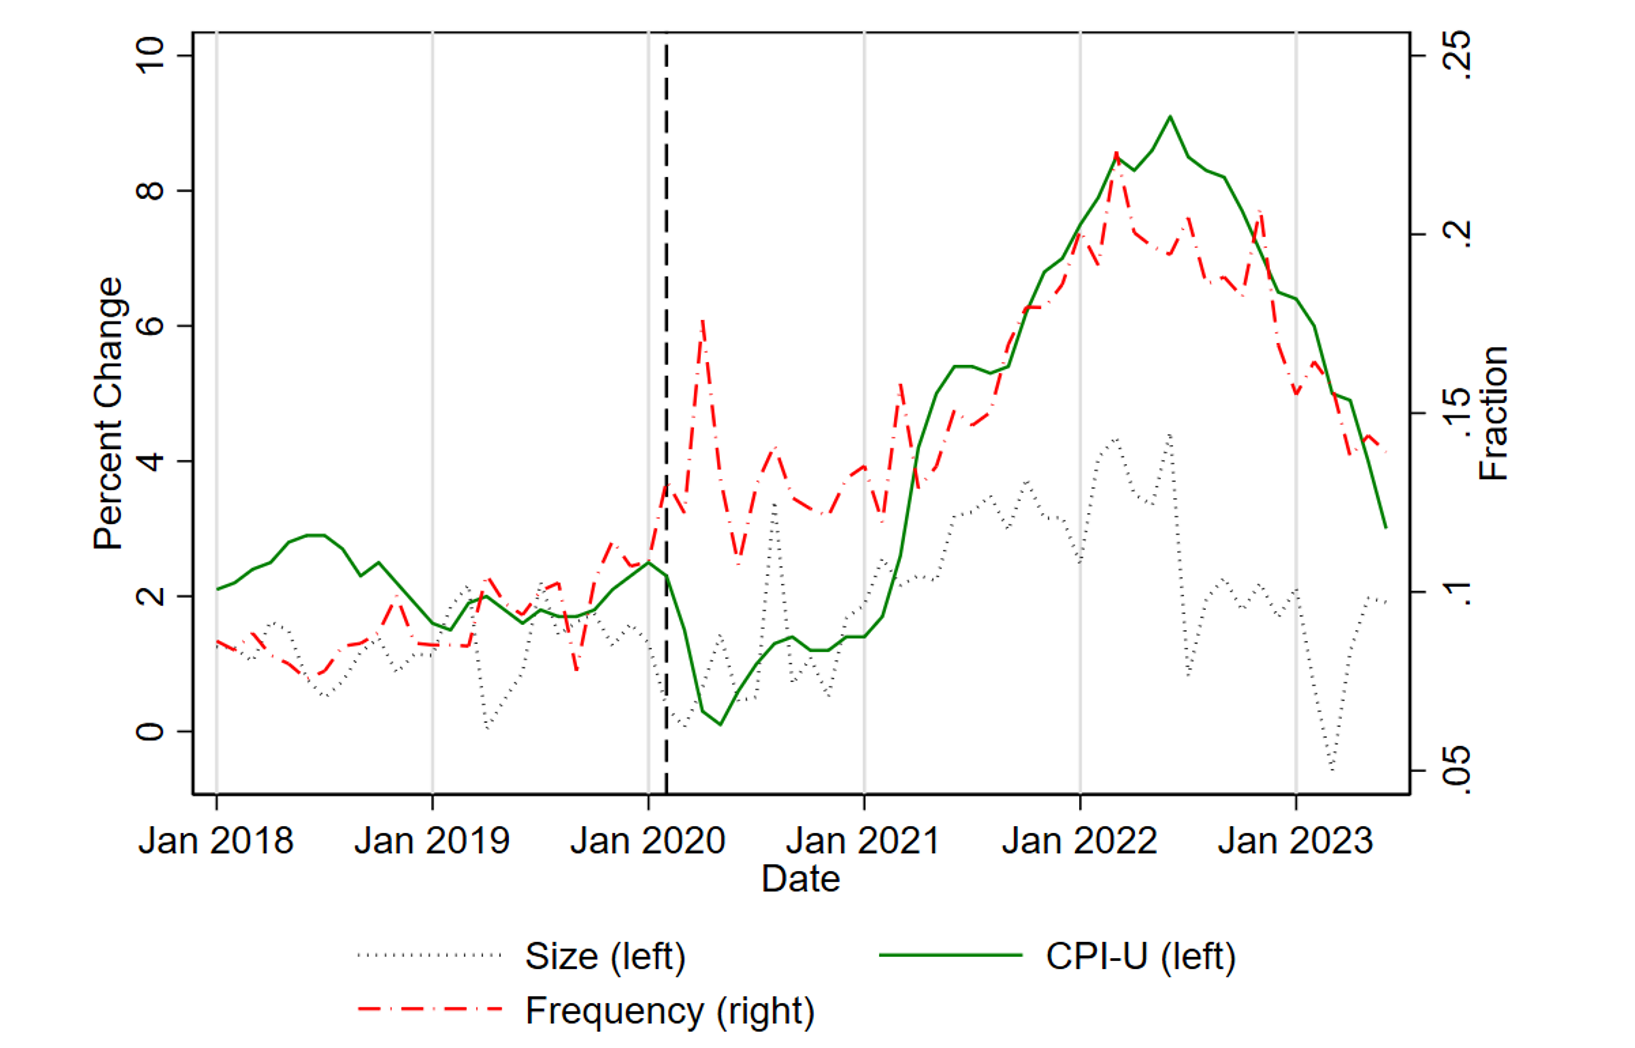
Note: Vertical dashed line marks the start of the pandemic period in February 2020.
Source: BLS and authors’ calculations
As shown in Figure 1, the frequency of price changes rises in late 2019 and early 2020, and then remains at an elevated level until early 2021, after which it increases more substantially. Note that while overall inflation was low during this early pandemic period, firms in all sectors were facing major changes to the demand and supply conditions in which they operated. It is therefore perhaps not surprising that even though the environment was not yet very inflationary, prices had begun adjusting more frequently. However, it is once inflation starts to rise in 2021 that the frequency increases more, and once inflation starts to fall in 2022, so does the frequency. Since the start of 2022, the frequency of price changes has fallen from around 0.2 (suggesting prices change once every 5 months, on average, almost twice as frequently as before the pandemic started) to just below 0.15, slightly higher than the usual pre-pandemic level.
The size of price changes remained relatively flat through 2019 and 2020, fluctuating between 1.5 % and 2 %. The size then moves up through 2021 and fluctuates between 2 and 4 % through mid-2022, before declining below 2 %. This captures the intensive margin of price adjustment: the prices that change increase by more on average as inflation takes off in 2021, and then by less as inflation subsides.
Figure 2 shows that the magnitude (or absolute value) of price changes has been stable since 2018. Although the median absolute value of price changes (in black) spiked in the early months of the pandemic in 2020, it quickly fell back to a level only slightly higher than where it had stood before. Since then, it has fluctuated around 8 %, with no clear relationship with overall inflation. This is in sharp contrast to the frequency of price change, as discussed above.
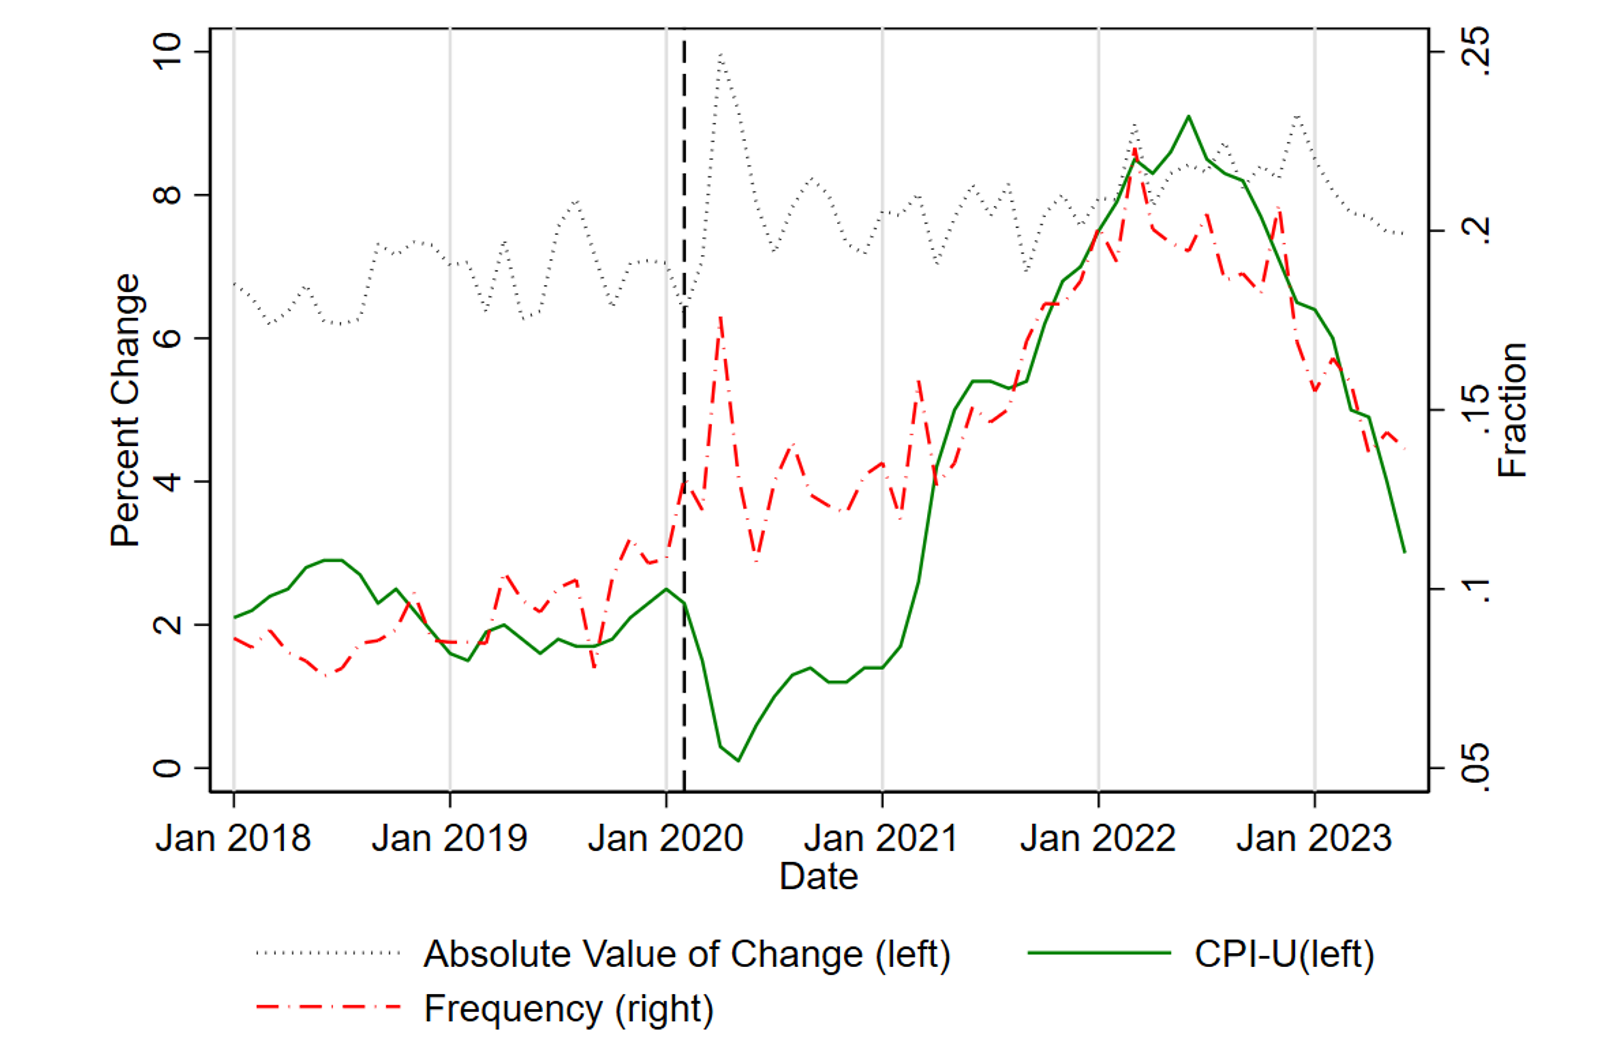
Note: Vertical dashed line marks the start of the pandemic period in February 2020.
Source: BLS and authors’ calculations
To shed more light on what is behind the frequency and size patterns, we turn to measures of the frequency and size of price change decomposed into price increases and decreases, which are calculated in the same way as the overall frequency and size statistics.
Firms have responded to the pandemic and subsequent inflation by adjusting the frequency of price increases, while keeping the frequency of decreases constant, as shown in Figure 3. The frequency of decreases (blue line) remained very stable throughout the period shown, rising only modestly at the start of the pandemic and then declining a year later. Somewhat surprisingly given the high levels of inflation, the frequency of declines now stands a touch higher than in the few years before the pandemic. Meanwhile, the frequency of increases (red line) rose only modestly in early 2020, and then much more throughout 2021. It peaked in 2022 at a level about twice that seen before the pandemic, and then fell to a level only slightly higher than the pre-pandemic one. To summarize, while both the frequency of increases and decreases contributed to the slight increase in the overall frequency in 2020, the larger rise in 2021 was due entirely to price increases becoming more frequent. Similarly, as inflation has fallen in the past year, it is the frequency of increases that has moved down while the frequency of decreases has remained stable.
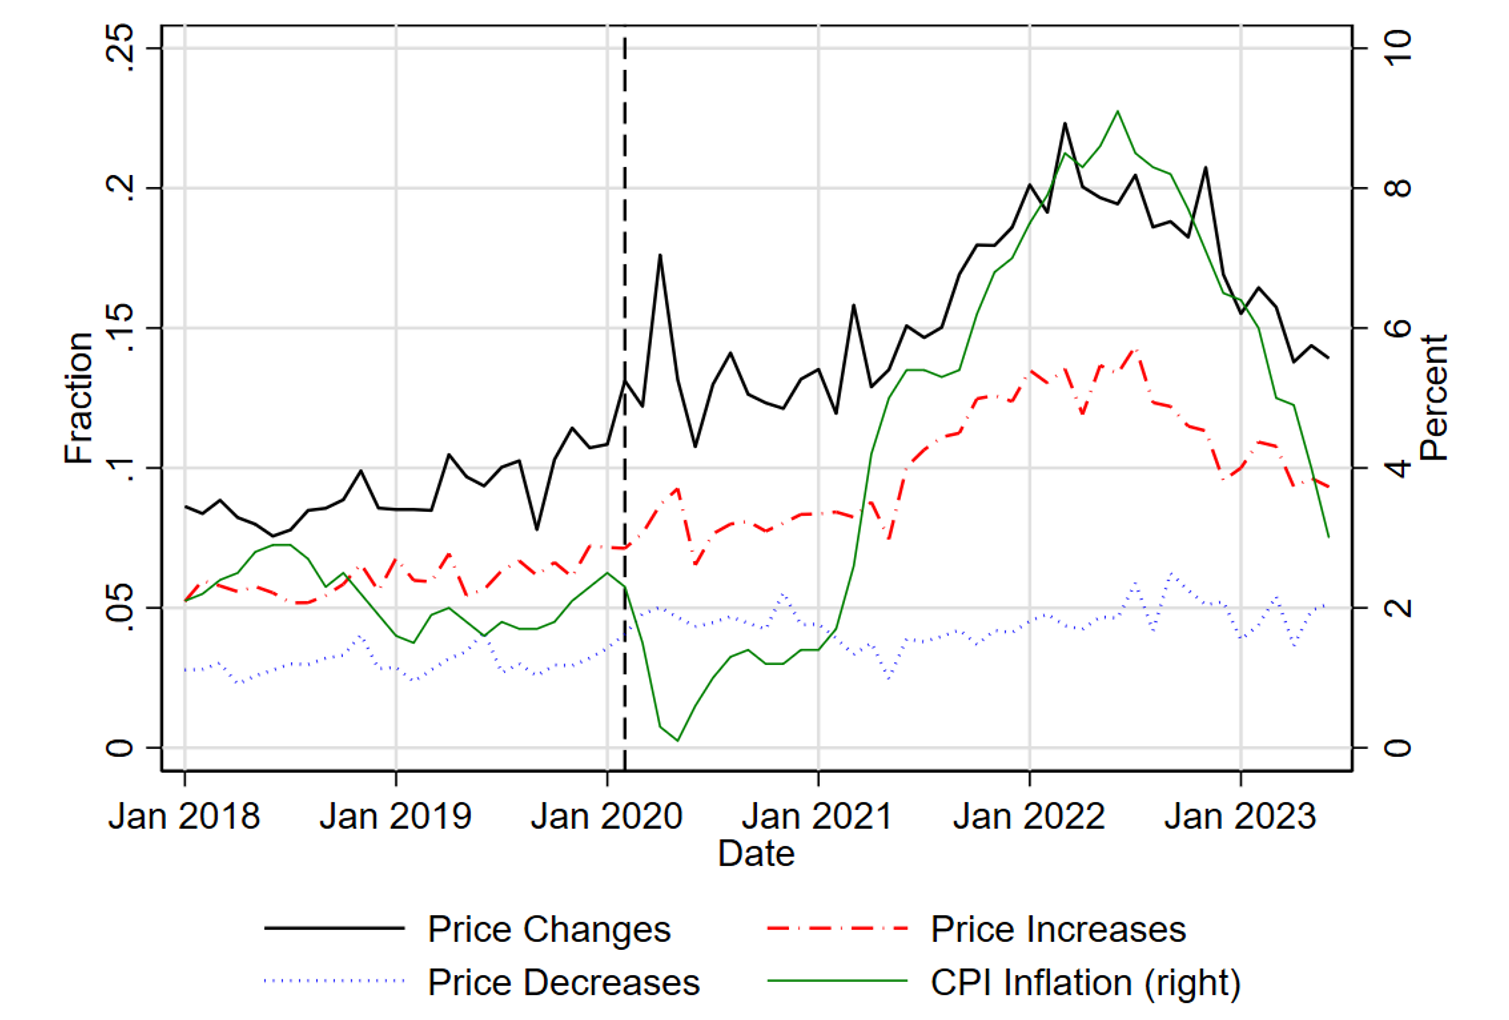
Note: Vertical dashed line marks the start of the pandemic period in February 2020.
Source: BLS and authors’ calculations
The magnitudes of price increases and price decreases are volatile, but do not show any clear structural break during the pandemic or subsequent inflation. We decompose the average size of price change into price increases and decreases, seasonally adjust them, and plot the results in figure 4. The average size of price decreases has seen a few ups and downs since early 2020 and seems to recede to levels close to the pre-pandemic average after each increase. The size of increases saw a very large jump in the middle of 2020 before stepping down. The series was then quite stable through most of 2021 but then increased sharply at the start of 2022 before stepping back down again most recently.
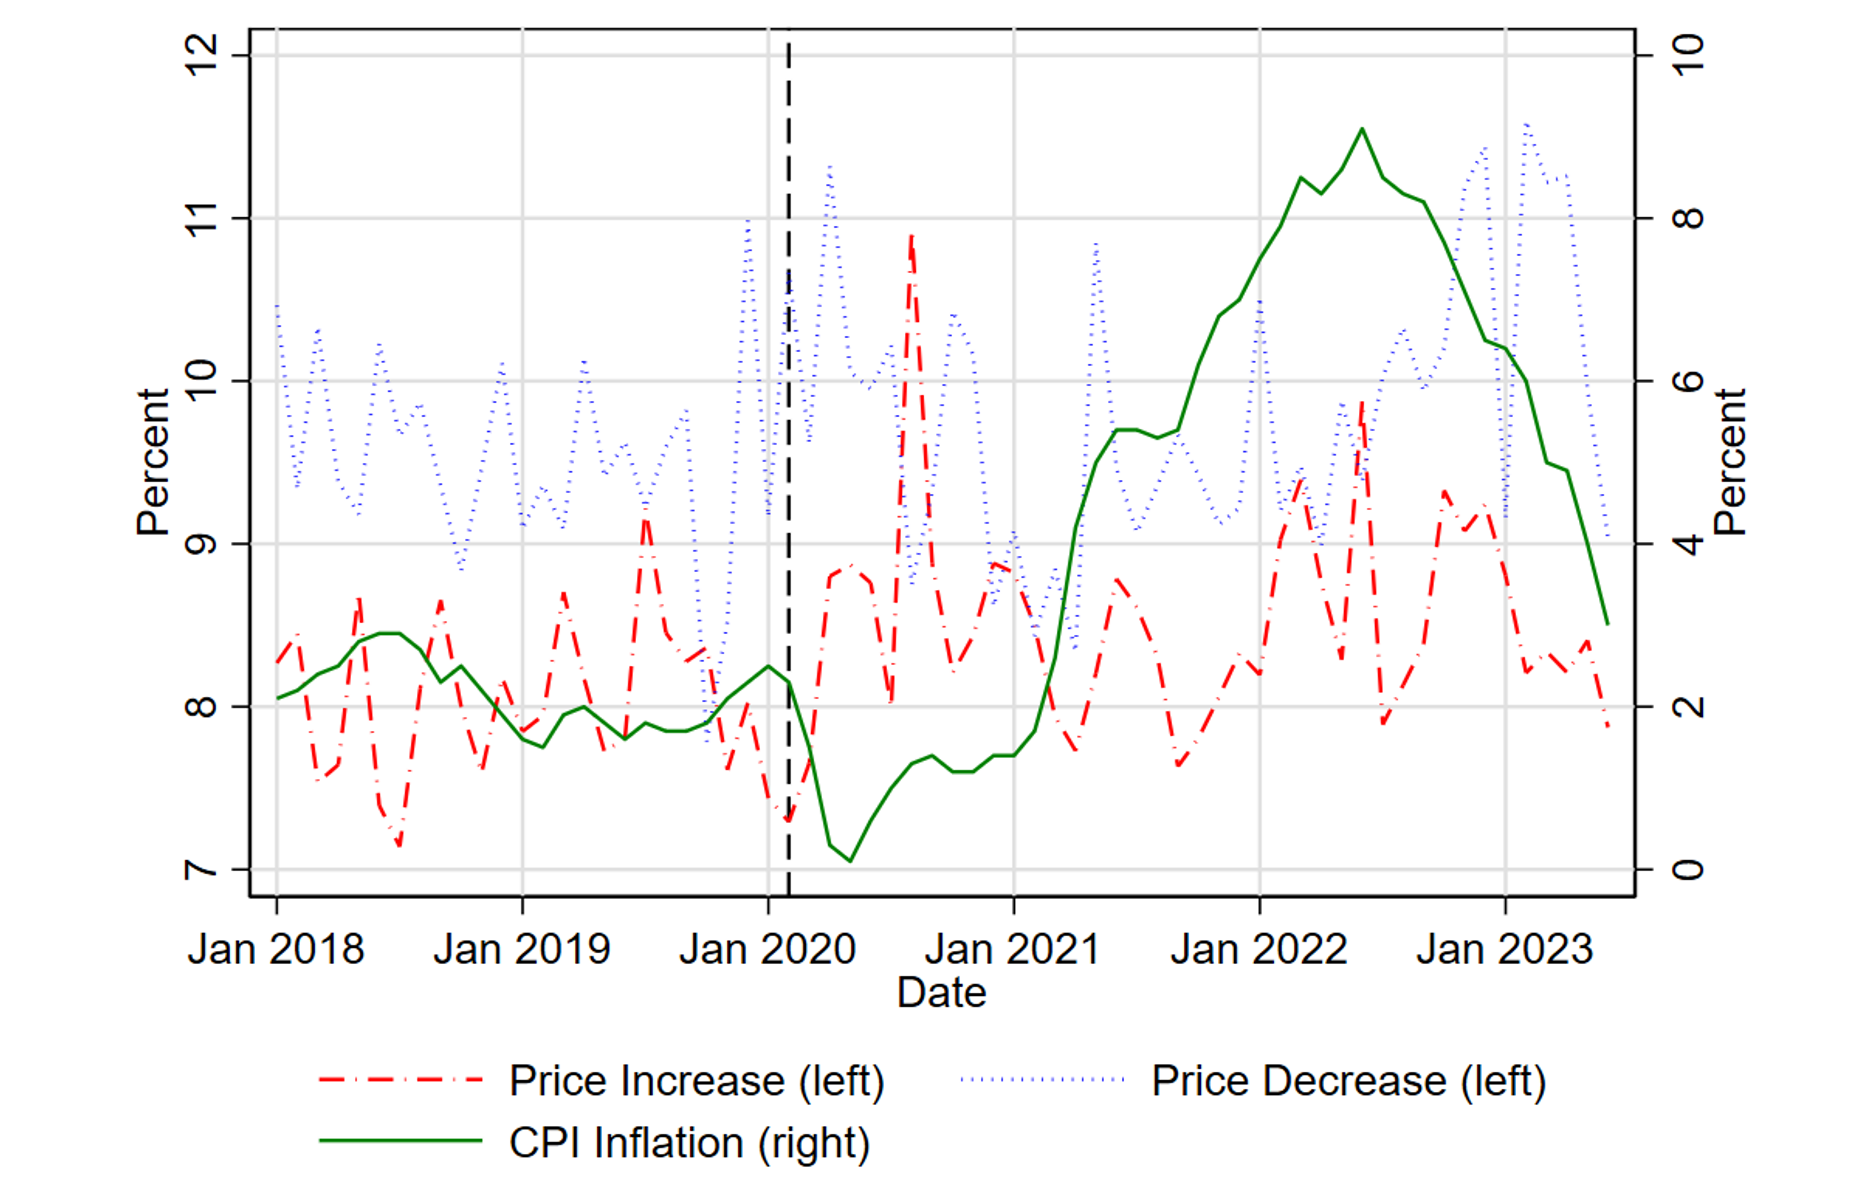
Note: Vertical dashed line marks the start of the pandemic period in February 2020.
Source: BLS and authors’ calculations
2.2 The Intensive and Extensive Margin of Inflation
The previous section's graphs suggest that price increases, particularly the frequency of price increases, explain the recent behavior of inflation. We use a common exercise to test this quantitatively. We evaluate whether variations in the frequency of price changes or the size of price changes play a larger role in explaining variation in inflation over the course of the pandemic. As in Klenow and Kryvtsov 2008, we view inflation as a combination of the frequency of price change (the extensive margin) and the size of price changes (the intensive margin):
$$$$ \pi_t = fr_t \cdot dp_t $$$$
We decompose the inflation rate over the course of the pandemic between the frequency of price changes and the size of price changes. We calculate an inflation rate for each ELI category separately, and then aggregate the inflation rates together using the 2018 Consumer Expenditure weights. Because of the limitations of the data and differences between the CPI Research Database and official CPI-U, we construct our own inflation metrics from the CPI Research Database. We construct two counterfactual inflation rates to illustrate the role of frequency and size in determining aggregate inflation. The first is the case where the frequency of price changes is held constant at the January 2020 level, while the size of price changes varies. The second counterfactual inflation is where the size of price changes is held constant at the January 2020 level while frequency is permitted to vary. We refer to these two measures as the fixed frequency inflation and the fixed size inflation, respectively. Note that the "size" used in these calculations is the series shown in Figure 1, and not the absolute value series from Figure 3, which changes little. The equations for these are:
$$$$ \pi_{tf} = f \bar{r} \cdot dp_{t} , \pi_{ts} = fr_t \cdot d\bar{p}$$$$
Figure 5 shows these two series along with the inflation rate that we construct as described above. Almost the entirety of the movement in inflation is driven by movements in the size of price changes. Indeed, while the overall frequency of price change increased substantially over the pandemic period, as shown in Figure 1, these changes explain almost none of the variation in inflation over this period as seen from the "fixed size" series being essentially flat. The rise in the share of price changes that are increases, along with the increasing size of price increases, have pushed up the average size of price changes, whose increase explains almost all the variation in overall inflation since the start of the pandemic. In addition, the effect of changes in the frequency are muted by the small average value of the size of price changes in the "fixed size" series, which helps explain why that series moves little.
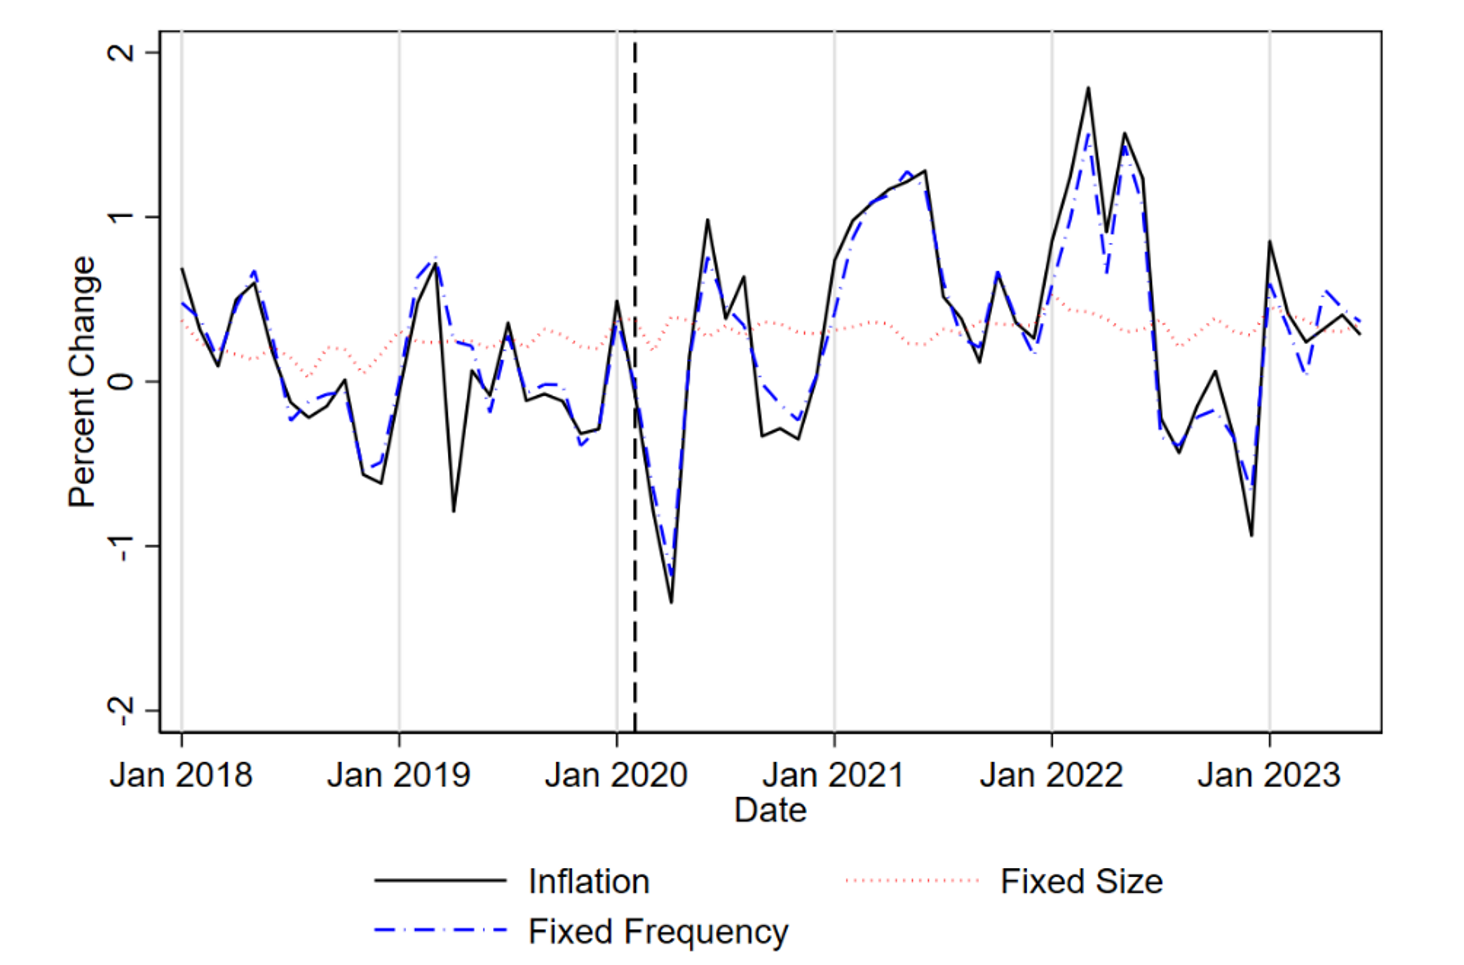
Note: Vertical dashed line marks the start of the pandemic period in February 2020.
Source: BLS and authors’ calculations
2.3 The Dispersion of Price Changes
Higher order moments of the price change distribution can also be informative for determining firm price-setting behavior and understanding the transmission of monetary policy. We measure the dispersion of price changes with the inter-quartile range and standard deviation of non-zero price changes, first computed by broad sector and then averaged across sectors using expenditure weights.6 The series is then seasonally adjusted with the X-13 procedure. Figure 6 shows the evolution of price change dispersion over the past several years.
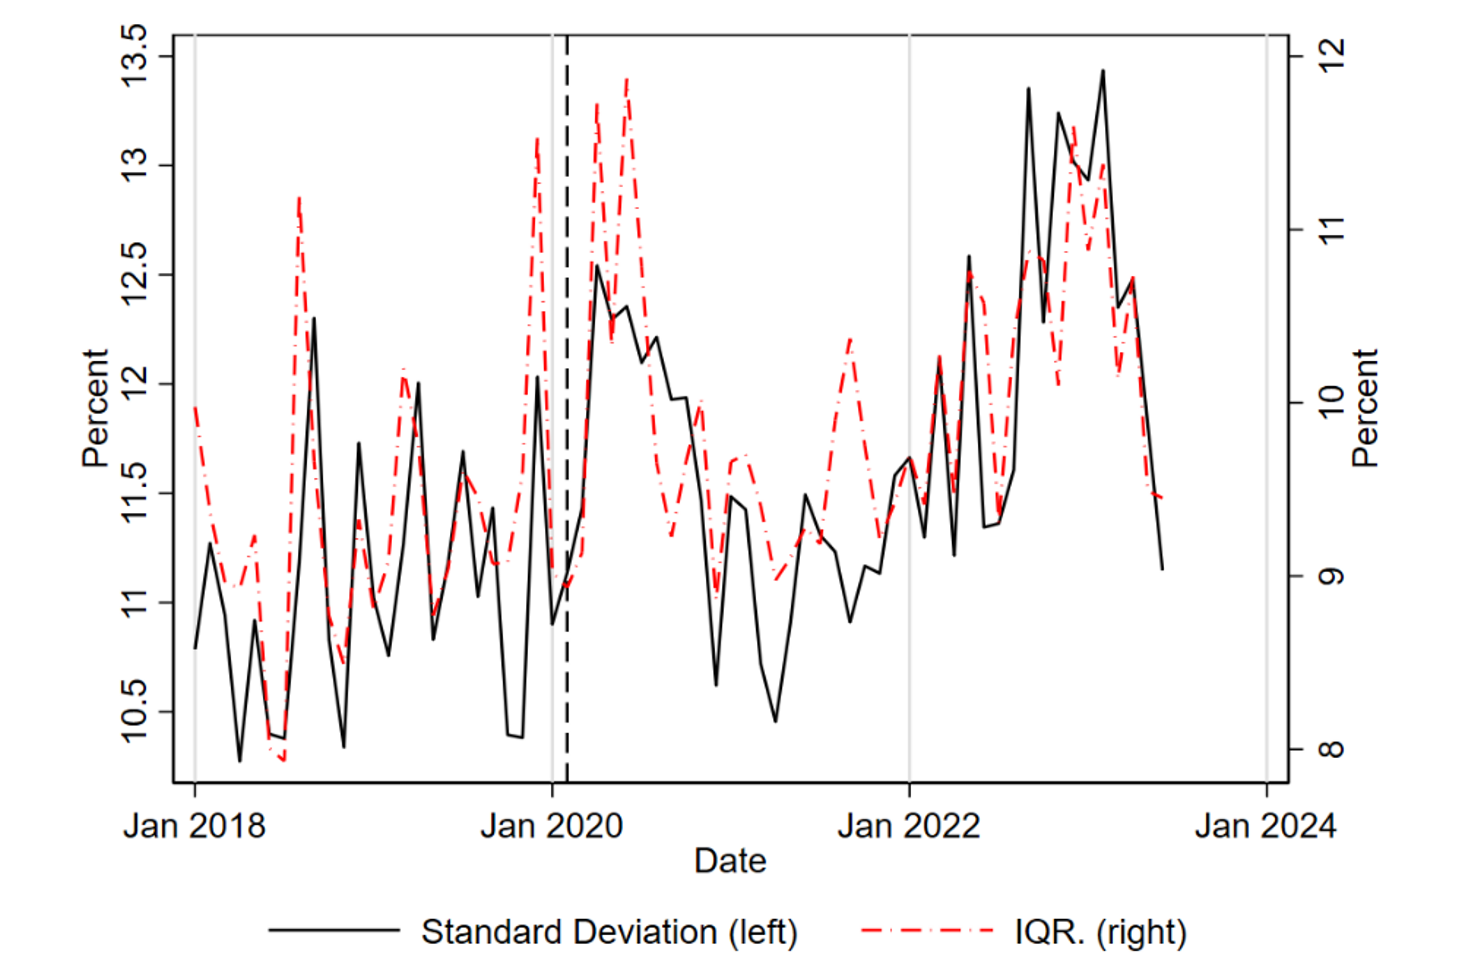
Note: Vertical dashed line marks the start of the pandemic period in February 2020.
Source: BLS and authors’ calculations
We find that the dispersion of price changes began rising sharply in March 2020, likely as a response to the pandemic, and remained high for much of 2020. However, even in late 2020 before the economy fully reopened, the dispersion of price changes began trending down and then began increasing again in the second half of 2021. These results indicate that firm-specific shocks played its most significant role early in the pandemic. Overall, there appears to be a weak relationship between dispersion and inflation.
In standard state-dependent models of price setting, when inflation is driven by aggregate shocks then the dispersion of price changes should fall with inflation. The rationale for this behavior is that most price changes will be increases and concentrated around the same amount. The patterns in our graphs are not consistent with these predictions, which could suggest that factors other than aggregate shocks were at least partly responsible for the increase in inflation.
3. Conclusion
As we have shown, the micro data underlying the U.S. CPI shows that the recent surge in inflation is characterized by a large increase in the frequency of price increases and, to a lesser extent, in their average size. Similarly, both of these series have stepped down noticeably in recent months as overall inflation has come down. Both the frequency of price decreases and the absolute value of price changes have changed little over the pandemic and post-pandemic periods. We note that the rise in the frequency and stability of the absolute value during a surge in inflation is consistent with what Nakamura et al. (2018) found studying the high inflation periods of the late 1970s and early 1980s. As that paper had argued, such a pattern implies that the elevated inflation is not leading to an increase in inefficient price dispersion: this result is fortunate, since price dispersion is one of the main welfare costs arising from high inflation in modern New Keynesian models of price setting. In addition, the surprising stability of the frequency of price decreases also matches what was seen in the 70's and 80's.
Although the co-movement between inflation and the overall frequency of price change is notable and informative for which models of price setting work best empirically, our decomposition of inflation into the intensive and extensive margin highlights that the intensive margin explains a lion's share of the variation in inflation.7 Finally, the fact that the dispersion of price changes has been elevated for much of the pandemic period, including for much of 2021, suggests that shocks other than aggregate ones have likely played a role in price setting and inflation.8
References
Calvo, Guillermo A. (Sept. 1983). "Staggered prices in a utility-maximizing framework." In: Journal of Monetary Economics 12 (3), pp. 383–398. issn: 03043932. doi: 10.1016/0304-3932(83)90060-0.
Ferrante, Francesco, Sebastian Graves, and Matteo Iacoviello (2022). "The Inflationary Effects of Sectoral Reallocation." Working Paper, [Online]. url: https://www.matteoiacoviello.com/research_files/FGI_PAPER.pdf.
Golosov, Mikhail and Robert E. Lucas (Apr. 2007). "Menu costs and phillips curves." In: Journal of Political Economy 115 (2), pp. 171–199. issn: 00223808. doi: 10.1086/512625.
Klenow, Peter J. and Oleksiy Kryvtsov (Aug. 2008). "State-Dependent or Time-Dependent Pricing: Does It Matter for Recent U.S. Inflation?" In: Quarterly Journal of Economics 123 (3), pp. 863–904. issn: 0033-5533. doi: 10.1162/qjec.2008.123.3.863. url: https://academic.oup.com/qje/article-lookup/doi/10.1162/qjec.2008.123.3.863.
Nakamura, Emi and Jon Steinsson (Nov. 2008). "Five Facts about Prices: A Reevaluation of Menu Cost Models." In: Quarterly Journal of Economics 123 (4), pp. 1415–1464. issn: 0033-5533. doi: 10.1162/qjec.2008.123.4.1415. url: https://academic.oup.com/qje/article-lookup/doi/10.1162/qjec.2008.123.4.1415.
Nakamura, Emi, Jon Steinsson, et al. (Nov. 2018). "The Elusive Costs of Inflation: Price Dispersion during the U.S. Great Inflation." In: The Quarterly Journal of Economics 133 (4), pp. 1933–1980. issn: 0033-5533. doi: 10.1093/qje/qjy017. url: https://academic.oup.com/qje/article/133/4/1933/5067315.
1. This research was conducted with restricted access to Bureau of Labor Statistics (BLS) data. The views in this are those of the authors and do not represent those of the Board of Governors of the Federal Reserve System or the Federal Reserve System. Return to text
2. Examples include Klenow and Kryvtsov 2008 and Nakamura, Steinsson, et al. 2018. A central question in this literature is whether firms' price setting behavior is more consistent with "time-dependent" models such as Calvo 1983, or with "state-dependent" models (such as Golosov and Lucas 2007). Generally, in time-dependent models the opportunity to change prices is exogenous to the firm. Such models tend to predict a more sluggish response of inflation to monetary shocks and that inflation leads to higher welfare costs. Return to text
3. This data is available to outside researchers through the BLS visiting researcher program: https://www.bls.gov/rda/home.htm. Return to text
4. For example, two ELIs are "men's suits" (code AA011) or "cheese and cheese products" (FJ021). ELIs form the most granular product categorization used in the C&S. Return to text
5. We follow the approach of papers such as Nakamura and Steinsson 2008 in combining monthly and bi-monthly quotes. This note focuses on price changes that exclude sales or product substitutions. Return to text
6. The sectors are defined by the first two letters of the ELI code (e.g. "Men's apparel" and "Food away from home" are sectors), and thus broader than ELIs. We use sectors for these calculations because many ELIs have very few price change observations available in any given month. Estimates of dispersion would thus be very imprecise at the ELI-month level. Return to text
7. Our results on the frequency of price change strongly point in favor of state-dependent models, as these allow for the frequency to respond to inflationary conditions, while time-dependent models assume that the frequency is exogenous. Return to text
8. Recent work such as Ferrante, Graves, and Iacoviello 2022 has explored how the reallocation of consumer spending from goods to service sectors could result in aggregate inflation. Return to text
Montag, Hugh, and Daniel Villar (2023). "Price-Setting During the Covid Era," FEDS Notes. Washington: Board of Governors of the Federal Reserve System, August 29, 2023, https://doi.org/10.17016/2380-7172.3298.
Disclaimer: FEDS Notes are articles in which Board staff offer their own views and present analysis on a range of topics in economics and finance. These articles are shorter and less technically oriented than FEDS Working Papers and IFDP papers.