


FEDS Notes
October 01, 2026
Pricing Sentiment: Measuring Input Cost Pressure from ISM Survey Responses1
Tomaz Cajner, Leland D. Crane, Christopher J. Kurz, Paul E. Soto, and Betsy Vrankovich
Introduction
Recent history has shown that input cost shocks can propagate quickly and broadly across sectors. When supply chain disruptions, commodity price swings, and demand shocks raise the prices firms pay for materials and services, those pressures can pass through to downstream consumers. Official price indexes eventually reflect these dynamics, but depending on the shock, aggregation can obfuscate important details around the evolution of the price pressures. In addition, official price data sometimes arrive with a substantial lag.
This note proposes a timely, granular measure of input cost pressures using text from Institute for Supply Management's (ISM) monthly surveys of manufacturing and services firms. ISM reports provide one of the first reads of the economy in a given month. The manufacturing (services) report is released on the first (third) business day of the month. This is roughly two weeks before official price indices such as the Producer Price Index (PPI), making the ISM data particularly useful for nowcasting price pressures.2
The ISM surveys ask purchasing managers to list top-of-mind commodities, materials, and services whose prices rose or fell that month. This question is in addition to the higher-level questions on prices and business activity that go into the widely followed ISM diffusion indexes. Respondents are encouraged to report highly specific items, such as "aromatic solvents" (a relevant input in chemical manufacturing) or "DDR5" (a specific type of memory chip), rather than broad categories like "chemicals" or "chips," which can create difficulties with consistently tracking the free-form text across products and over time.
We address this challenge with two natural language processing approaches. First, using text embeddings, we map each reported item into one of roughly fifty consistent, PPI-like categories and construct monthly net price pressure indices for each category. Second, we classify the same items using Claude (Sonnet 4.5), which assigns each product to a category via in-context learning.3 The two approaches yield broadly similar classifications, suggesting the indices are robust to the choice of methodology. We build on recent work extracting economic signals from the ISM survey text (Cajner et al., 2026). The resulting indices respond sharply to identifiable shocks, including the 2025 steel tariffs, the early 2026 start of the conflict in the Middle East, and rising memory chip demand from the AI buildout. Overall, these indices can help identify the emergence and intensity of various input cost shocks as captured by the PPI.
Data
Each month, Institute for Supply Management surveys purchasing managers at manufacturing and services firms. The surveys include categorical questions that feed into the PMI diffusion indexes as well as free-response text boxes where managers can elaborate on their answers. For the prices paid question, respondents indicate whether prices increased, decreased, or stayed the same relative to the prior month, and are asked to list specific commodities, materials or services in an accompanying text field. In particular, we focus on two free-text fields: "prices going up" and "prices going down."
Purchasing managers report lists of items such as "DDR5," "diesel fuel," or "C5 resins" rather than generic, consistent categories. Respondents are free to skip these questions, though text is provided in roughly a quarter to a third of responses, yielding a large list of product mentions per month.
Methodology
Our goal is to convert the large amount of product mentions into a tractable set of consistent, PPI-like categories. Based on our inspection of the data we define a taxonomy of roughly fifty detailed categories, spanning energy (petroleum fuels and natural gas,), food and beverages (meats, dairy, cereals), chemicals and materials (plastics and fertilizer), metals (ferrous and nonferrous), housing and construction, high-tech products (memory chips, processors), and others.
We map product mentions to the detailed categories using two approaches: Unsupervised sentence embeddings and generative AI.
Approach 1: Unsupervised Embeddings
For each month, we split the price text into individual items based on commas and semi-colons. In the embedding approach, we seed each of the detailed categories with representative terms. For example, "high-tech memory chips" includes "ssd," "memory," "DRAM," "NAND," and "DDR", among other words associated with high-tech memory. We use a pre-trained sentence-transformer model (all-MiniLM-L6-v2) to embed both the seeds and the reported items from the survey. We then compute the cosine similarity between the embedded item listed by the purchasing managers and each of the seeds and assign the category to the one yielding the highest average cosine similarity. This unsupervised procedure identifies that, for example, "DDR5" belongs to high-tech memory and "epoxy" belongs to plastics and chemicals.
Approach 2: Generative AI
We also classify items using Claude Sonnet 4.5 by having the model read each firm-month cell as a unit and extract items via in-context learning. That is, the model assigns each extracted item to one of the categories using a prompt that includes the taxonomy from Approach 1.
We count each firm-detailed category pair as a mention. Within each sector (services vs. manufacturing), we count mentions of price increases and decreases, defining net increases as:
$$$$ {Net}_{s,c,t}={Increases}_{s,c,t}\ {-Decreases}_{s,c,t} $$$$
for each sector $$s$$ and category $$c$$ in month $$t$$. The resulting series are monthly and cover 2024-2026.
Results
Figures 1 to 4 present our price indices. The orange bars represent the net "prices up" mentions in a given month. The blue line shows the year-over-year percent change in the associated PPI for that category.4
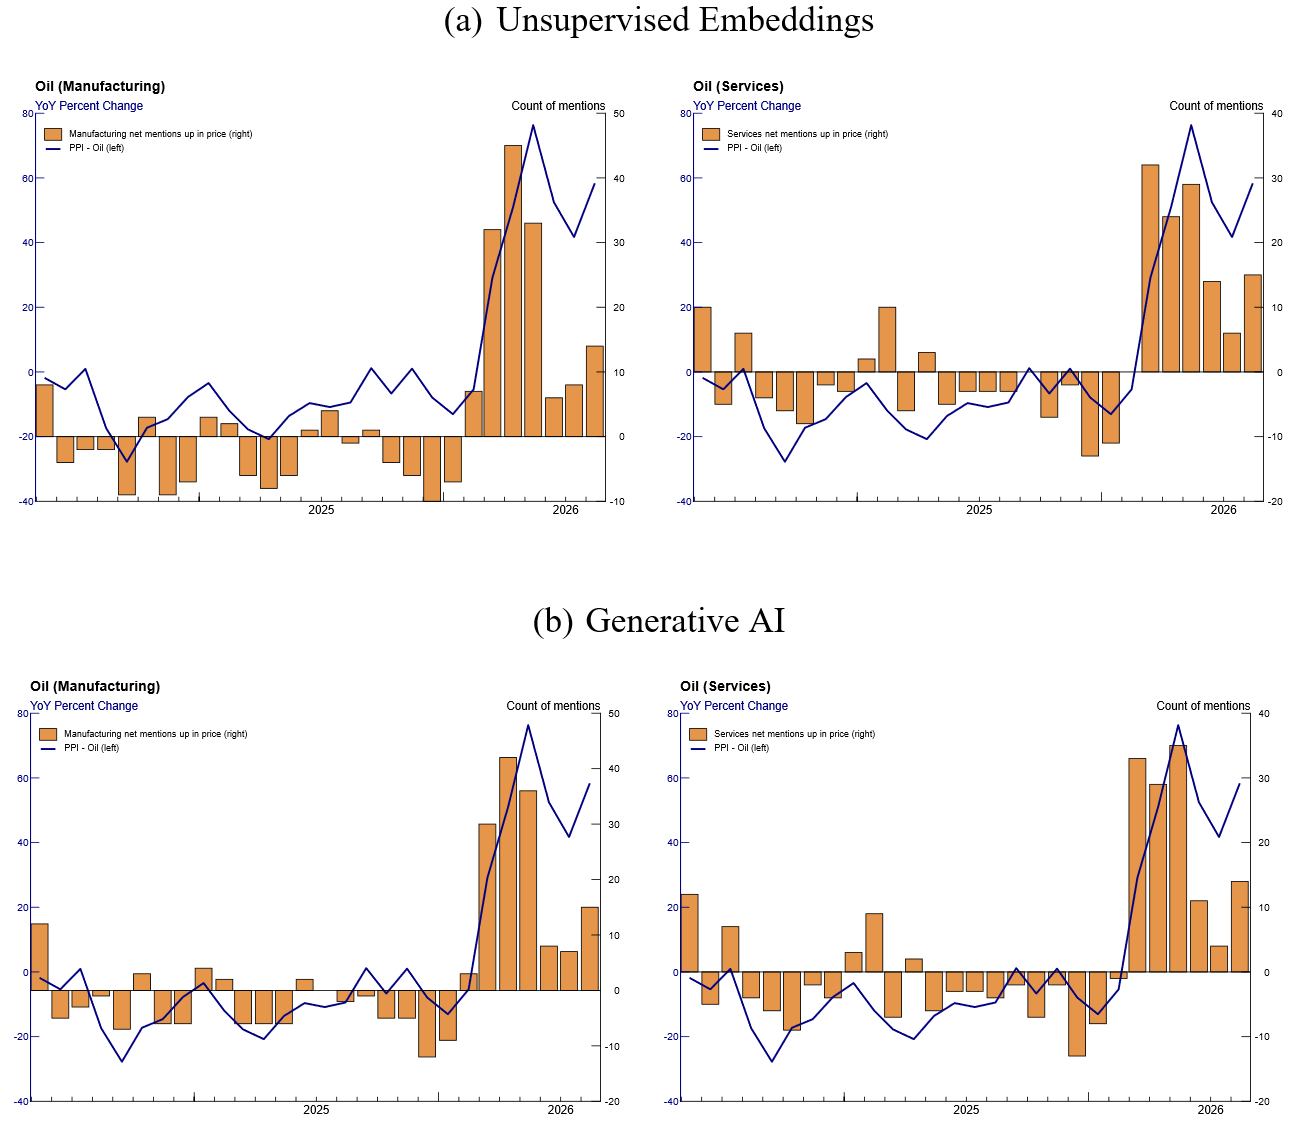
Notes: This figure shows the input price pressure indices for petroleum fuels. Panel (a) classifies mentions using unsupervised sentence embeddings, while panel (b) uses generative AI classification. The orange bars show net mentions per month, while the blue line shows year-over-year percent change in the PPI for petroleum products.
In Figure 1, panel (a) shows the index using the unsupervised embedding approach, while panel (b) shows the corresponding series using the generative AI approach. Across both manufacturing and services, the price indices respond sharply to the disruption to shipping through the Strait of Hormuz in early 2026. Net mentions spiked in March 2026, coinciding with the rise in the PPI. By June 2026, net mentions had eased, and the PPI turned down in the same month. Given that the ISM data arrive weeks before the PPI, the survey provided an early read on both the onset and the easing of the shock. From 2024 to 2025, petroleum fuel mentions were modestly negative, consistent with the gradual easing of energy prices during this period.
The two classification approaches in Figure 1 produce series that are remarkably similar with respect to both timing and magnitude. We find a similar pattern across different categories (not shown). The fact that these two approaches—with different underlying models—arrive at largely the same classifications suggests that modern genAI tools are comparable, if not better, for product-to-category mappings than traditional natural language processing techniques. For the remainder of this note, we focus on our preferred approach, the genAI method, given its flexibility with free form text.5
Figure 2 shows the input price pressure indices for ferrous metals. The indices suggest on net a steady rise in price pressures from early 2025 through present, consistent with the tariffs on steel imposed in 2025 and their subsequent extensions. The survey series tracks the variations in the iron and steel PPI less tightly than in Figure 1. Nonetheless, the mentions pick up the broad upward trend in the PPI since early 2025 when the tariffs took effect. The services series display a broadly similar dynamic, though with smaller amplitudes, which is consistent with services firms encountering steel prices indirectly through construction, equipment, and maintenance costs rather than as direct material inputs.
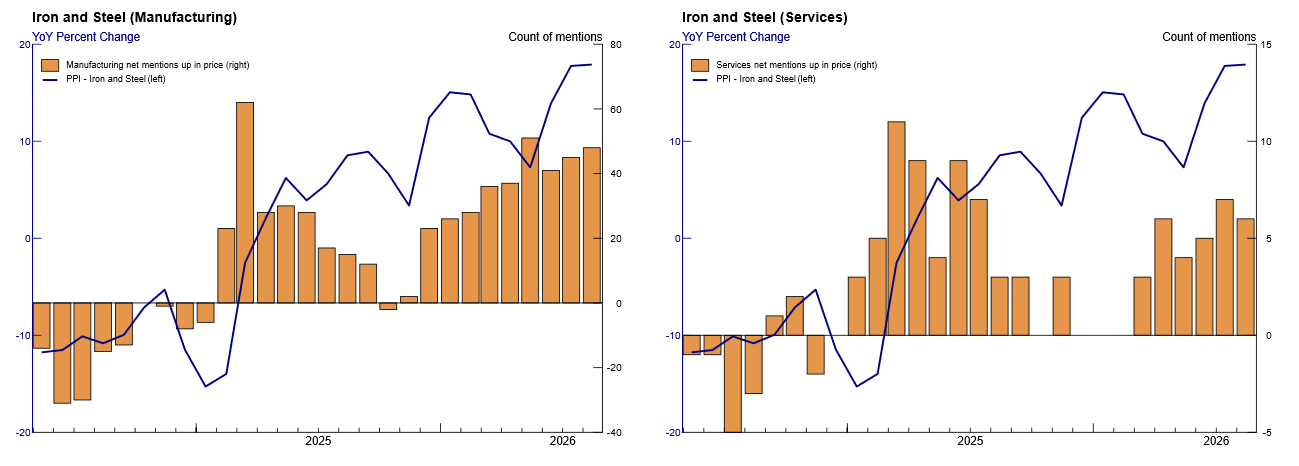
Notes: This figure shows the input price pressure indices for ferrous metals using the generative AI classifications. The orange bars show net mentions per month, while the blue line shows year-over-year percent change in the PPI for iron and steel.
The indices for high-tech products, representing predominantly memory chips and processors, are shown in Figure 3. In manufacturing, the index rose in December 2025 and grew sharply in January 2026, remaining elevated through the present. The rise in price pressures from the survey data appears to lead the PPI for semiconductors and other electronic components, which only rose in February 2026. The services series shows a similar pattern. This dynamic is consistent with rising memory prices amid the AI buildout, wherein surging demand for high-bandwidth memory in data centers has led to chipmakers reallocating production capacity toward accelerators and AI-oriented memory. This has tightened the supply of conventional DRAM and NAND and pushed up prices across the memory category.
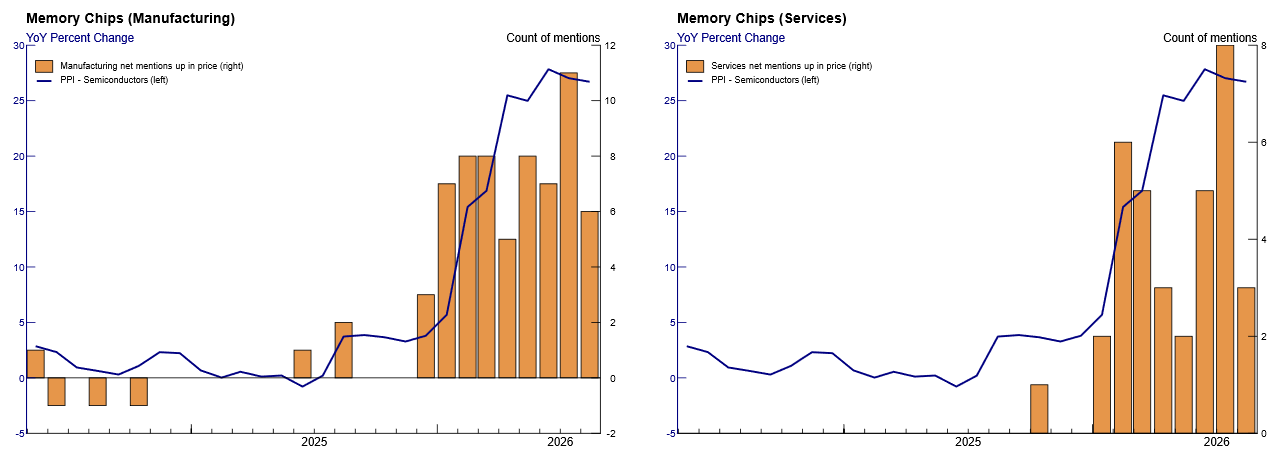
Notes: This figure shows the input price pressure indices for high-tech products, predominantly memory chips, using the generative AI classifications. The orange bars show net mentions per month, while the blue line shows year-over-year percent change in the PPI for semiconductors and other electronic components.
Figure 4 presents the aggregate net index. The series show aggregate price pressures peaking in April 2026 before declining in June. The aggregate index also tracks the year-over-year change in the final demand PPI closely, picking up the broad contour over the sample.
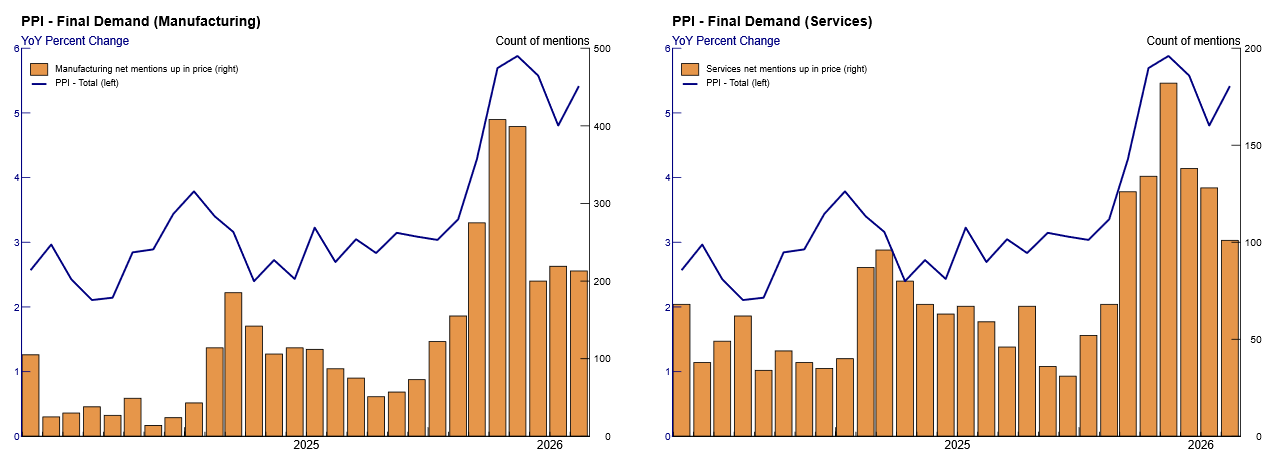
Notes: This figure shows the aggregate net input price pressure index across all categories, using the generative AI classifications. The orange bars show net mentions per month, while the blue line shows year-over-year percent change in total final demand PPI.
Our results show that the timing of the ISM price pressures sometimes lead the PPI data. There are a number of possible explanations, but a simple one is differences in timing: the PPI survey asks for the prices of goods shipped in the reference period. The ISM question is perhaps not as precise with respect to timing, but it seems reasonable that many respondents would include prices of goods ordered in the reference period, which would then lead prices of goods shipped. Evidence suggests the lag between order and shipment can be substantial, see Gilbert et al. (2021). Overall, we find that our categorical and aggregate series support the use of the ISM price data not only as a signal for nowcasting, but also as a leading indicator of the direction and magnitude of price pressures.
Conclusion
In this note, we presented a new set of input price pressure indices constructed from free-form responses to Institute for Supply Management's monthly survey of manufacturing and services firms. We map specific commodities, materials, and services reported by purchasing managers into roughly fifty PPI-like categories using two independent approaches: unsupervised sentence embeddings and in-context classification using Claude Sonnet 4.5. The two methodologies yield closely comparable series that respond sharply to identifiable shocks, such as the 2025 steel tariffs, the start of the conflict in the Middle East in early 2026, and the rise in memory prices accompanying the AI buildout. In several cases, particularly for oil and high-tech products, the survey series moved ahead of the corresponding PPI. Our series provide a timely and disaggregated view of where input cost pressures originate and can complement official price indexes that arrive with a lag and at a higher level of aggregation.
References
Bognanni, Mark, and Tristan Young. 2018. "An Assessment of the ISM Manufacturing Price Index for Inflation Forecasting." Economic Commentary 2018-05. Cleveland: Federal Reserve Bank of Cleveland, May 24, 2018. https://doi.org/10.26509/frbc-ec-201805
Cajner, T., Crane, L. D., Kurz, C., Morin, N., Soto, P. E., & Vrankovich, B. (2026). Manufacturing sentiment: forecasting industrial production with text analysis. Journal of Applied Econometrics.
Gilbert, Charles, Maria Tito, and Cynthia Doniger. 2021. "Quantifying Bottlenecks in Manufacturing." FEDS Notes. Washington: Board of Governors of the Federal Reserve System, November 19, 2021. https://doi.org/10.17016/2380-7172.3022
U.S. Bureau of Labor Statistics, Producer Price Index. Haver Analytics, https://www.haver.com/our-data.
1. The analysis and conclusions set forth are those of the authors and do not indicate concurrence by other members of the research staff or the Board of Governors. We thank Institute for Supply Management for access to and help with the manufacturing and services survey data that underlie the work described by this note. Return to text
2. For example, Bognanni and Young (2018) find that the ISM manufacturing prices index can improve forecasts of PPI inflation. Return to text
3. We access Claude through the Govcloud version of AWS Bedrock, a secure environment meant for sensitive work. In particular, no data travels back to the AI vendor and no data is used for model training. Return to text
4. PPI data was obtained via Haver Analytics. Return to text
5. The unsupervised and genAI methodologies yield similar results for the other commodities presented in this note. Return to text
Cajner, Tomaz, Leland D. Crane, Christopher J. Kurz, Paul E. Soto, and Betsy Vrankovich (2026). "Pricing Sentiment: Measuring Input Cost Pressure from ISM Survey Responses," FEDS Notes. Washington: Board of Governors of the Federal Reserve System, October 01, 2026, https://doi.org/10.17016/2380-7172.4191.
Disclaimer: FEDS Notes are articles in which Board staff offer their own views and present analysis on a range of topics in economics and finance. These articles are shorter and less technically oriented than FEDS Working Papers and IFDP papers.