FEDS Notes
February 23, 2024
Primary and Secondary Markets for Stablecoins
Cy Watsky, Jeffrey Allen, Hamzah Daud, Jochen Demuth, Daniel Little, Megan Rodden, Amber Seira1
Introduction
Stablecoins are increasingly important in decentralized finance (DeFi) and crypto asset markets, and their prominence has led to greater scrutiny of their unique role as expressions of the U.S. dollar running on blockchain networks. Stablecoins attempt to perform a mechanically complex function – to remain pegged to the dollar, even during periods of market volatility. However, in recent years, several stablecoins have de-pegged on secondary markets during periods of intense stress. Much analysis has interrogated the inherent stability (or instability) of different stablecoin designs, though each successive market event reveals new and distinct risks to different stablecoins.
Illustrative of these shifts and challenges were the events of March 2023. On March 10, 2023, Circle, the issuer of the stablecoin U.S. Dollar Coin (USDC), announced that it had been unable to wire out a portion of USDC reserves held at Silicon Valley Bank before regulators took control of the bank.2 The price of USDC de-pegged significantly off the U.S. dollar, and markets for other stablecoins fluctuated considerably as traders responded to the news (Capoot 2023). A confluence of factors makes the March events particularly intriguing for researchers seeking to understand the complexities of stablecoin markets. This paper analyzes a number of these factors, with an emphasis on distinguishing between primary and secondary market dynamics during a stablecoin crisis.
We begin our analysis with an overview of the ways in which stablecoins are collateralized, issued on primary markets, and traded on secondary markets. We then turn to a case study of the March 2023 stablecoin market events, which shook crypto-asset markets. We discuss four stablecoins of interest, focusing on their different technical designs, and provide a detailed account of dynamics on primary points of issuance and secondary markets. From this analysis, we derive several general insights about the nature of stablecoin markets during periods of stress.
Background
Stablecoins are a category of crypto-assets designed to maintain a stable value against a non-crypto reference asset. For the purposes of this note, we focus on stablecoins that reference the U.S. dollar – the vast majority of stablecoins traded in crypto markets. Unlike crypto-assets whose values are intended to fluctuate, and thus are often bought purely for speculation, stablecoins serve as an (ideally) stable store of value and medium of exchange (Baughman and others 2022). The proliferation of stablecoins has led to their widespread use in DeFi markets and services, to facilitate trades on crypto exchanges, and as an on-ramp into crypto markets (Liao and Caramichael 2022).3
Stablecoin Design
Stablecoins can generally be grouped into three categories according to how they are collateralized and issued: fiat-backed stablecoins, crypto-collateralized stablecoins, and algorithmic (or uncollateralized) stablecoins. The way in which a stablecoin is designed to maintain a stable value has implications for its utility as a means of exchange or a store of value as well as the level of centralization (or lack thereof) inherent in the product.
Fiat-backed stablecoins are backed with cash and cash-equivalent reserves such as deposits, Treasuries, and commercial paper. Most fiat-backed stablecoins are centralized, in the sense that a single company is responsible for issuing stablecoins on public blockchains at a 1:1 parity with fiat reserves held outside of the blockchain. At a high level, the stablecoin issuer is responsible for ensuring that the number of tokens issued on the blockchain is no greater than the dollar value of the issuer's "off-chain" reserves.
Crypto-collateralized stablecoins are backed by a basket of crypto-assets, such as other stablecoins or crypto-assets, including Bitcoin or ether, so that at least a dollar's worth of crypto-assets is held in reserves for each stablecoin issued. They tend to be decentralized in nature, with self-executing smart contracts responsible for the issuance of the token. A user deposits a certain amount of crypto-assets, and the smart contracts mint the appropriate quantity of stablecoin tokens in return, generally at an overcollateralized ratio. If the value of collateral sinks below a certain level, a series of smart contract-enabled processes liquidate the collateral and remove excess stablecoins from supply.4
Algorithmic stablecoins are, in many ways, the most difficult category to define.5 They tend to be under- or entirely uncollateralized by design and instead use smart contracts and various incentive structures to maintain the peg by adjusting the supply of the stablecoin according to demand (Adams and Ibert 2022). Terra, the largest algorithmic stablecoin before its collapse in May 2022, typifies a model in which the stablecoin is "backed" by a crypto-asset whose supply fluctuates in direct accordance with changes in demand for the stablecoin.6 Supply of the backing crypto-asset is increased as stablecoins are removed from circulation, thereby decreasing the price of the backing crypto-asset, and the reverse happens to mint new stablecoins. In such a way, the crypto-asset that backs an algorithmic stablecoin is endogenous to the same system, unlike crypto-collateralized stablecoins, which are theoretically backed by otherwise unrelated crypto-assets. This collateral design has led to the rapid and notable "death spirals" of several algorithmic stablecoins.7
Stablecoins: Primary vs. Secondary Markets
The issuance and collateral design of stablecoins is the way a stablecoin issuer, adjusting collateral or supply as needed, assures consumers that each stablecoin is worth a dollar. However, secondary markets actually price the assets and help enable a stablecoin to maintain its dollar peg.
Fiat-backed stablecoin issuers tend to only mint and burn new stablecoins with institutional customers, meaning that retail traders rely on secondary markets to access the stablecoin. As a result, not all traders of the stablecoin can access the primary point of issuance, and those without access contribute to the stablecoin's peg only through secondary markets. The primary market for other stablecoins can include a much wider range of participants. For example, DAI, a crypto-collateralized stablecoin issued through decentralized smart contracts, allows any user on Ethereum to deposit collateral tokens in return for a stablecoin.
Stablecoin pegs are also maintained through widespread trading on secondary markets, such as DeFi platforms and centralized exchanges. Direct customers of stablecoin issuers can engage in arbitrage trading, profiting off differences between the primary exchange rate and the exchange rate on secondary markets to maintain the peg of a stablecoin. Decentralized exchanges and liquidity pools offer additional opportunities for arbitrage trading, such as stablecoin-specific automated market makers.8
Market observers do not generally look to the primary point of issuance to determine whether a stablecoin is maintaining its peg at a particular point because a stablecoin issuer is unlikely to ever promise redeeming a stablecoin for less than a dollar. Instead, prices aggregated across exchanges tend to be the most popular source of pricing data, though market inefficiencies can make it difficult to accurately price stablecoins and other crypto-assets (Almeida and Goncalves 2023).
The literature on the economics underlying stablecoin issuance and crypto-asset markets is still grappling with foundational questions, but several emerging strands of research have provided insights into stablecoin stability and the role stablecoins play in crypto-asset markets. Baur and Hoang (2021) and Grobys and others (2021) provide evidence for stablecoins' role as a hedge against Bitcoin's volatility and argue that, consequently, stablecoins' prices are not always stable, because they are affected by volatility in markets for other crypto-assets. Gorton and others (2022) argue that the utility of stablecoins for lending to leveraged traders in crypto markets accounts for their ability to remain stable. Several papers analyze the effect that the issuance of new stablecoin tokens has on other crypto-asset markets, with evidence suggesting an association between primary markets for stablecoins and secondary markets for stablecoins and other crypto-assets. Ante, Fiedler, and Strehle (2021) argue that on-chain issuance of new stablecoin tokens was associated with abnormal returns on other crypto-assets, while Saggu (2022) argues that investor sentiment in reaction to public announcements of new Tether minting events is responsible for positive Bitcoin price responses.
Perhaps most informative for our analysis is Lyons and Viswanath-Natraj (2023), which explores flows between primary and secondary markets for stablecoins, arguing that "access to the primary market matters for the efficiency of arbitrage design" of a stablecoin (p. 8). The authors find that Tether's design changes in 2019 and 2020, which broadened access to its primary market, reduced peg instability. We take inspiration from their approach in considering the importance of the relationship between primary markets and price dislocations on secondary markets for stablecoins, employing some of their methodology as well. We extend this analytical approach to examine stablecoin markets during a period of market stress, emphasizing the mechanical differences between four stablecoins' primary markets as well as activity on decentralized and centralized secondary markets.
Case Study: March 2023 Stablecoin Run
On March 10, 2023, Circle, the issuer of the stablecoin U.S. Dollar Coin (USDC), announced that it had been unable to wire out $3.3 billion of USDC reserves (out of around $40 billion) held at Silicon Valley Bank before regulators took control of the bank.9 The price of USDC on secondary markets de-pegged off of the dollar, and markets for other stablecoins fluctuated significantly as traders responded to the news. In our case study, we look at the four largest stablecoins at the time: USDC, Tether (USDT), Binance USD (BUSD), and DAI.
Our analysis traces activity across primary markets, decentralized secondary markets, and centralized secondary markets during this period of market turmoil to tease out differences between the stablecoins and to show what can be discerned from on-chain and off-chain data.
Technical Details: USDC, USDT, BUSD, and DAI
USDC is a fiat-backed stablecoin issued by Circle. Like many fiat-backed stablecoins, only direct customers of Circle (cleared through an application process) have access to the primary market for USDC, and those customers tend to be businesses such as crypto-asset exchanges, financial technology companies, and institutional traders.10 Most retail users instead purchase their stablecoins from intermediaries and can buy and sell them on secondary markets such as centralized and decentralized exchanges.
On March 11, Circle announced that USDC's "issuance and redemption is constrained by the working hours of the U.S. banking system," and that such "USDC liquidity operations [would] resume as normal when banks open on Monday morning."11 The announcement implied that the primary market, then, would be operationally constrained, and later announcements implied that a backlog had built up for redemptions. Our analysis in the following sections studies the visible on-chain activity in the primary market for USDC, though we cannot infer the extent of any backlog that built up off-chain.12 Exchanges that usually offered one-for-one trades between USDC and other stablecoins or USDC and the dollar to their retail customers followed by pausing such offers, further cutting off outflows from secondary market participants looking to sell USDC (Huang, Miao, and Ostroff 2023).
BUSD is a fiat-backed stablecoin issued by Paxos. While it mechanically operates in a manner like those of the other fiat-backed stablecoins described in this note, it differs significantly in several ways. For one, regulators halted new issuance of BUSD in February 2023, meaning the primary market for BUSD could only burn tokens and reduce supply in the period we analyze. Secondly, while BUSD is issued solely on Ethereum, holdings of BUSD are highly concentrated in Binance-associated wallets – over 85 percent of BUSD on Ethereum.13 Around a third of BUSD is locked in a Binance wallet on Ethereum, and tokens representing the locked BUSD are issued on Binance Smart Chain, a different blockchain.14 As a result, BUSD also plays a far smaller role in trade on Ethereum-based decentralized markets.
USDT, the largest stablecoin on the market, is also a fiat-backed stablecoin whose primary market is restricted to a set of approved customers that tend to be companies rather than retail traders. USDT's primary market is far more restrictive than USDC's, with a reported minimum of $100,000 of USDT per mint on-chain (Ehrlich and Bambysheva 2022). We scrutinize activity on Tether's primary market in further depth later. Notably, while USDC experienced constraints on primary and secondary markets, and BUSD's issuance was halted by regulators, USDT was under no abnormal technical constraints during the case study period.
Dai is a crypto-collateralized stablecoin whose issuance is governed by a decentralized autonomous organization (DAO) called MakerDao and implemented through smart contracts. Dai is issued solely on Ethereum, and any Ethereum user can access the smart contracts issuing the token. These smart contracts can differ by the various collateral types offered and the mechanism by which collateralization levels are maintained. For example, a user can open a Maker Vault, depositing ether (ETH) or another accepted volatile crypto-asset to generate Dai at an overcollateralized ratio – $150 worth of ETH for 100 Dai, for example.15 Dai's Peg Stability Module, on the other hand, allows users to deposit another stablecoin, such as USDC, to receive exactly the same number of Dai in return.16 Dai is thus unique among the stablecoins we examine both because its primary market is available to any Ethereum user with access to DeFi and because multiple, mechanically distinct primary markets exist for the stablecoin. The nature of self-executing mechanisms controlling the supply of the token make its primary market theoretically more active than that of the other stablecoins. Additionally, the fact that some portion of Dai is collateralized by USDC ties the market for Dai more directly to changes in USDC's market.
Table 1 displays some descriptive statistics for each of these stablecoins. Notably, USDC's market cap decreased by around $10 billion over the course of March 2023, while USDT's market cap increased by around $9 billion. DAI, despite its supply fluctuating over the course of the month, ultimately saw its market cap change by very little. BUSD's market cap decreased by over $2 billion. Additionally, USDT differs significantly in that only 45 percent of its supply was issued on Ethereum as of March 1, 2023, with the most of the non-Ethereum-issued USDT having been issued on Tron.17
Table 1. Descriptive Statistics of Stablecoins (2023)18
| Stablecoin | Mkt. Cap ($B, Mar 1) | Change in Mkt. Cap ($B, Mar 1-Apr 1) | No. Unique Holders on Ethereum (000s, Jul 26) | % Owned by Top 10 Addresses on Ethereum (Jul 26) | % Issued on Ethereum (Mar 1) |
|---|---|---|---|---|---|
| USDC | 42 | -9.7 | 1,750 | 16.47 | ~90 |
| USDT | 71 | 8.8 | 4,500 | 18.69 | ~45 |
| BUSD | 10.2 | -2.6 | 170 | 91.29 | 100 |
| DAI | 5 | 0.1 | 495 | 28.07 | 100 |
Trading Activity on Secondary Markets
Secondary markets for stablecoins provide the default source of pricing data for market observers. Figure 1 shows that prices of these four stablecoins differed dramatically in the days following SVB's collapse. USDC and DAI de-pegged in a strikingly similar pattern, reaching lows of under 90 cents and recovering over the course of three days at a similar rate. Given that a stablecoin's primary responsibility is to remain pegged to the dollar, one might assume similar price slippages would indicate similar overall market conditions for both assets. Yet, as noted in Table 1, DAI's market cap increased following the March event, while USDC's market cap shrank by nearly $10 billion. Conversely, while both BUSD and USDT traded at a premium, BUSD's market cap shrank while USDT's market cap increased by $9 billion. Pricing data alone, then, does not account for the entirety of market dynamics during the March event.
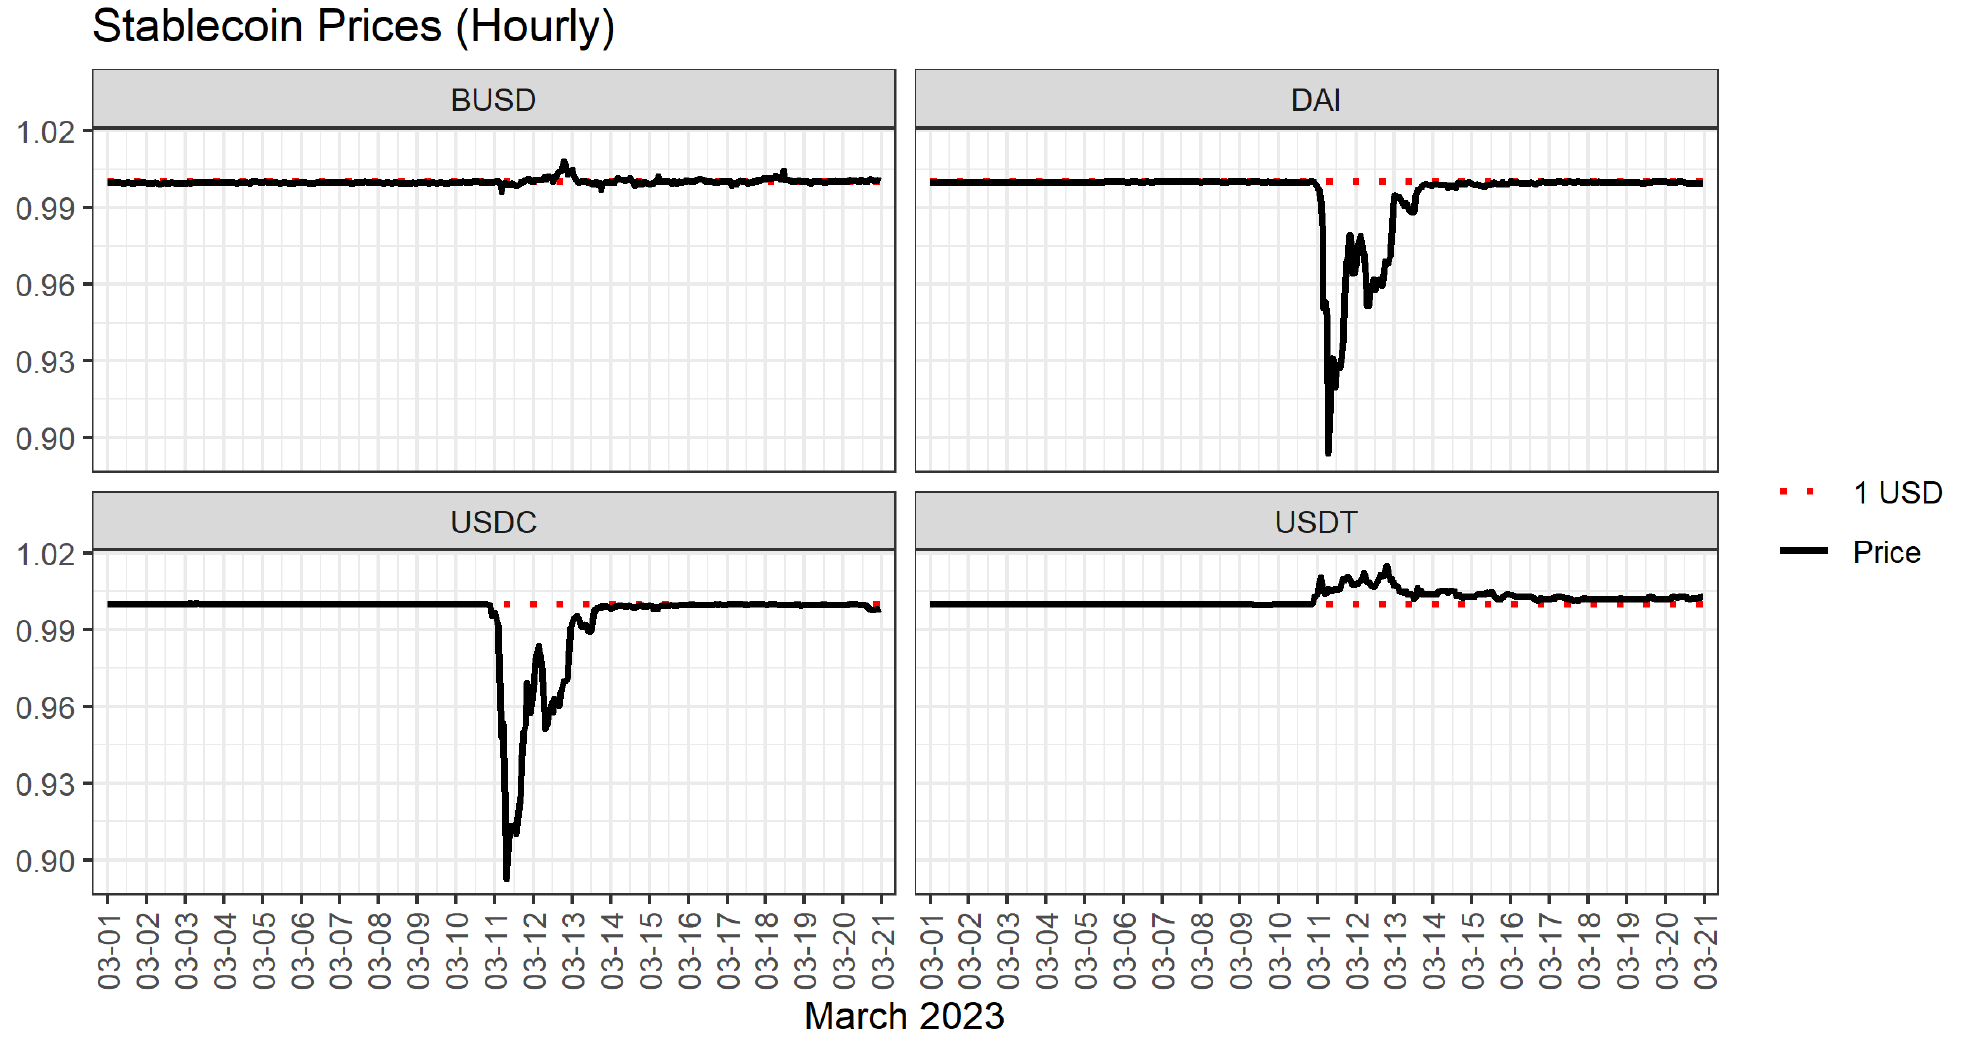
Source: CryptoCompare.
Centralized exchanges (CEXs) remain the most popular way for retail traders to trade crypto-assets on secondary markets, but decentralized exchanges (DEXs) have grown in popularity over the past few years. At a high level, DEXs seek to perform a similar function for users: they serve as markets for trading crypto-assets. However, they differ significantly in several critical ways:
- CEXs can serve as on- and off-ramps to and from fiat currency. Users can transact with fiat money to purchase crypto and vice versa. Users cannot, on the other hand, purchase or sell stablecoins for fiat currency on DEXs. This limitation has led to stablecoins' prominence in DEXs as the only alternative to fiat for dollar-like currencies to trade against.
- While CEXs operate using traditional market makers and limit order books, DEXs use automated market makers, which may behave differently even if they try to approximate similar market-making functions.19
- Users must onboard onto centralized systems to access CEXs, often by sharing identifying information to comply with local know-your-customer regulations. DEXs, on the other hand, operate based on permissionless smart contracts, making them theoretically more open. CEXs may resemble more traditional, intuitive systems for less experienced crypto traders, though, while DEXs require users to be familiar with the operations of DeFi applications.
The differences between these categories of exchanges may have contributed to differences in activity on CEXs and DEXs during the March event. Figure 2 shows that both categories of exchanges experienced spikes in trading volumes during the March events, but to different extents. While DEX volumes increased to historic highs, to more than $20 billion on March 11, compared with typical volumes between $1 billion and $3 billion, CEX volumes reached high marks for the first half of 2023, but not at levels dramatically different from other periods, and they were not record highs. Additionally, spikes in DEX trading volumes preceded trading increases on CEXs, decreasing before volumes peaked on CEXs. However, these differences in trading volumes did not lead to major gaps in pricing of assets between centralized and decentralized markets.20 Further research teasing out the differences between CEXs and DEXs during times of stress would help disentangle the roles they play in facilitating activity during stablecoin run scenarios, as well as the implications of mechanical differences between automated market makers and limit order books.
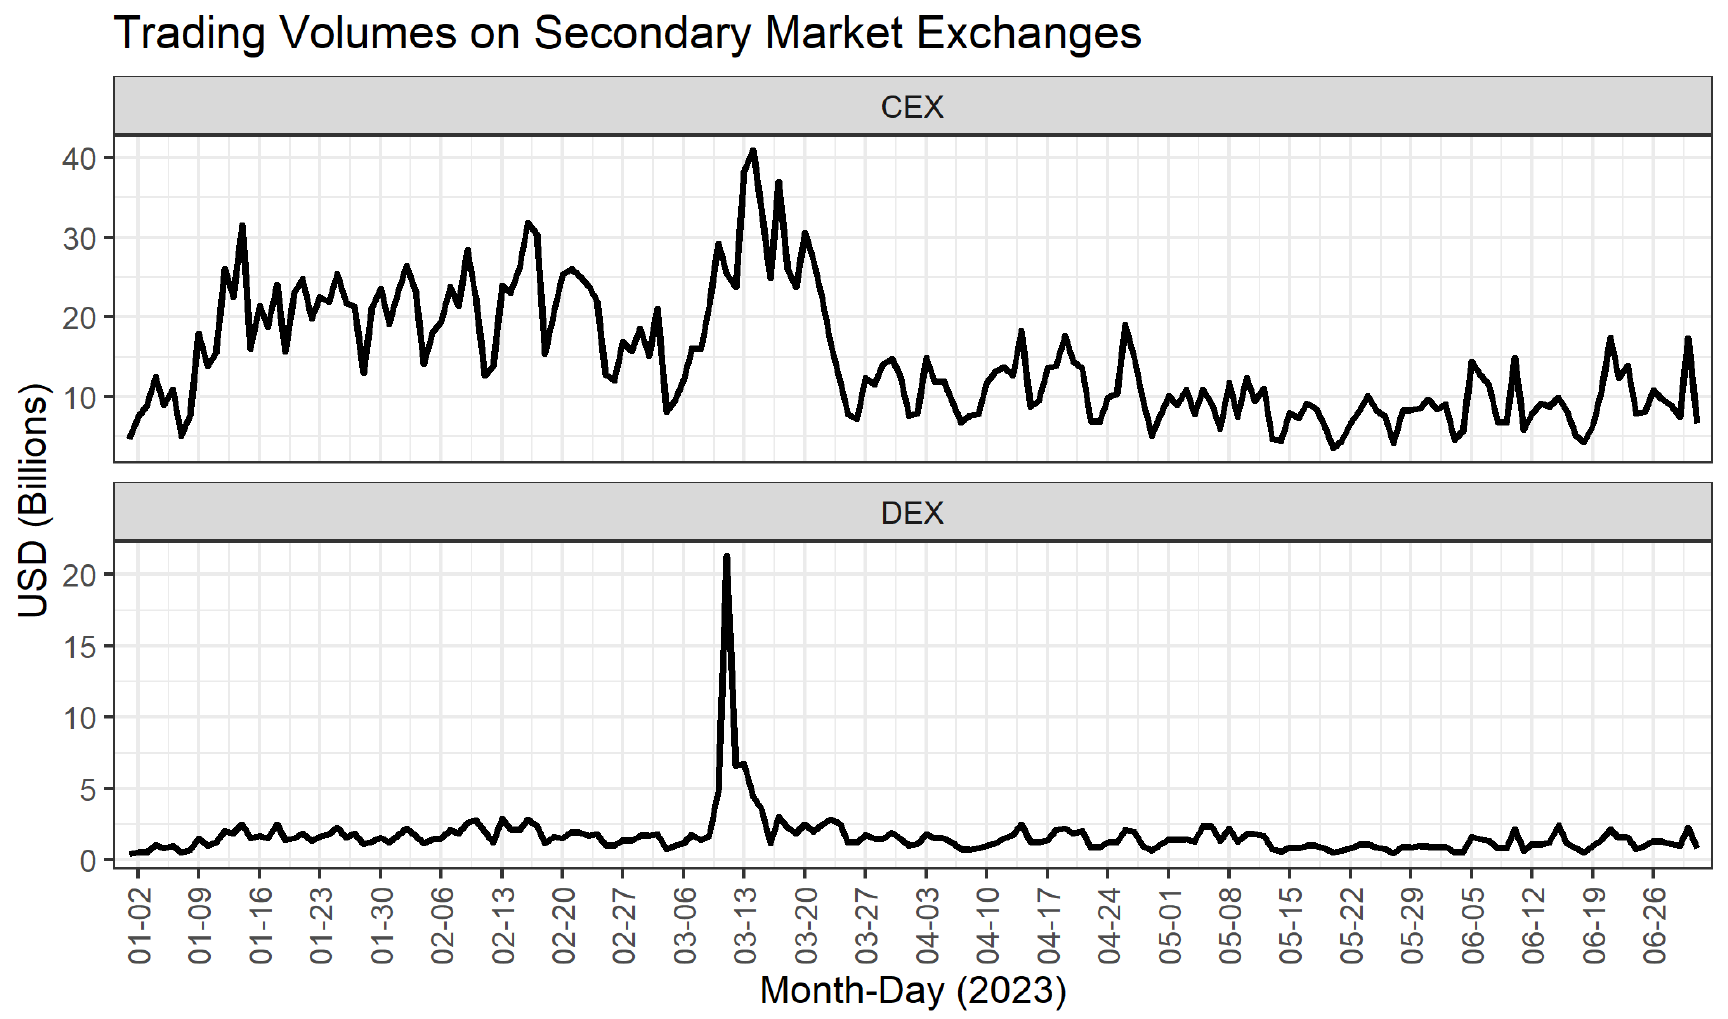
Source: CryptoCompare, DeFi Llama.
The increased activity on secondary markets ultimately transmits pressure to the stablecoin's primary market, as excess sell pressure on de-pegged stablecoins and excess demand for stablecoins trading at a premium should theoretically lead to issuance or redemption on the primary market. We examine the data in the following section.
Primary Markets
The public nature of the data stored on the Ethereum blockchain allows us to directly view the creation and destruction of stablecoin tokens, and we conduct this analysis in part to demonstrate what researchers can infer about the primary markets of stablecoins through blockchain data. We present this data in several ways, though we do not attempt to assert the primacy of one methodology or another for understanding the nature of primary markets of stablecoins. Descriptive analysis of on-chain issuance offers an illuminating complement to more widely cited data on secondary markets for stablecoins. We hope future research interrogates the theory underlying the relationship between primary and secondary markets for stablecoins.
We use Amazon Web Services Public Blockchain Data to access on-chain data to track supply changes for stablecoins on Ethereum. We track two sets of numbers: "mints" and "burns" of tokens on-chain, as well as movements to and from the Treasury wallets associated with the issuers of each fiat-backed stablecoin. Minting and burning of tokens simply describes the addition or subtraction of tokens to the total supply on Ethereum.21 We follow Lyons and Viswanath-Natraj (2023) in measuring "net flows" from primary markets to secondary markets. The issuers of BUSD, USDT, and USDC each have a Treasury wallet that maintains a surplus of tokens minted on-chain but not yet issued to other parties. By subtracting net transfers into Treasury wallets from the net of tokens minted on-chain, we can track the net of new funds going to the secondary market from the primary market. As DAI is issued via smart contracts directly to holders, no Treasury wallet intermediates the initial distribution of DAI on-chain.
As backdrop, Table 2 provides summary statistics comparing the primary markets for each of the stablecoins during 2022, well before the event window in question. The table captures the number and average value of mints, burns, and treasury wallet transactions over the year. Immediately apparent is the difference in both frequency of primary market activity and average size of each transaction. DAI and USDC have far more active primary markets than BUSD and USDT, measured in terms of number of transactions and unique primary market participants. Additionally, on average, BUSD and USDT have larger primary market transactions than DAI and USDC. Clearly, tokens that are perceived to be similar in terms of structure and function, such as USDC and USDT, can have very different underlying primary market dynamics.
Table 2. Stablecoin Primary Market Activity on Ethereum in 202222
| Number of Transactions | Avg. Tokens per Transaction (000s) | ||||||
|---|---|---|---|---|---|---|---|
| Token | No. Unique Participants | Burning | Minting | Treasury | Burning | Minting | Treasury |
| BUSD | 1717 | 373 | 370 | 8488 | 67158 | 73447 | 13578 |
| DAI* | 6780 | 56349 | 50681 | - | 1036 | 1076 | - |
| USDC* | 88341 | 81594 | 25153 | 367961 | 1630 | 5437 | 1538 |
| USDT** | 79 | 2 | 0 | 442 | 3750000 | 0 | 81082 |
As noted earlier, while viewing activity on Ethereum accounts for the vast majority of Dai, USDC, and BUSD, a majority of USDT's tokens are on Tron. Data from the Tron blockchain, accessed via Tronscan, shows that the primary market for Tron is not markedly different from Ethereum, and the dynamics observed on Ethereum are not due to missing activity on Tron in our analysis.23
Turning to the primary market activity during the de-pegging events, Figure 3 plots the aggregate number of tokens minted and burned by DAI and USDC over three comparable windows. March 10-March 15 is the period between Circle's announcement of issues with funds stuck at SVB and its announcement that it had "substantially cleared" all accumulated backlog in redemptions. These dates roughly track with the period of abnormally heightened activity on crypto markets following SVB's collapse. Two equal length windows in the months before the de-pegging are depicted for comparison. The figure reveals three notable observations. First, DAI experienced extraordinary primary market activity during this period compared with normal volumes. Second, USDC's burning activity was not out of the ordinary during this window, but its minting activity was depressed. Finally, DAI saw net gains in issuance during the event window, while USDC experienced net losses. Given that both stablecoins de-pegged during this period, future research could examine the drivers of the divergence in net issuance during the crisis.
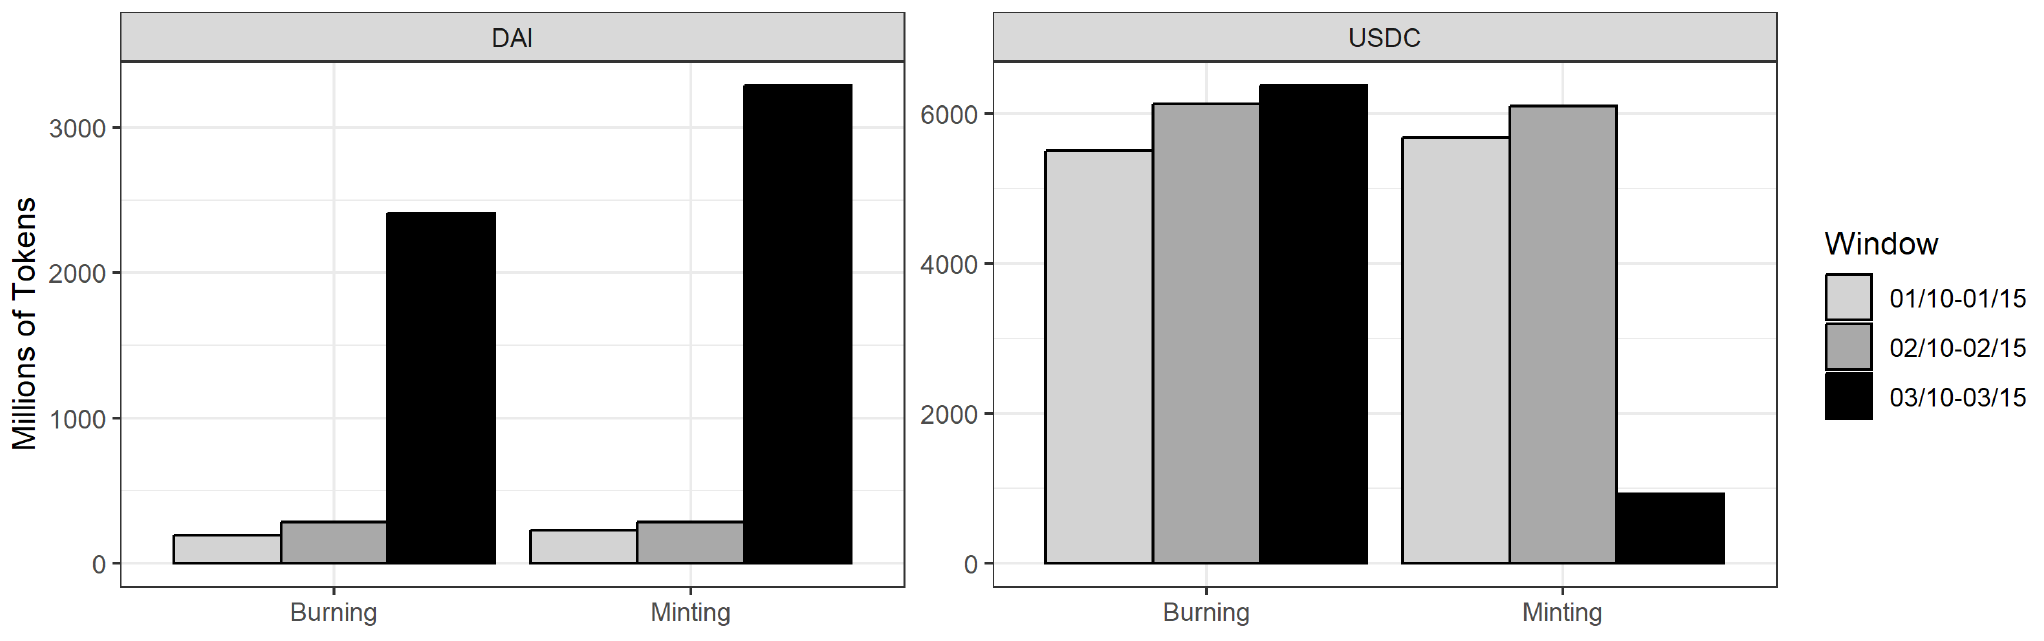
The key identifies bars in order from left to right.
Source: AWS Public Blockchain Data.
Drilling down further on USDC, Figure 4 plots the hourly number, value, and average value of mints and burns for the token over the March 10-March 15 event window. Here we are interested in observing primary market activity between Friday, March 10 and Monday, March 13, when Circle paused and resumed redemptions, respectively. In examining these transactions at the hourly level, we are able to juxtapose public statements by company officials against granular primary market dynamics. While there are a considerable number of burn transactions during this window, the gross value and average size of the transactions were limited.
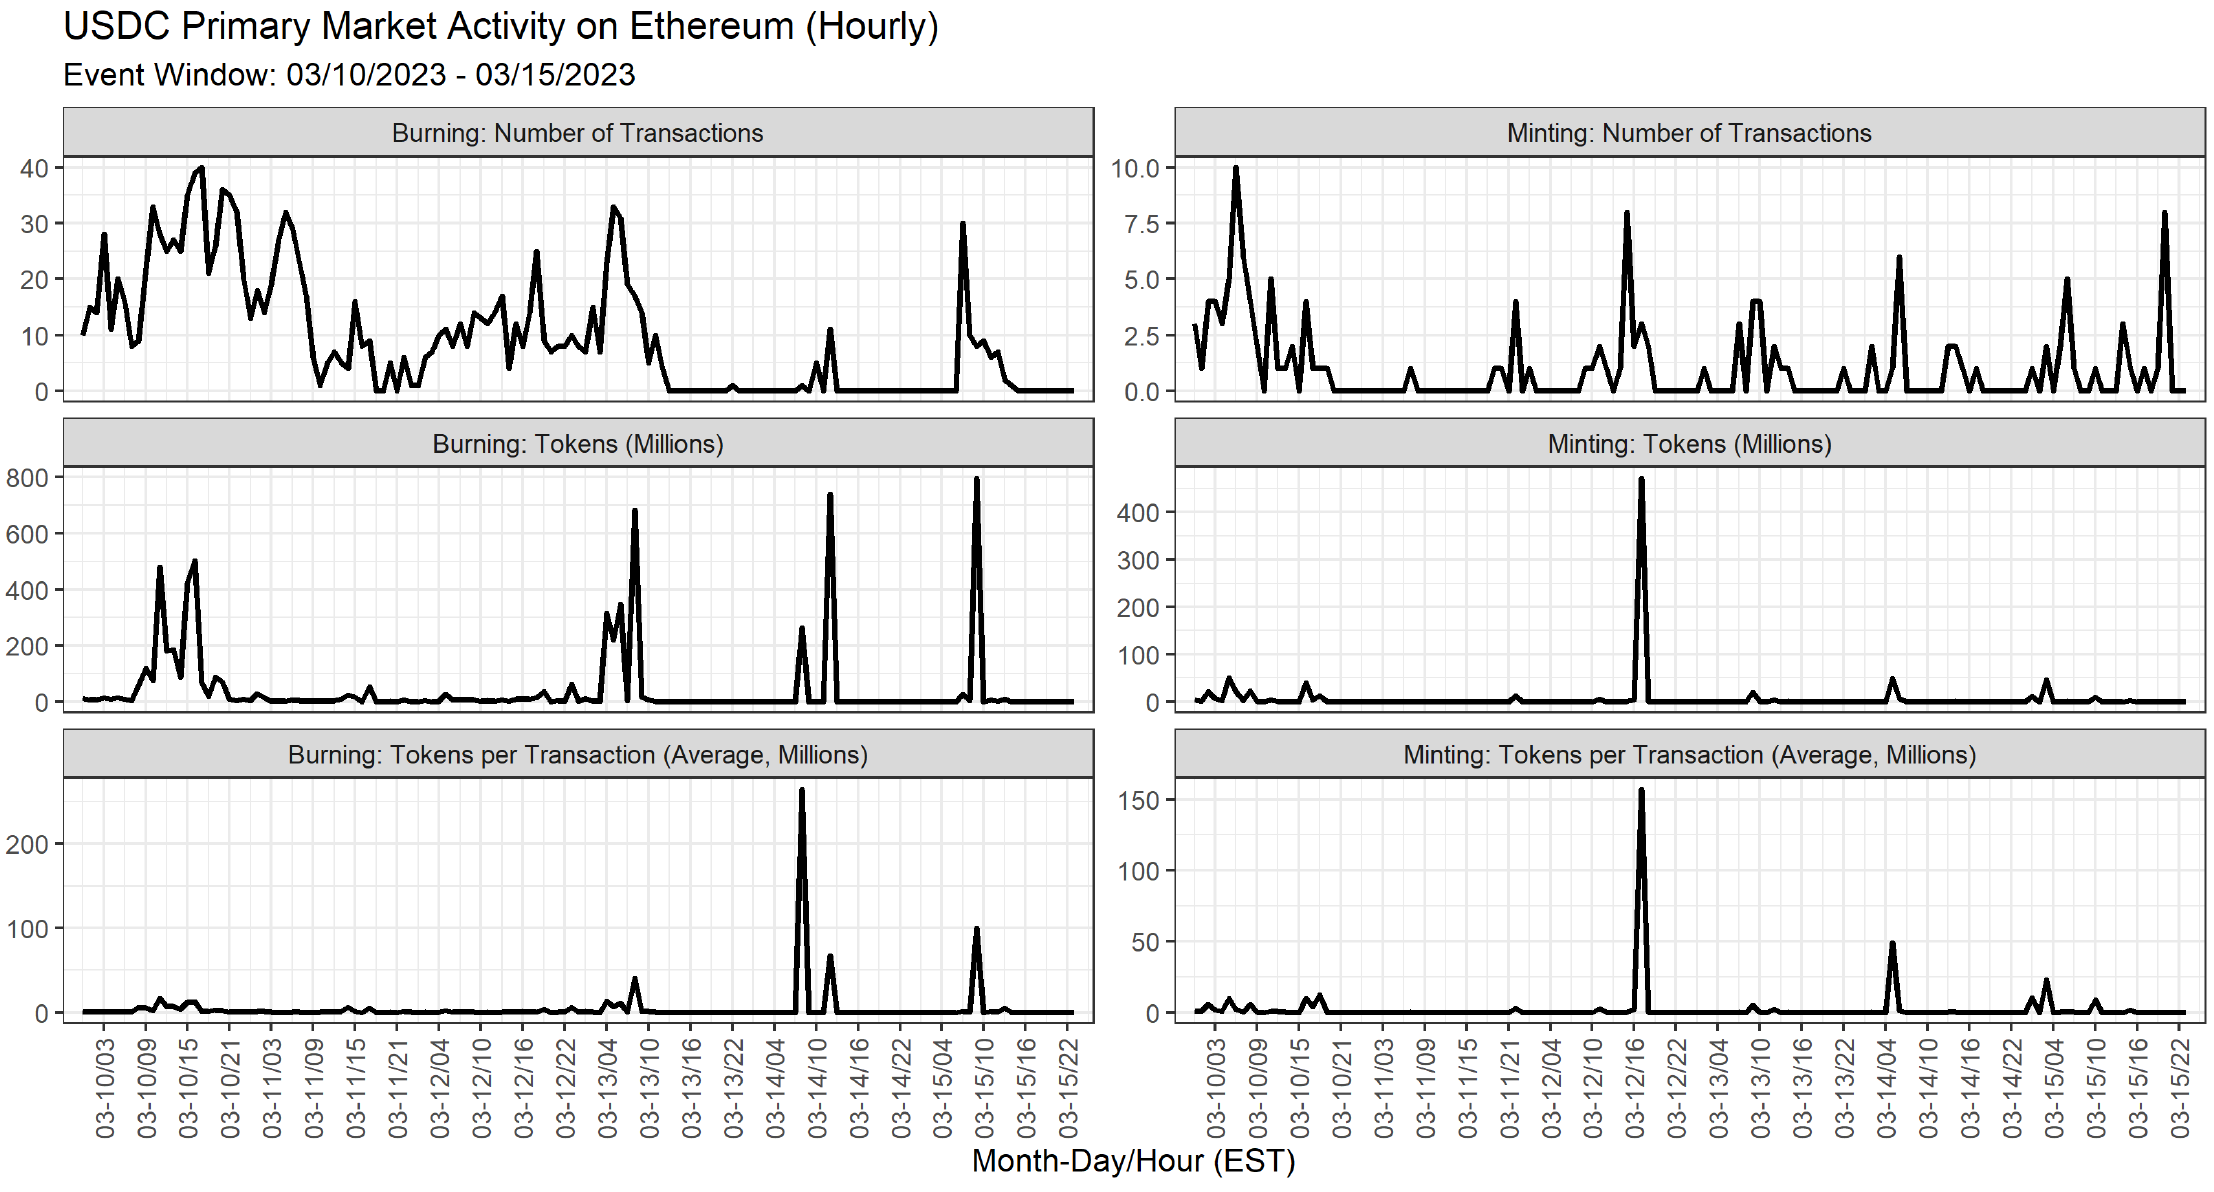
Source: AWS Public Blockchain Data.
Figure 5 graphs a daily measure of "net flows" into secondary markets between March 1 and March 20 for all four stablecoins. Before the de-pegging event window, BUSD experienced notable outflows for some time after the New York Department of Financial Services ordered Paxos to stop issuing BUSD in mid-February (NYDFS, 2023). Figure 5 shows significant negative flows for USDC during the March de-pegging events compared to the other stablecoins. On March 10, nearly 2 billion USDC tokens were removed from secondary markets, with decreased net flows over the weekend before significant outflows began again on Monday, March 13. Dai, which also de-pegged during the case study period, experienced a significant net increase in flows to secondary markets on March 11, before smaller levels of outflows ensued in the following week. USDT, meanwhile, is the only stablecoin that experienced increased flow into secondary markets during the week following the de-pegging event, potentially reflecting flight-to-safety dynamics.24 The net flows into secondary markets complements our observations of activity on secondary markets during this period. While sell pressure on USDC led to outflows from secondary markets, surprisingly, DAI experienced net inflows into secondary markets even as its price fluctuated at a similar rate.
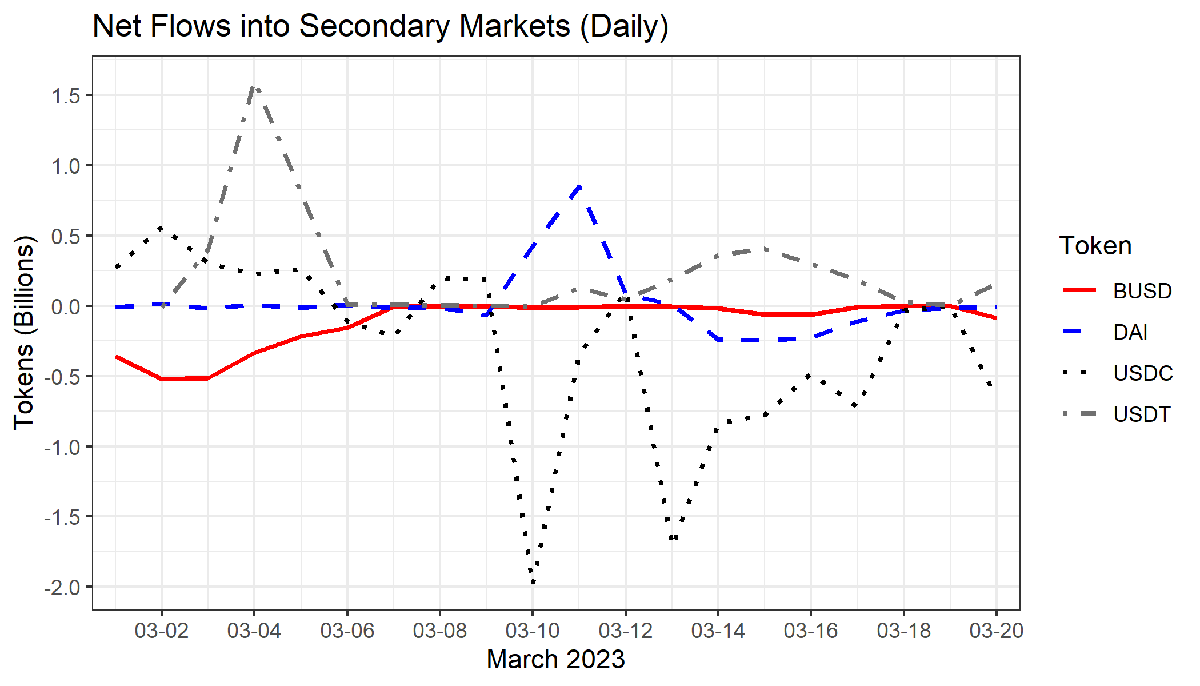
Source: AWS Public Blockchain Data. Calculation methodology from Lyons and Viwanath-Natraj (2023)
Overall, in analyzing on-chain data, we observe notable differences in primary market activity for the four stablecoins during the crisis period, and our results suggest that simply turning to pricing data on exchanges does not tell the full story of runs on stablecoins. Our analysis raises several research questions and highlights that, depending on the technical characteristics of stablecoins, primary market behavior is important for understanding stablecoin crisis dynamics.
Concluding Thoughts
In the aftermath of stablecoin market events, media reports and analysis focus on price dislocation on secondary markets, often exclusively.25 As the literature remains unresolved about how to account for the totality of stablecoin market dynamics, our technical and empirical analysis provides several insights indicating areas ripe for additional inquiry:
- Stablecoins' primary function in crypto markets is to remain stable in value. It follows that price slippage will likely hurt a stablecoin's longer-term performance, and historically such dynamics have held true. Yet price slippage alone is insufficient to explain longer-term performance outcomes for stablecoins. Indeed, during the March event, USDC experienced both dramatic price slippage and an ensuing decrease in market capitalization, and USDT traded at a premium before experiencing a rise in market capitalization. But BUSD traded at a premium while its market capitalization declined, and DAI slipped below its dollar peg before emerging from the crisis with an increased market capitalization. While some obvious factors, such as BUSD issuance being halted by regulators, contributed, additional research is necessary to evaluate other dynamics at play, and several questions remain. Why was DAI priced so similarly to USDC on secondary markets? To what extent did the different primary markets matter for these stablecoins?
- Primary markets for stablecoins differ dramatically, both in normal times and during times of crisis. Even stablecoins that might appear to operate similarly on paper – fiat-backed stablecoins like USDT and USDC, for example – are distributed through primary markets with distinct characteristics in terms of frequency, number of participants, and response to external shocks. The importance of these changes for price stability, run risk, and price recovery are worth interrogating in further detail.
- Our empirical analysis suggests that decentralized and centralized exchanges operate differently during times of crisis, though they price stablecoins very similarly. This leaves open several questions: To what extent are mechanical differences between automated market makers and limited order books, availability of fiat trading pairs, or other factors responsible for such differences? Which secondary markets are more reliable indicators of market stresses on stablecoins?
Our research aimed to present several areas worth further interrogation, and our resulting analysis raises more questions than it answers. As stablecoins continue to play a critical role in crypto-asset markets and DeFi, we believe the findings presented in this paper and the questions we raise warrant further theoretical and empirical investigation.
References
Adams, Austin, and Markus Ibert (2022). "Runs on Algorithmic Stablecoins: Evidence from Iron, Titan, and Steel ," FEDS Notes. Washington: Board of Governors of the Federal Reserve System, June 02, 2022, https://doi.org/10.17016/2380-7172.3121.
Almeida, José, and Tiago Cruz Gonçalves (2023), "A systematic literature review of investor behavior in the cryptocurrency markets," Journal of Behavioral and Experimental Finance, p. 100785.
Ante, Lennart, Ingo Fiedler, and Elias Strehle (2021), "The influence of stablecoin issuances on cryptocurrency markets," Finance Research Letters, vol. 41 (2021), p. 101867.
Baughman, Garth, Francesca Carapella, Jacob Gerszten, and David Mills (2022). "The stable in stablecoins," FEDS Notes. Washington: Board of Governors of the Federal Reserve System, December 16, 2022, https://doi.org/10.17016/2380-7172.3224.
Baur, Dirk G., and Lai T. Hoang (2021), "A crypto safe haven against Bitcoin," Finance Research Letters 38 (2021): 101431.
Capoot, Ashley (2023), "Stablecoin USDC breaks dollar peg after firm reveals it has $3.3 billion in SVB exposure," CNBC, https://www.cnbc.com/2023/03/11/stablecoin-usdc-breaks-dollar-peg-after-firm-reveals-it-has-3point3-billion-in-svb-exposure.html.
CryptoCompare, Enterprise PRO API and Custom Measures Data, https://www.cryptocompare.com/
d'Avernas, Adrien, Vincent Maurin, and Quentin Vandeweyer (2022), "Can Stablecoins be Stable?" University of Chicago, Becker Friedman Institute for Economics Working Paper 2022-131.
Egorov, Michael (2021), "Stableswap-efficient mechanism for stablecoin liquidity," https://berkeley-defi.github.io/assets/material/StableSwap.pdf.
Ehrlich, Steven and Nina Bambysheva (2022), "Inside Tether, Crypto's (So Far) Unbreakable Buck," Forbes, https://www.forbes.com/sites/stevenehrlich/2022/12/21/inside-tether-cryptos-so-far-unbreakable-buck/?sh=6e9dd25373fa.
Gorton, Gary B., Elizabeth C. Klee, Chase P. Ross, Sharon Y. Ross, and Alexandros P. Vardoulakis (2023), "Leverage and Stablecoin Pegs," https://cowles.yale.edu/sites/default/files/2023-04/Leverage%20and%20Stablecoin%20Pegs_April%202023.pdf.
Grobys, Klaus, Juha Junttila, James W. Kolari, and Niranjan Sapkota (2021), "On the stability of stablecoins," Journal of Empirical Finance vol. 64, pp. 207-223.
Huang, Vicky Ge, Hannah Miao, and Caitlin Ostroff (2023), "Circle's USDC Stablecoin Breaks Peg With $3.3 Billion Stuck at Silicon Valley Bank," The Wall Street Journal, https://www.wsj.com/articles/crypto-investors-cash-out-2-billion-in-usd-coin-after-bank-collapse-1338a80f.
Liao, Gordon Y. and John Caramichael (2022). "Stablecoins: Growth Potential and Impact on Banking," International Finance Discussion Papers 1334. Washington: Board of Governors of the Federal Reserve System, https://doi.org/10.17016/IFDP.2022.1334.
Lyons, Richard K., and Ganesh Viswanath-Natraj (2023), "What keeps stablecoins stable?" Journal of International Money and Finance, vol. 131, p. 102777.
New York Department of Financial Services (2023), "Notice Regarding Paxos-Issued BUSD," press release, February 13, https://www.dfs.ny.gov/consumers/alerts/Paxos_and_Binance.
Saggu, Aman (2022), "The intraday bitcoin response to tether minting and burning events: Asymmetry, investor sentiment, and "whale alerts" on twitter," Finance Research Letters, vol. 49, p. 103096.
1. The views expressed in this paper are solely those of the authors and should not be interpreted as reflecting the views of the Board of Governors or the Federal Reserve System. The authors would like to thank David Mills, Sonja Danburg, Jillian Mascelli, Nathan Palmer, Francesca Carapella, Kirstin Wells, and Sarah Wright of the Federal Reserve Board for their feedback. Return to text
2. See their announcement on Twitter here: https://twitter.com/circle/status/1634391505988206592?lang=en. Return to text
3. Circle, the stablecoin USDC's issuer, offers further explanation of USDC's role in decentralized exchanges here, (https://www.circle.com/blog/usd-coin-and-amms-the-role-of-usdc-in-defi-trading). Return to text
4. For a further explanation of the most popular crypto-collateralized stablecoin, Dai, see their whitepaper here, (https://makerdao.com/whitepaper/DaiDec17WP.pdf). Return to text
5. Baughman et al. (2022) further differentiate between algorithmic stablecoins who use a rebate model versus a coupon model to maintain their pegs. Return to text
6. The endogeneity of backing assets to the same system as the issued stablecoin has led some to call algorithmic stablecoins "unbacked" stablecoins. Return to text
7. Researchers and market participants have argued that the long-term viability of any algorithmic stablecoin is impossible. D'Avernas (2022) offers (https://www.adriendavernas.com/papers/stablecoins.pdf) a theoretical model that suggests the inability of various partially or entirely backed stablecoin designs to maintain their pegs over the long run. Return to text
8. For example, see the StableSwap whitepaper (Egorov 2019). Return to text
9. See their announcement on Twitter here: https://twitter.com/circle/status/1634391505988206592?lang=en. Return to text
10. See Circle's Terms of Use for differences between direct customers of Circle and general holders here: https://www.circle.com/en/legal/usdc-terms. Return to text
11. Circle, “An Update on USDC and Silicon Valley Bank,” https://www.circle.com/blog/an-update-on-usdc-and-silicon-valley-bank. Return to text
12. "On-chain" refers to operations on the blockchain itself, while "off-chain" refers to messages, payments, and other operations processed outside of the blockchain network. For example, a stablecoin issuer might receive requests to redeem stablecoins through an avenue external to the blockchain, and payments of fiat to the customer's bank account are conducted entirely off-chain. On-chain operations would include the transfer of tokens between the customer and the issuer. Return to text
13. We used Etherscan to access numbers on BUSD holders here: https://etherscan.io/token/0x4fabb145d64652a948d72533023f6e7a623c7c53#balances. Accessed July 28, 2023. Return to text
14. Tokens like stablecoins are issued on blockchains, and can be transferred between entities much like the native cryptocurrencies of these blockchains (e.g. ETH). This method of "locking" tokens on some blockchains to issue representations of them on other blockchains is also known as "bridging." Return to text
15. MakerDao provides more details on using these smart contracts here: https://blog.makerdao.com/youve-learned-how-to-open-a-maker-vault-now-what/. Return to text
16. Lyons and Viswanath-Natraj (2023) describe the importance of PSM as an additional, decentralized arbitrage mechanism for Dai. Return to text
17. Stablecoins are often issued on multiple blockchains; for example, Tron and Ethereum are two separate blockchain networks on which USDT and USDC are issued. Return to text
18. Market Cap sourced from DeFi Llama. Number of unique holders and concentration of ownership on Ethereum according to Etherscan, accessed July 26, 2023. Percent issued on Ethereum according to Defillama.com. Return to text
19. Automated market makers are smart-contract-facilitated methods of setting the exchange rate between two or more assets held in a "pool" of funds, called a liquidity pool. Unlike traditional limit order books, a predetermined formula is used based on the relative quantities of the assets held in the pool – when a pool of Asset A and Asset B becomes skewed, with traders exchanging a lot of Asset A for Asset B, the formula sets a new exchange rate that incentivizes swapping back more of Asset B for Asset A at a predetermined rate. Pools of stablecoins pegged to the same currency can provide an additional source of stability to the peg. The extent to which this different functionality induces different trading behavior is unclear. Return to text
20. We calculated exchange rates given by Curve, a DEX, using on-chain data, and found no notable differences in pricing patterns of DAI, USDC, and USDT compared to major CEXs. BUSD is not widely traded on DEXs. Return to text
21. The smart contract function associated with these actions executes such transactions by calling a transfer of tokens to or from a "null address." We track mints and burns by documenting every transfer of tokens to and from the null address for each token. Return to text
22. Data source: AWS Public Blockchain Data, accessed 2023-07-28, https://registry.opendata.aws/aws-public-blockchain. Notes: *DAI's primary market is not intermediated by a treasury wallet as it is for centralized stablecoins; ** We follow Lyons and Viswanath-Natraj (2023), tracking tokens minted and burned between the null address for DAI, BUSD, and USDC, and the address "0xc6cde7c39eb2f0f0095f41570af89efc2c1ea828" for USDT. Return to text
23. As of July 25, 2023, according to Etherscan and Tronscan, Tether's treasury wallet has executed fewer than 5,000 transactions in its history on Ethereum, and less than 8,000 times on Tron. Circle's treasury wallet has executed 850,000 transactions on Ethereum. Return to text
24. During the March event, USDT was perceived to be the safer stablecoin to hold, as its issuer did not appear to rely on SVB or other affected banks for cash reserves. However, this has not always been the case – in fact, this dynamic represents a departure from wide-spread treatment of USDT as a comparatively less safe stablecoin given past scrutiny over its issuer, Tether. For example, see media reporting on Tether's business here: https://www.forbes.com/sites/stevenehrlich/2022/12/21/inside-tether-cryptos-so-far-unbreakable-buck/?sh=5fc98b073fa5. Return to text
25. For example, see Huang, Miao, and Ostroff (2023). Return to text
Watsky, Cy, Jeffrey Allen, Hamzah Daud, Jochen Demuth, Daniel Little, Megan Rodden, and Amber Seira (2024). "Primary and Secondary Markets for Stablecoins," FEDS Notes. Washington: Board of Governors of the Federal Reserve System, February 23, 2024, https://doi.org/10.17016/2380-7172.3447.
Disclaimer: FEDS Notes are articles in which Board staff offer their own views and present analysis on a range of topics in economics and finance. These articles are shorter and less technically oriented than FEDS Working Papers and IFDP papers.