FEDS Notes
February 23, 2024
Private Credit: Characteristics and Risks1
Fang Cai, and Sharjil Haque
On February 26, 2024, a correction was made to fix a typo for the data source from Pitchbook to KBRA DLD in Figure 13.
What is Private Credit?
Private credit or private debt investments are debt-like, non-publicly traded instruments provided by non-bank entities, such as private credit funds or business development companies (BDCs), to fund private businesses.2 Private credit is typically extended to middle-market firms with annual revenues between $10 million and $1 billion, but has grown rapidly in recent years to fund larger companies that were traditionally funded by leveraged loans.
Private credit typically involves the bilateral negotiation of terms and conditions to meet the specific needs and objectives of the individual borrower and lender, without the need to comply with traditional regulatory requirements. Such bilateral origination of a loan between a single borrower and lender is often referred to as "direct lending" but deals that involve a small group of lenders can be considered direct lending as well. Loans from direct lending funds are typically senior secured while other private credit strategies can invest in more junior parts of the capital structure; almost all private credit loans are floating rate.3
Given the absence of a liquid secondary market for many private credit instruments, lenders typically hold these loans until maturity or a refinancing event. As a result, these loan contracts can include features uncommon to traditional bank loans, such as a structured equity component, high prepayment penalties, or a role in oversight or management of the company.
Who Invests in Private Credit and Why?
Survey evidence from academic studies show that the largest investors, or Limited Partners (LP), in private credit funds are pension funds, insurance companies, family office, sovereign wealth funds and high net worth individuals.4 These institutional investors invest in private debt due to various factors such as portfolio diversification, low correlation to public markets and relatively high returns.
The Federal Reserve Board's Financial Stability Report (FSR) published in May 2023 showed that, based on Form PF data as of Q4 2021, public and private pension funds held about 31 percent ($307 billion) of aggregate private credit fund assets. Other private funds made up the second-largest cohort of investors at 14 percent ($136 billion) of assets, while insurance companies and individual investors each had about 9 percent ($92 billion).5
Over the past decade, the asset class, particularly direct lending, has generated higher returns than most other comparable asset classes, including 2-4 percent over syndicated leveraged loans. Borrowers have been willing to pay a premium for the speed and certainty of execution, agility, and customization that private lenders offer. Additionally, private debt funds have attracted highly leveraged borrowers that are unable to get adequate funding from heavily regulated banks.
Market Size and Recent Growth of Private Credit and Direct Lending
Figure 1 reports the growth of private credit since 2000, including all private credit strategies (left panel) and direct lending only (right panel). The left panel shows that total private credit has grown exponentially in recent years, reaching nearly $1.7 trillion, comparable to those of leveraged loans (roughly $1.4 trillion) and high-yield (HY) bond markets (about $1.3 trillion). The right panel shows that the growth of private credit is most pronounced for direct lending, which amounts to $800 billion, or about one half of the total.6 There is also growing amount of committed but uninvested capital (or 'dry powder') in the industry, suggesting supply of private credit funding is outstripping demand for private loans.
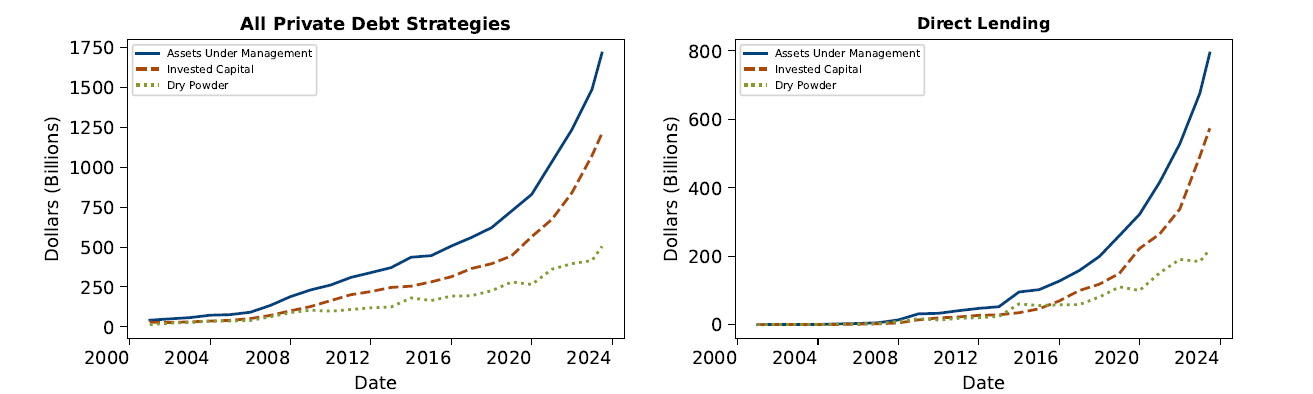
Note: ‘Dry Powder’ refers to committed but not invested capital. Invested capital is committed & invested capital (typically in the form of loans). Assets under management is the sum of invested capital and dry powder. Data as of June 2023. AUM data reported with a 6-month lag.
Source: Preqin
Figure 2 reports top 20 U.S. private credit fund managers including all strategies (left panel) and direct lending only (right panel), based on total dollar value of assets under management as of June 2023. The sector is heavily concentrated in a few large fund managers such as Oaktree, Ares, Goldman Sachs, HPS Investment and Blackstone. A large share of dry powder is also held by the top 5 fund managers, suggesting disproportionately high demand for these fund managers by LPs. Staff estimate that top 10 U.S. private debt fund managers hold about 40-45 percent of all dry powder in the U.S., across all private debt strategies.7
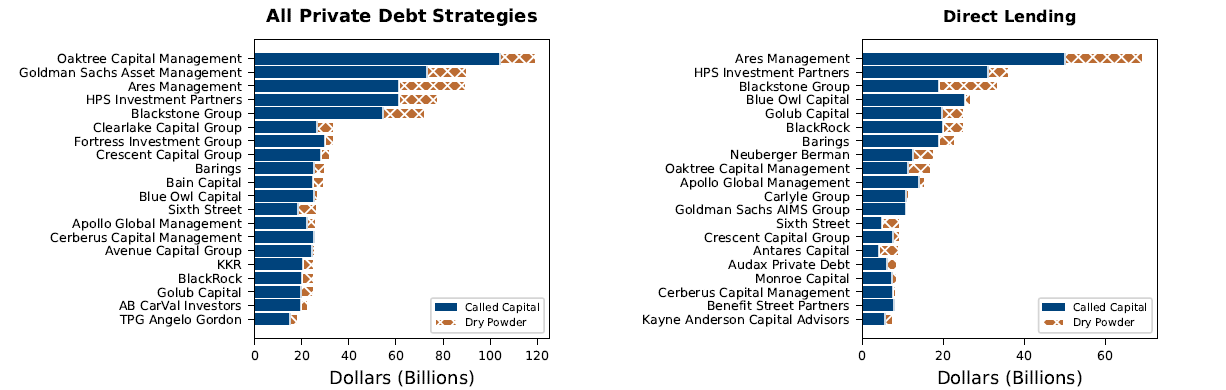
Note: This chart plots aggregate assets under management (split by called capital or invested capital, and dry powder) sorted by private credit firm. For each firm, all fund level private credit funds are aggregated.
Source: Preqin
Characteristics of Private Credit using Loan-level Data
As private credit continues to grow rapidly as a new frontier for nonbank lending, the scarcity of available data has made it challenging to assess risks in this market. Private credit funds invest in loans with varying characteristics. These loans are generally senior secured and floating rate. This section discusses some key characteristics of private credit loans, based on a new sample of around 17,000 unique private credit loans originated by 718 private debt funds and BDCs from Pitchbook, where both borrowers and private debt lenders are U.S.-based. The sample covers all private credit strategies from 2013-2023.8
Figure 3 reports the number of loans and Figure 4 shows average loan and deal size. We observe the average size of loans has increased in recent years and exceeded $80 million since 2022, which is much larger than the standard loan size in bank-dependent borrowers observed in the Federal Reserve's Y-14Q H1 collection on commercial loans.9 A single loan is typically part of a loan-deal (with multiple credit facilities), and we also note that the average deal size is much larger compared to the average loan size. For majority of these loans, the data show that the borrower is backed by a private equity sponsor.10
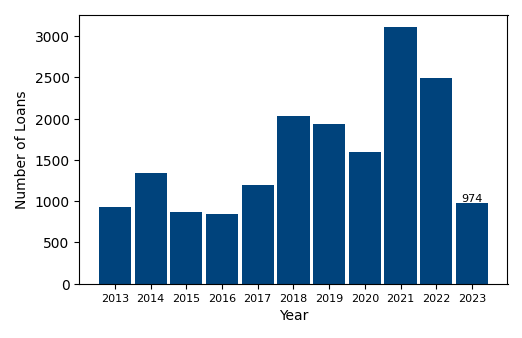
Note: This chart reports the raw number of newly originated loans in a given year.
Source: Pitchbook
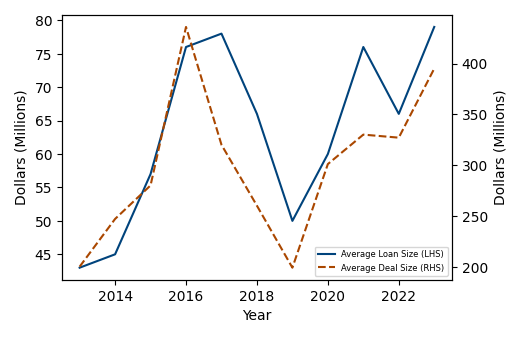
Note: This chart reports the mean deal and loan size across the loan-year distribution.
Source: Pitchbook and authors' calculations
Loan Type and Pricing
Figure 5 shows that more than two thirds of private credit is term loans. In addition, about 15 percent of private credit takes the form of hybrid loan pari passu, which is more junior in the capital structure in the event of default and thus implies greater risk than senior secured loans.
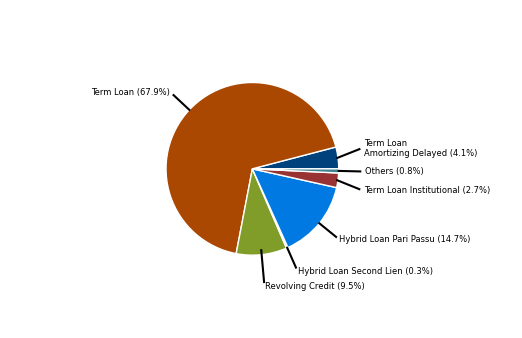
Note: Hybrid Loans refer to loan facilities where senior and subordinated debt is combined into one single loan facility, with a blended interest rate that falls between the two debt types.
Source: Pitchbook
Figure 6 shows that the average loan spread declined in recent years before rising again in 2022, following the Fed's rate hike cycle. Comparing private credit loan spread with spreads observed in institutional Term Loan B in the leveraged loan market, we observe that the spread on private credit loans is generally higher, and the gap in spreads between the two types of loans declined in recent years to below 200 basis points before widening again in 2023. The difference in spreads is consistent with the riskier profiles of private credit borrowers relative to syndicated loan borrowers. Part of the difference could also be attributable to private debt funds requiring additional compensation for holding these loans in their books.
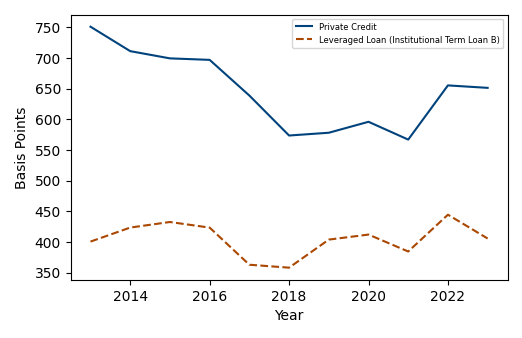
Note: This chart plots average spreads above a benchmark interest rate (LIBOR or SOFR, mostly SOFR from 2022 onwards) in a given year for private credit and leveraged loans.
Source: Pitchbook and authors' calculations
Rollover Risk
To examine rollover risk, we consider the maturity wall of private credit (Figure 7) and observe that debt maturities are spread out evenly over the coming years, with around 16 percent of outstanding debt due in 2024. The average maturity in private credit has generally been around 5 years (Figure 8).
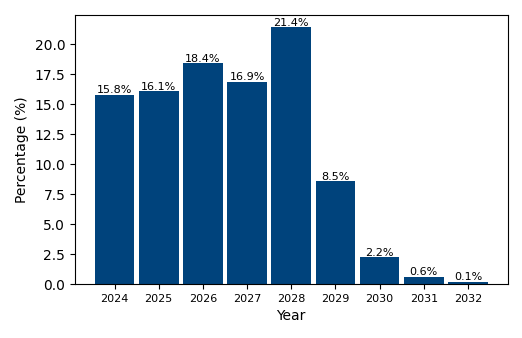
Note: This chart reports the share of loans (in dollar value) that will mature, based on maturity date provided for a single loan facility in Pitchbook.
Source: Pitchbook and authors' calculations
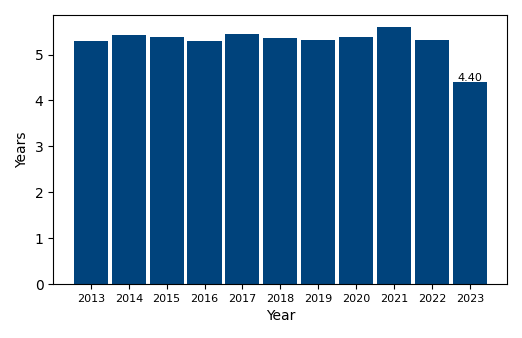
Source: Pitchbook and authors' calculations
Figure 9 shows the top Deal Types (uses of proceeds) are for general corporate purposes (e.g., working capital needs), debt refinancing and private equity deals (leveraged buyouts and growth equity investments). It is worth noting many refinancing activities are also driven by borrowers backed by a PE-sponsor. Examining private credit spreads by these different deal types, we observe private equity deals (growth/expansions and leveraged buyouts) experienced substantially larger increase in borrowing cost during the 2022 rate hike cycle (Figure 10). Higher sensitivity to the rate hike cycle indicates PE deals generally involve relatively riskier borrowers, for example, because they carry more leverage.11
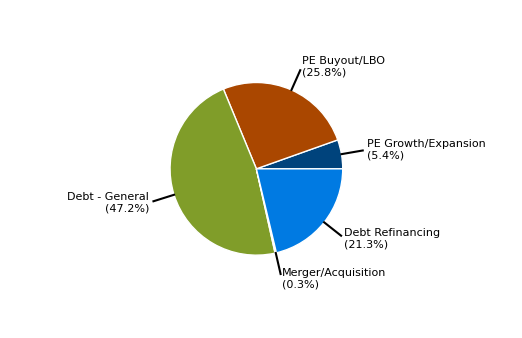
Source: Pitchbook and authors' calculations
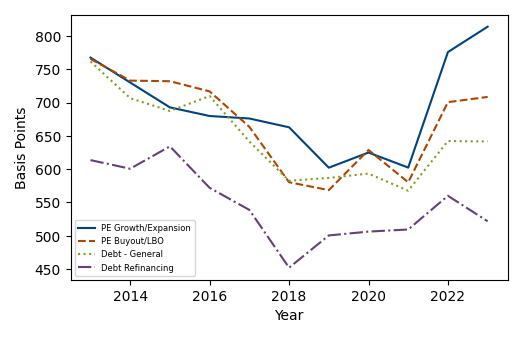
Note: This chart plots average loan spreads on private credit loans split by deal type.
Source: Pitchbook and authors' calculations
Rise of Club Deals
An interesting trend is that, for a given loan facility, the average number of private debt lenders has increased over time (Figure 11). This pattern suggests private creditors are increasingly relying on "club deals" to share credit risk exposure to a single borrower. Higher number of lenders in a single commitment also allows creditors to fund larger borrowers, consistent with the rise in average loan size shown above.
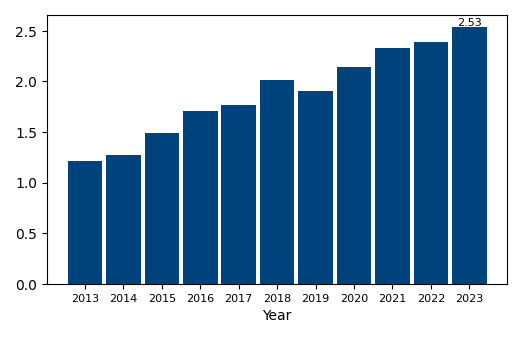
Note: This chart reports the number of lenders in a given loan facility, which are identified directly by looking at the identity of each lender.
Source: Pitchbook and authors' calculations
Interest Coverage
The average interest coverage ratio (ICR)––a key liquidity risk metric––displayed a significant decline in recent quarters (Figure 12), indicating weakening debt service capacity.12 With mean interest coverage of around 2.0x, a significant slowdown in economic conditions could lead to further deterioration of cash flows (EBITDA) and greater difficulty in making debt payments. For comparison, ICR in leveraged loan borrowers is slightly higher at around 2.7x as of 2023, according to data from LCD.13
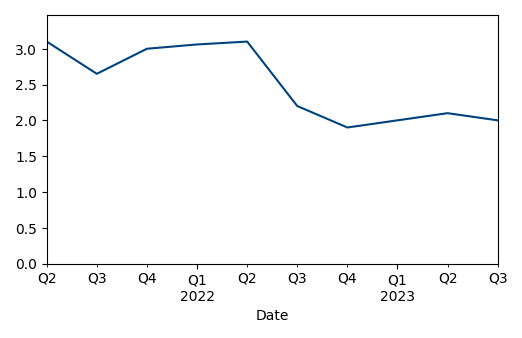
Note: This chart plots average interest coverage ratio across the distribution of borrowers covered by KBRA in a given quarter.
Source: KBRA DLD
Default Rate
Nevertheless, year-to-date default rates have generally been low, compared to the broadly syndicated loan market or HY bond market, particularly in direct lending (Figure 13). Low default rates can be attributed to (i) low interest rates for most of the past 10 years and (ii) periodic monitoring of borrowers through loan covenants, as well as the ability to renegotiate flexibly with a relatively small group of creditors when borrowers are in distress.14 However, industry commentary suggest recent deals are devoid of financial maintenance covenants as private credit managers look to compete with banks in the large corporate market segment.15 Moreover, a recent study by S&P Global finds that repeat-defaults were marginally more likely in private credit funded borrowers, and the average time span between repeat-defaults is shorter among borrowers with private credit compared to those without.16 It is important to note that the industry has yet to go through a prolonged recession.
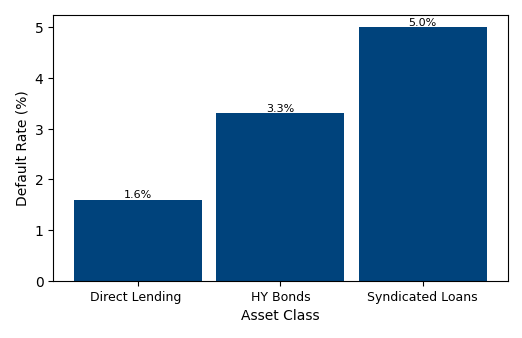
Note: This chart plots year-to-date default rates across various asset classes in 2023 as reported by KBRA DLD.
Source: KBRA DLD
Loss Given Default
An important trend related to loss given default is that the share of private credit loans with 1st liens on the borrower's assets has increased significantly over time (Figure 14). Despite this seniority in debt structure, private credit loans have relatively low recovery rate upon default (or equivalently, exhibit high loss given default) compared to syndicated loans or HY bonds, as shown in Figure 15. Post-default value of a direct loan is around 33 percent, while those in syndicated loans and HY bonds are 52 and 39 percent respectively.
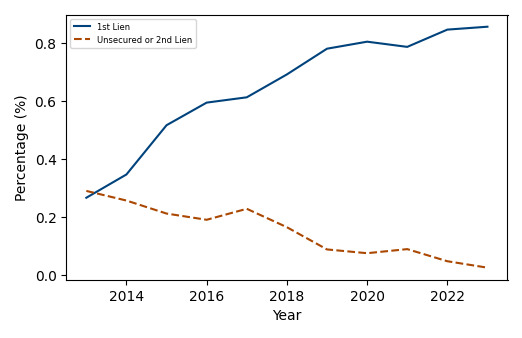
Note: This chart reports the share of loans with a 1st lien for a given private credit loan facility as reported in Pitchbook in the navy blue line. The orange line reports the share of unsecured or 2nd lien loans. For a small share of loans, Pitchbook only reports if the loan is secured or not, thus the total of the two line will not necessarily add to 100 percent.
Source: Pitchbook and authors' calculations
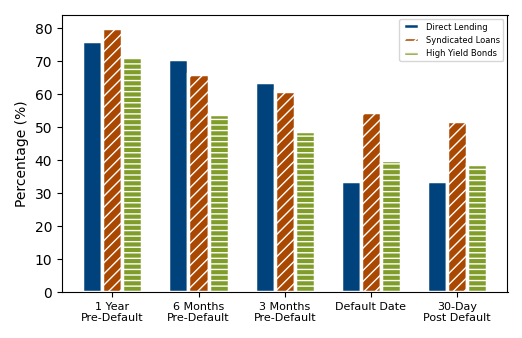
Source: KBRA DLD
The key reason for the low recovery rate upon default is that more than half of all value-weighted private credit is provided to borrowers in sectors with relatively low collateralizable or tangible assets such as software, financial services or healthcare services (Figure 16), and thus have lower recovery rate for every dollar of defaulted loans. Higher loss given default increases the likelihood of fund-level impairment and thus ultimately hurts investor returns.
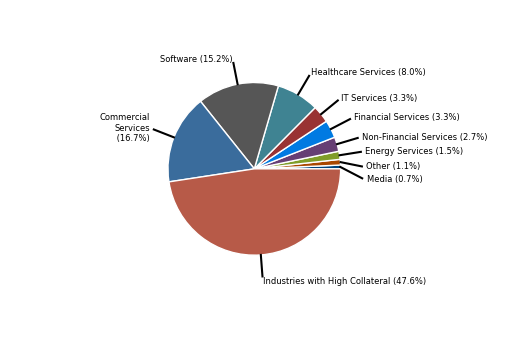
Note: Pitchbook reports one primary sector for a given borrower. Staff made conservative assumption when identifying sectors that likely have relatively lower tangible assets, and grouped all others into a category called 'Industry with High Collateral'. Thus, for sectors where asset tangibility is not fully clear, staff categorized it as a 'high collateral sector'.
Source: Pitchbook and authors' calculations
Financial Stability Implications of Private Credit
The May 2023 FSR pointed out that redemption and fire sale risks posed by private credit seems to be low, largely due to its long lock-up periods (as high as 10 years) and low leverage or derivative exposures. However, there are other financial stability implications worth to monitor for this relatively opaque sector as its footprint in nonbank lending continues to grow.
Illiquidity
Private credit loans are illiquid due to the lack of a secondary market. There is limited market discovery, and investors acquiring these loans should expect to hold them to maturity or face steep losses in need of an emergency exit.
Rise in corporate leverage and default
Given relatively low collateralizable assets and high leverage, it is likely that a significant share of borrowers would not be able to obtain adequate financing in the absence of private credit. This view is consistent with persistently higher spreads in private credit relative to syndicated loan borrowers in Figure 6. Therefore, an important implication is that private credit raises overall corporate leverage, potentially making the corporate sector more vulnerable to financial shocks. In the environment of inflation and rising interest rates, higher interest payments on floating-rate debt could stress borrowers' balance sheets, leading to a significant increase in defaults in an economic downturn.
Dry Powder and deterioration in credit quality
Excessive growth in dry powder and continued competition with banks could compromise underwriting standards. Dry powder has grown tremendously in private credit, particularly in direct lending. For example, relative to 2014, dry powder has nearly quadrupled. Since private credit managers have a mandate to deliver high returns to LPs within a fixed timeframe, fund managers might choose riskier deals, offer more covenant-lite loans, or more generally reduce underwriting standards as opportunities dry up when the economy slows down. Combined with high concentration of dry powder within a few funds, fund managers run the risk of structuring deals poorly going forward in order to boost internal rate of return. Deterioration in deal quality can raise future defaults, hurting fund performance and investors' returns, given relatively low recovery.
Potential spillover to other nonbank institutions
Given that fund managers have the contractual right to obtain committed capital at any point in time, investors such as insurance companies or pension funds run the risk of needing to honor capital calls when credit conditions worsen, even when their own liquidity conditions are under stress. For example, property & casualty (P&C) insurers can face a surge in short-term claims stemming from exogenous liquidity shocks such as natural disasters. Since P&C insurers are obligated to pay out short-term claims, exposure to private debt can exacerbate liquidity problems if fund managers make capital calls at the same time.
Interconnections with banks
While bank lending to private credit funds appears moderate, there are growing interconnections between these two types of lenders. First, banks are increasingly partnering with private credit funds to fund new deals.17 Second, banks are progressively selling complex debt instruments to private fund managers in so-called "synthetic risk transfers" in order to reduce regulatory capital charges on the loans they make.18 Such instruments have limited transparency and pose hidden risks to the financial system, especially as the industry has yet to endure a prolonged recession. Relatedly, there is growing concern that tighter regulations such as Basel III endgame could intensify migration of credit from banks to private credit lenders. Considering borrower risk profiles, such substitution is less likely to occur to bank-held loans, and more so with syndicated leveraged loans. In such cases, banks stand to lose underwriting fees to private credit funds. These developments suggest that private credit will become increasingly important to credit market functioning.
References
Block, J., Y.S. Jang, S. Kaplan, and A. Schulze, 2023, A Survey of Private Debt Funds, National Bureau of Economic Research.
Brown, G., 2021, Debt and Leverage in Private Equity: A Survey of Existing Results and New Findings, The Private Equity Research Consortium and The Institute for Private Capital.
Gompers, P., S. Kaplan, and V. Mukharlyamov, 2015, What do Private Equity Firms Say They Do?, Harvard Business School working paper 15-081.
Haque, S., 2023, Does Private Equity Over-Lever Portfolio Companies, Finance and Economics Discussion Series, Board of Governors of the Federal Reserve System.
Haque, S., Y.S. Jang, and S. Mayer, 2022, Private Equity and Corporate Borrowing Constraints: Evidence from Loan Level Data, working paper.
1. Authors: Fang Cai and Sharjil Haque. We thank Siddhartha Lewis-Hayre for his excellent research assistance. The views expressed here are strictly those of the authors and do not necessarily represent the views of the Federal Reserve Board or the Federal Reserve System. Return to text
2. A private credit fund is a closed-end pooled investment vehicle that originates or invests in loans to private businesses. It is not required to be registered or regulated as an investment company under the Investment Company Act. A BDC is a closed-end investment company, created through the Small Business Investment Incentive Act of 1980, to stimulate the flow of capital to small- and mid-sized private businesses. Return to text
3. Beside direct lending, other major private credit strategies include Mezzanine, Special Situations, Distressed Debt, Venture Debt and Infrastructure Debt. Return to text
4. See Block et al. (2023). Return to text
5. See the box "Financial Stability Risks from Private Credit Funds Appear Limited" in Board of Governors of the Federal Reserve System, Financial Stability Report (Washington: Board of Governors, May 2023), pp. 45–47, https://www.federalreserve.gov/publications/files/financial-stability-report-20230508.pdf. Return to text
6. Preqin's definition of direct lending includes senior debt, unitranche debt, subordinated debt and blended/opportunistic debt. It does not include loans provided by publicly-traded BDCs in its definition of direct lending. Staff estimate total direct lending AUM inclusive of BDC-originated direct loans as of June 2023 to be around $950 billion-$1 trillion. Return to text
7. This calculation is based on a 25-30 percent dry powder assumption and a 61 percent market share of U.S.-based funds, which is sourced from Pitchbook. Return to text
8. This dataset at loan-issuance level is sourced from Pitchbook and contains private credit originated loans only. The sample is restricted to the universe of private credit lenders and borrowers in the United States. Return to text
9. For a detailed description of loan characteristics of bank dependent borrowers, see Haque, Jang and Mayer (2022). Return to text
10. Private equity (PE) sponsor 'backing' refers to PE funds owning equity in these companies, typically through leveraged buyouts. Since sponsors control the equity in the firm, they are generally involved in making strategic decisions related to the company's management, operations, and capital structure. See, for instance, Gompers, Kaplan and Mukherlyamov (2015). Prior studies such as Haque, Jang and Mayer (2022) have also found that PE sponsors inject equity into portfolio companies that are in distress. Return to text
11. See Brown (2021) and Haque (2023) for analysis on leverage in PE deals. Return to text
12. The interest coverage ratio is calculated as EBITDA/interest expense. A ratio below 1 indicates a borrower does not generate enough cash flows from operating business to repay periodic interest payments. Return to text
13. See (https://www.lcdcomps.com/lcd/n/article.html?rid=170&aid=12504728&viewTracking) As rate pressure bites, leveraged loans' loss-absorbing debt cushion weakens | Leveraged Commentary & Data (lcdcomps.com) Return to text
14. Industry reports suggest that private debt funds, particularly direct lenders, use loan covenants more frequently than banks and hence are able to better monitor their borrowers. This argument is inconclusive since greater number of, or tighter covenants, is a natural response to the relatively higher risk profile of companies that borrow from private debt funds. Low-risk borrowers that generate stable cash flows do not necessarily require tight covenants or frequent monitoring. Return to text
15. See (https://www.bloomberg.com/news/articles/2023-10-26/private-credit-lenders-giving-up-protections-to-win-bigger-deals) Private Credit Lenders Giving Up Protections to Win Bigger Deals - Bloomberg Return to text
16. See (https://www.spglobal.com/en/research-insights/featured/special-editorial/buying-time-post-default-with-private-credit) Buying Time Post-Default with Private Credit | S&P Global (spglobal.com) Return to text
17. See (https://www.bloomberg.com/news/articles/2023-11-01/jpmorgan-jpm-is-said-to-seek-out-a-partner-for-private-credit-push) JPMorgan (JPM) Is Seeking Out a Partner for Its Private Credit Push - Bloomberg Return to text
18. See (https://www.wsj.com/finance/banking/bank-synthetic-risk-transfers-basel-endgame-62410f6c) Big Banks Cook Up New Way to Unload Risk - WSJ Return to text
Cai, Fang, and Sharjil Haque (2024). "Private Credit: Characteristics and Risks," FEDS Notes. Washington: Board of Governors of the Federal Reserve System, February 23, 2024, https://doi.org/10.17016/2380-7172.3462.
Disclaimer: FEDS Notes are articles in which Board staff offer their own views and present analysis on a range of topics in economics and finance. These articles are shorter and less technically oriented than FEDS Working Papers and IFDP papers.