FEDS Notes
September 24, 2020
Retrospective: The Agency MBS Market on October 15, 20141
James Collin Harkrader and Michael Puglia
This FEDS Note is the third in a three-part series on Treasury and agency MBS market structure. The time period under study in this series ends in 2019 and therefore does not consider the significant events that have occurred in Treasury and agency MBS markets in 2020. These events will no doubt be a subject of study for many years to come and we intend for this series to inform ongoing and future work on this topic.
The events in Treasury markets during the so-called "Flash Rally" on October 15, 2014 elicited a significant and ongoing response from the official sector to better understand the structure of the Treasury market and the effect that electronification has had on liquidity and market functioning. The Joint Staff Report (JSR) (PDF), published in July 2015, was a major milestone in this effort and took a detailed look at trading activity in the Treasury cash and futures market on that day.
Five years have passed since the JSR was published. In addition to analyzing the events of the day, the JSR also outlined next steps for the official sector to take in its study of the evolving structure of the US Treasury market. Importantly, it advised "an assessment of the data available to the public and to the official sector on U.S. Treasury cash security markets," which ultimately gave rise to FINRA's TRACE Treasury data collection rule (PDF). In addition, the JSR recommended "further study of the evolution of the US Treasury market and its implications for market structure and liquidity." In this spirit, and to complement both the JSR and other2 work published on the topic, in this note we take a look back at events in the agency MBS market on October 15, 2014 in order to build a more complete picture of what transpired in fixed income markets on the day.
The cash Treasury and agency MBS markets share many characteristics. Like the Treasury cash market, the agency MBS market is large and liquid, and the forces of arbitrage link the two markets very closely. However, the two markets differ in important ways as well. In contrast to the Treasury market, high-frequency algorithmic trading by principal trading firms (PTFs) does not comprise a meaningful share of agency MBS average daily volume. In addition, the agency MBS market is still intermediated only by primary and other dealers. Together these similarities and differences create a useful counterfactual when studying Treasury market structure and the effects of electronification on liquidity and smooth function, which can be especially informative on days like October 15, 2014.
Volume of Trading Activity in the Agency MBS Market on October 15, 2014
On October 15, 2014, in a narrow window of time beginning at 9:33 a.m. ET, the yield-to-maturity of the benchmark 10-year Treasury security quickly dropped 16 basis points without a clear cause, only to rebound by 9:45 a.m., just 12 minutes later. Over the course of the entire business day, the 10-year benchmark traded in a 37 basis point range, but closed just 6 basis points below its opening level. The day was and remains one of historically high volatility. Moreover, as the JSR concluded, the event was not driven by a significant policy announcement or other news that could explain such a move, let alone a round trip of such magnitude.
October 15, 2014 was marked not just by high volatility, but also high trading volume, at least in the interdealer broker venue of the Treasury market. Using BrokerTec transaction data – similar to that used in the JSR – the top panel of Figure 1 below displays trading volume for the 10-year on-the-run Treasury security in 5-minute increments throughout the day of October 15, 2014, in addition to the median and 95th percentile levels of intraday volume in 5-minute increments.3 Trading volume exceeded its 95th percentile value by many multiples during the event window and BrokerTec volume for the 10-year benchmark security over the entire day remains the 2nd highest on record (at least since 2011), surpassed only on November 9, 2016, the day after the 2016 presidential election.4
The bottom panel of Figure 1 displays the same information for 30-year Fannie Mae To-be-announced (TBA) securities on October 15, 2014.5 The TBA volume data is further broken out by venue, and it is clear that most activity throughout the day occurred between dealers and their customers, rather than on IDB platforms, as is the case on most any business day in the agency MBS market. Like the Treasury market, activity in the agency MBS market was historically high on the day, though not to the same extent. $82 billion of 30-year Fannie Mae TBAs traded on the day, which is in the 97th percentile of similar days since TRACE MBS reporting began, but only the 47th highest on record.6
Looking more narrowly at the 12 minutes that comprise the event window, while activity in the Treasury market was extremely elevated between 9:33 and 9:45 a.m. on October 15th, the bottom panel of Figure 1 shows that 30-year Fannie Mae TBA trading volume was above the 75th percentile, but far below the 95th percentile. As we have just described, activity in 30-year Fannie Mae TBAs over the entire day exceeded the 95th percentile, so we are loathe to characterize the day's activity as less than historic. The discrepancy between these percentiles is likely explained by the prevalence of high-frequency activity on the BrokerTec platform.
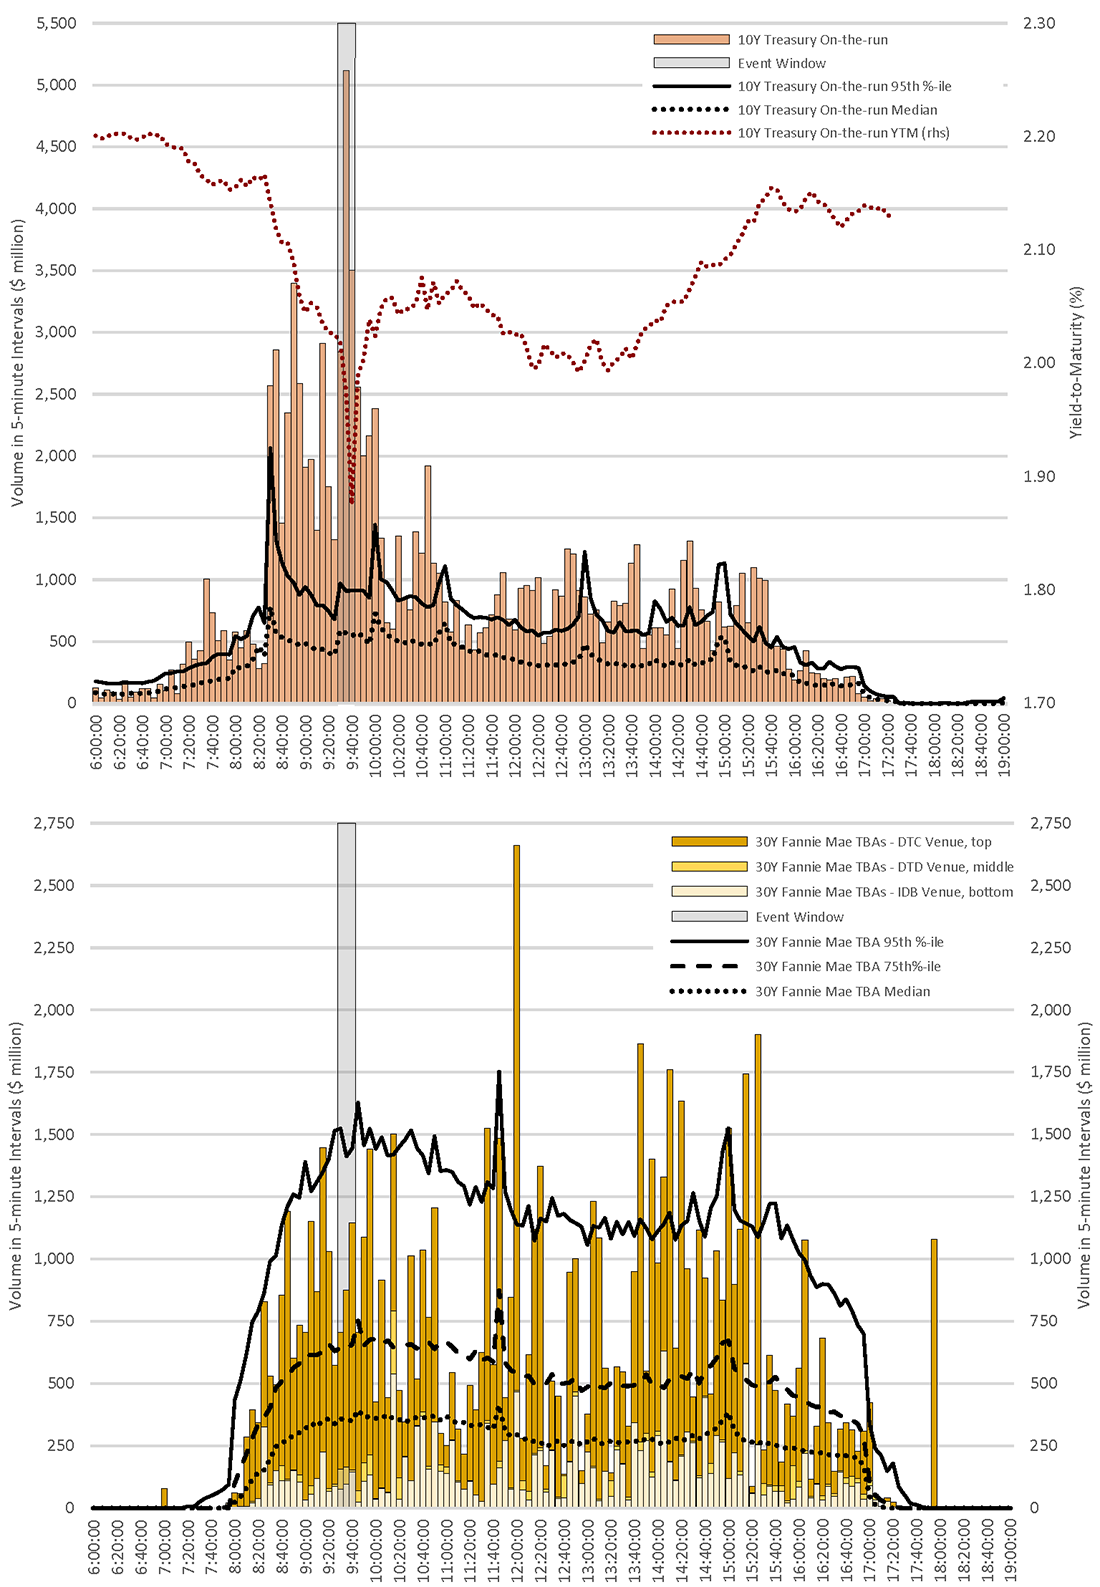
Note: In the top panel, trading volume on October 15, 2014 in 5-minute increments of the 10-year Treasury on-the-run security on the BrokerTec platform is shown, in addition to the median and 95th percentile of volume (over the period from September 30, 2011 to December 31, 2019). In the bottom panel, trading volume on October 15, 2014 in 5-minute increments of 30-year Fannie Mae TBA securities, as observed in TRACE data, including all coupons but not roll transactions, by venue is shown. (Double counting is eliminated from the TRACE volumes.) The bottom panel also shows the median, 75th and 95th percentiles of volume in 5-minute increments (over the period from September 30, 2011 to December 31, 2019, excluding all roll periods).
Source: Authors' calculations based on data from the Repo Interdealer Broker Community and Trade Reporting and Compliance Engine (TRACE) data from the Financial Industry Regulatory Authority (FINRA).
Looking more broadly at trading activity in the 30-year Fannie Mae TBAs throughout the day, Figure 1 also shows that a burst of historically high volume occurred at noon and between 1:45 and 3:30 p.m. Though activity in the Treasury market was also historically high at the time, it occurred on a far different scale than it did during the event window. It is not clear what may have caused this late-day activity in agency TBAs, but we might surmise that the events of the day caused market participants to change prepayment expectations, which precipitated hedging and rebalancing flows in those securities near the close.
Pricing and Returns in the Agency MBS Market on October 15, 2014
Owing to the tight coupling between the agency MBS and Treasury markets, and because agency TBAs often trade as a spread to Treasuries, on an average trading day it would be expected that, to first order, changes to prices/returns in the Treasury market would be quickly reflected in prices/returns in the agency MBS market. On October 15, 2014, particularly during the event window when the yield on the 10-year Treasury benchmark quickly dropped 16 basis points on seemingly no news, it is natural to ask whether the agency TBA market maintained its tight coupling to Treasuries during this time of stress.
In the following analysis, we consider price movements on October 15, 2014 in four agency TBA securities - 3.0%, 3.5%, 4.0% and 4.5% 30-year Fannie Mae for November delivery - and compare to movements in the 10-year on-the-run Treasury security. Together these four TBA securities comprise the liquid portion of the coupon stack for the most liquid class of security in the TBA market on October 15, 2014. Table 1 below summarizes their trading activity during the event window and on the day. Measured by volume, most trading occurred in the 4.0% coupon ($1.589 billion), by a large margin. When measured by trade count however, activity was more evenly distributed between the 3.5% and 4.0% coupons ($20 million each). There were 63 trades during the event window, 39 of which occurred in the IDB venue (in small average size). The vast majority of volume occurred in the DTC venue ($1.943 billion). The largest trade conducted during the event window was for $500 million, while the median trade size was just $5 million.7
Table 1: 30-year Fannie Mae Activity during the Event Window and on the Day (October 15, 2014)
| Volume ($ million) | Trade Count | |||||||||
|---|---|---|---|---|---|---|---|---|---|---|
| Venue/Coupon | 3.00% | 3.50% | 4.00% | 4.50% | Total | 3.00% | 3.50% | 4.00% | 4.50% | Total |
| DTC | 115 | 129 | 1,524 | 175 | 1,943 | 3 | 6 | 8 | 4 | 21 |
| DTD | 0 | 37 | 20 | 80 | 137 | 0 | 1 | 1 | 1 | 3 |
| IDB | 39 | 65 | 45 | 134 | 283 | 9 | 13 | 11 | 6 | 39 |
| Total (Event Window) | 154 | 231 | 1,589 | 389 | 2,363 | 12 | 20 | 20 | 11 | 63 |
| Total (8am-4pm) | 10,078 | 19,759 | 22,954 | 5,664 | 58,453 | 628 | 1,022 | 864 | 274 | 2,788 |
Note: The table above displays total volume of trading activity and trade count for 30-year Fannie Mae TBAs for November delivery with coupons ranging from 3.0% to 4.5% on October 15, 2014 between 9:33 and 9:45 a.m. In the very bottom rows, totals for the entire day (8 a.m. to 4 p.m.) are shown. The volumes and trade counts are broken out by venue (dealer-to-customer, dealer-to-dealer and interdealer broker) and by coupon (3.0%, 3.5%, 4.0% and 4.5%).
Source: Authors' calculations based on data from the Trade Reporting and Compliance Engine (TRACE) data from the Financial Industry Regulatory Authority (FINRA).
Figure 2 below scatter plots intraday returns for the four agency TBA securities from their 8:00 a.m. levels on October 15, 2014, as observed in the TRACE data, against the intraday returns on the 10-year Treasury on-the-run security from its level at 8:00 a.m., as observed on BrokerTec. For the agency TBAs, the returns are calculated from transaction prices, while for the Treasury 10-year the mid-point of the best bid and offer displayed on BrokerTec at the time of the TBA trade is used as a proxy for price. The points are color-coded by TBA coupon and points occurring during the event window (9:33 a.m. to 9:45 a.m.) are circled in black.
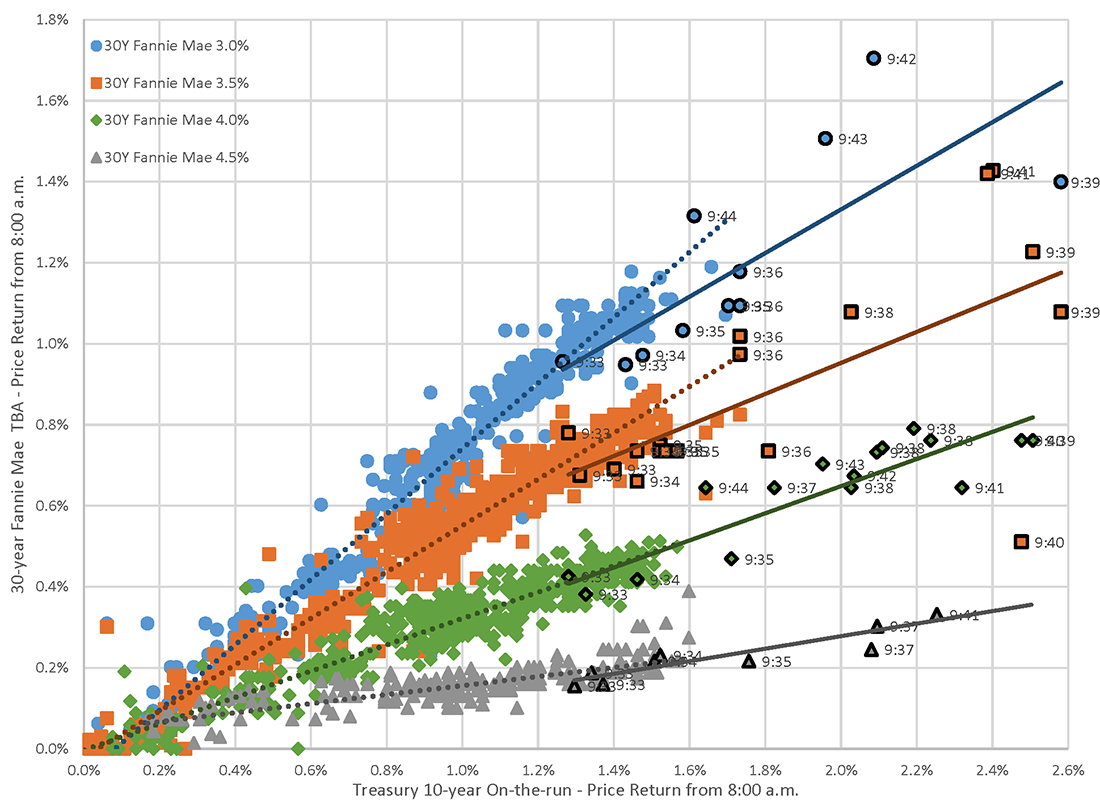
Note: The plot above scatters intraday price returns on October 15, 2014 for 3.0%, 3.5%, 4.0% and 4.5% Fannie Mae TBAs for November delivery (y-axis) against intraday price returns for the 10-year Treasury on-the-run security (x-axis). Intraday returns for the TBA securities are calculated as log transaction price differences from their 8:00 a.m. levels on October 15, 2014. Intraday returns for the Treasury security are calculated using the mid-point of the best bid and offer on BrokerTec at the time of the corresponding TBA transaction. Points are color-coded by TBA coupon and points occurring in the event window between 9:33 and 9:45 a.m. are circled in black and labeled with their time of occurrence. See Table 2 for details of the linear regressions that are shown.
Source: Authors' calculations based on data from the Repo Interdealer Broker Community and Trade Reporting and Compliance Engine (TRACE) data from the Financial Industry Regulatory Authority (FINRA).
For the points occurring outside of the event window (generally to the left of 1.4% on the x-axis), the four scatters tightly fit four linear regressions (displayed as dotted lines). The slopes of the regression lines fall with coupon size, reflecting the distinct Treasury hedge ratios and prepayment expectations for the four securities. During the event window (generally to the right of 1.4% on the x-axis), the scatters fit regression lines relatively tightly for the 4.0% and 4.5% coupons but not for the 3.0% and 3.5% coupons. The 3.5% coupon (orange) appears to exhibit at least one large outlier, labeled at 9:40.
Table 2 displays the coefficients for the regression lines shown in Figure 2 above. For the data falling outside of the event window (i.e. left panel in Table 2), the slope coefficients8 are all significant at the 0.1% level, the intercept coefficients are not meaningfully different than zero and the adjusted-R2 are generally high. The TBA current coupon (i.e. the coupon rate that interpolates to a price of par) prevailing at 8:00 a.m. on October 15, 2014 was about 2.77%. This would place the 3.0% and 3.5% coupons much closer to the current coupon than the 4.0% and 4.5% coupons. In Table 2, the 4.5% security displays a very low sensitivity to Treasury yields (0.112) outside the event window. In contrast, the 3.0% security has a very high sensitivity (0.808) to Treasuries outside of the event window. In general, judging from Figure 2 and Table 2, outside of the event window, activity in the TBA market appeared to be orderly and the market was able to price prepayment expectations consistently over a wide range of Treasury yields.
Table 2: Regression Table for Intraday TBA and Treasury Returns on October 15, 2014 in Figure 2
| Ex-Event Window | Event Window Only | |||||||
|---|---|---|---|---|---|---|---|---|
| Coupon | 3.00% | 3.50% | 4.00% | 4.50% | 3.00% | 3.50% | 4.00% | 4.50% |
| Slope | 0.808*** | 0.572*** | 0.325*** | 0.112*** | 0.538** | 0.383** | 0.335*** | 0.155*** |
| (0.007) | (0.004) | (0.004) | (0.005) | (0.142) | (0.104) | (0.035) | (0.020) | |
| Intercept | -0.001*** | -0.000*** | 0.000 | 0.000*** | 0.003 | 0.003 | 0.000 | 0.000 |
| (0.00007) | (0.00004) | (0.00004) | (0.00006) | (0.00248) | (0.00192) | (0.00068) | (0.00035) | |
| Adjusted-R2 | 0.96 | 0.94 | 0.89 | 0.63 | 0.55 | 0.40 | 0.83 | 0.85 |
| n | 615 | 1001 | 843 | 262 | 12 | 20 | 20 | 11 |
Note: The table above reports coefficients for the linear regressions plotted in Figure 2. In the left panel, slope and intercept coefficients for regressions conducted on data outside the event window (i.e. to the left of 1.4% on the x-axis in Figure 2) are shown. In the right panel, coefficients for regressions conducted data during the event window (i.e. to the right of 1.4% on the x-axis in Figure 2) are shown. Significance of each coefficient is denoted by stars (***0.001, **0.01 and *0.05 level) and standard errors are reported in parenthesis. Adjusted-R2 and the number of observations (n) are shown as well.
Source: Authors' calculations based on data from the Repo Interdealer Broker Community and Trade Reporting and Compliance Engine (TRACE) data from the Financial Industry Regulatory Authority (FINRA).
During the event window, pricing for the 4.0% and 4.5% coupons remained orderly. Judging from Figure 2, the scatters of TBA and Treasury intraday returns between 9:33 and 9:45 a.m. project onto lines very similar to those prevailing outside the window. Judging from Table 2, the slope coefficients are little changed and the intercepts are not meaningfully different from zero. Furthermore, the adjusted-R2 for the 4.0% and 4.5% securities remain relatively high and exceed 80%.
In contrast to the 4.0% and 4.5% securities, pricing for the 3.0% and 3.5% coupons during the event window changed considerably. As seen in Figure 2, the regression slopes are noticeably lower, which indicates that market participants adjusted prepayment expectations higher for these two securities as Treasury yields fell. In addition, the adjusted-R2 of the regressions are much lower than their counterparts in the left panel of the table, as highlighted in orange. Granted, the sample of data available in the event window is very small, but together this suggests that, during the event window when Treasury yields quickly dropped 16 basis points, activity in the 3.0% and 3.5% coupons became disorderly and the market struggled to price consensus prepayment expectations.9,10
Agency MBS Volatility following the Events of October 15, 2014
We also briefly consider agency MBS volatility leading up to and following October 15, 2014. Figure 3 below shows realized intraday volatility11 for the 10-year Treasury on-the-run security, as observed through BrokerTec activity, and the 30-year Fannie Mae production coupon12 as observed in the TRACE data from September 15, 2014 to November 15, 2014. It is evident in the plot that volatility rose during the day of the event and persisted for at least the day that followed, for both TBAs and Treasuries.13
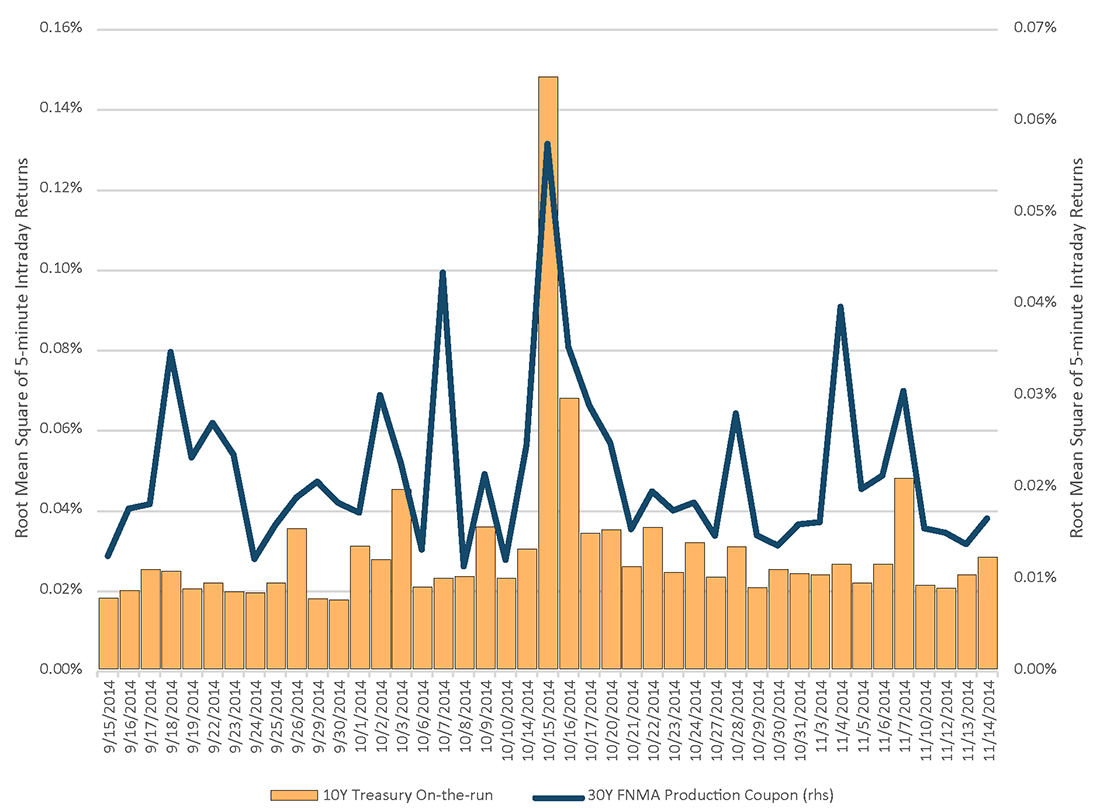
Note: The figure above displays realized daily volatility for the 10-year Treasury on-the-run security and the 30-year Fannie Mae production coupon TBA from September 15, 2014 to November 15, 2014. Realized daily volatility was calculated as the root mean square of 5-minute intraday returns for each trading day over the sample. The TBA production coupon is defined as that trading on a daily basis with the highest volume, subject to some ad-hoc smoothing. Changes day-to-day in the 10-year on-the-run CUSIP and 30-year Fannie Mae production coupon TBA throughout the course of the sample are controlled.
Source: Authors' calculations based on data from the Repo Interdealer Broker Community and Trade Reporting and Compliance Engine (TRACE) data from the Financial Industry Regulatory Authority (FINRA).
Conclusion
To summarize, this note looked back at events in the agency MBS market on October 15, 2014 and compared to contemporaneous events in the Treasury market, at least as they could be observed on the BrokerTec platform. Like the Treasury market, volume in the agency MBS market was very high on the day as a whole, though not to the same extent. But while the intensity of Treasury activity peaked between 9:33 and 9:45 a.m., activity in the agency MBS market peaked later in the day and towards the market close, for reasons that are not readily apparent, even in hindsight. The market displayed the ability to consistently price prepayments across a very large range (37 basis points) of Treasury yields throughout the day, but during the event window, when Treasury yields quickly dropped 16 basis points and rebounded in just 12 minutes, trading in some securities and in particular the 30-year Fannie Mae production coupon TBA became disorderly, as the market struggled to arrive at consensus prepayment expectations. Finally, as would be expected, volatility of both Treasury and TBA securities remained elevated for a day following the event.
The JSR demonstrated the ways in which both the Treasury cash and futures markets have evolved since the financial crisis of 2008, and detailed some of the effects that increased electronification and PTF participation have had on liquidity and smooth function. A previous FEDS Note explored the ways in which the structure of the Treasury market differs from that of the agency MBS market. It highlighted the fact that PTFs do not participate in the agency MBS market, and that intermediation in the agency MBS market is highly concentrated among the largest dealers. This note has presented evidence that changes in Treasury market structure and liquidity conditions flow downstream into so-called spread products, such as agency MBS securities. Together this raises a number of questions regarding the ways in which the presence (or absence) of PTF activity affects dealer market making behavior in fixed income markets, which is a topic left for further analysis.
1. We are grateful to Landis Atkinson, Rich Podjasek, Peter Johansson, and Emma Weiss of the Federal Reserve Bank of New York for helpful discussion that made this note possible. Return to text
2. See: Unlocking the Treasury Market through TRACE, Breaking Down TRACE Volumes Further, Principal Trading Firm Activity in Treasury Cash Markets, Fixed Income Market Structure: Treasuries vs. Agency MBS. The official site of the inaugural (2015) conference on the Evolving Structure of the U.S. Treasury Market, held at the Federal Reserve Bank of New York, also hosts analysis of Treasury dealer-to-customer (PDF) and OTC swap (PDF)activity on October 15th 2014. A speech delivered by Governor Brainard at the 2018 conference also includes useful background material. Return to text
3. The sample of BrokerTec data used throughout this analysis encompasses the 8 years between September 30, 2011 and December 31, 2019. Return to text
4. As mentioned in the preface, the sample used here ends in 2019 and the events of 2020 are not analyzed. Return to text
5. The regulatory version of FINRA's TRACE Agency MBS data is used for all of the MBS/TBA analysis in this post. Our sample of covers the 8 years between September 30, 2011 and December 31, 2019. Return to text
6. We exclude all 30-year Fannie Mae TBA roll periods (i.e. the three days prior to any Class-A notification date) in this calculation, since October 15, 2014 did not occur during a roll period. (TBA average daily volume during roll periods is typically much higher than during non-roll periods.) Average daily trading volume of 30-year Fannie Mae TBAs during this sample of days is $46 billion with a standard deviation of $16 billion. As mentioned in the preface, the events of 2020 are not analyzed. Return to text
7. Only institutional-size trades greater than or equal to $1 million were considered in this calculation. Double counting was also eliminated from the TRACE volumes prior to the calculation. No attempt was made to filter or eliminate price outliers. Return to text
8. The slope coefficients reflect 1) the Treasury hedge ratios of each security in the coupon stack, 2) the negative convexity embedded in MBS securities through the mortgage prepayment option and 3) the option-adjusted spreads priced into each security. Return to text
9. It is possible that errors or delays in recording the timestamps for the TBA trades are responsible for these results. We have no means of testing this, but note that the timestamps for the higher coupon securities appear to have been correctly recorded, as evidenced in the regression results and the plots in Figure 2. We'll also note that the most egregious TBA mispricing appears to have occurred in the narrow window between 9:40 and 9:44 a.m. We will also note that it is possible some of the TBA transactions occurred as spreads against specified pool securities, which would render the absolute price of the TBA leg of the trade irrelevant in the present context. Return to text
10. In order to further test the hypothesis that orderly pricing broke down during the event window for the 3.0% and 3.5% coupons but not the 4.0% and 4.5%, regressions for each TBA security against Treasuries over the entire sample of data with slope and intercept dummies for the event window were conducted. The slope and intercept dummies were significant for the 3.0% and 3.5% coupons, but not for the 4.0% and 4.5% coupons, which is consistent with the results displayed in Table 2 and the hypothesis that pricing for the 3.0% and 3.5% coupons changed during the event window. Return to text
11. More specifically, we calculate realized returns in 5-minute increments throughout the data and estimate realized volatility for each day as the root mean square of 5-minute intraday returns. Return to text
12. We define the production coupon as the front-month TBA coupon trading on a daily basis with the highest volume, subject to some ad-hoc smoothing when two adjacent coupons trade in nearly equal volumes. Return to text
13. In order to test the robustness of these results, the same analysis was conducted using GARCH(1,1) conditional volatility. The conclusions made here still hold. Return to text
Harkrader, James Collin, and Michael Puglia (2020). "Retrospective: The Agency MBS Market on October 15, 2014," FEDS Notes. Washington: Board of Governors of the Federal Reserve System, September 24, 2020, https://doi.org/10.17016/2380-7172.2623.
Disclaimer: FEDS Notes are articles in which Board staff offer their own views and present analysis on a range of topics in economics and finance. These articles are shorter and less technically oriented than FEDS Working Papers and IFDP papers.