FEDS Notes
September 01, 2023
Size and Survival of Entrants to Retail Banking
David Benson, Vitaly Bord, Aaron Garner, Charles Taragin
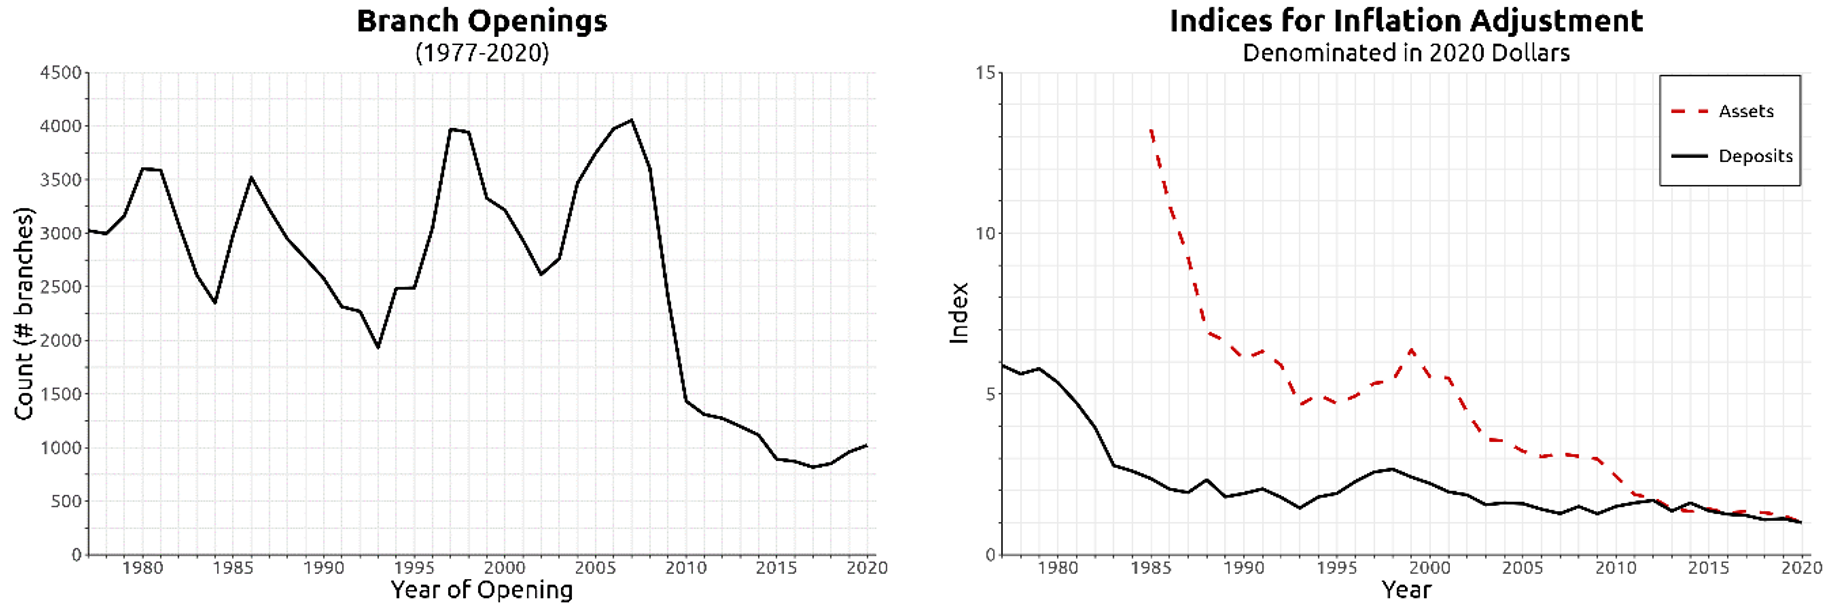
The establishment of new banks and branches is especially important in the banking sector. Many consumers still use physical bank branches to access banking services (Annenberg et al, 2018; Jiang, Yu, and Zhang, 2023). Entrants can therefore affect the behavior of incumbents, assert competitive discipline (e.g. Bresnahan and Reiss, 1991), and accelerate technological change (e.g. Aaronson et. al. 2017). However, new bank entry has collapsed since the Global Financial Crisis (Appendix Figure 1), raising questions about the effects of consolidation, regulatory burdens, and non-bank financial institutions on industry dynamism (Bowman, 2023; Adams and Gramlich, 2013). Branch exit has accelerated, and the establishment of new bank branches has slowed to about 1,000 new branches each year (Appendix Figure 2).
This note examines descriptive statistics on the size and survival for the universe of retail banking entrants from 1976 to 2020. We exploit a dataset with a novel time-consistent identifier that allows us to track every bank branch location in the U.S. across time until its closure. The dataset covers more than 180,000 unique branches controlled by 26,000 banking institutions. Over the 44 years of data, more than 113,000 new branches were established, and the banking industry evolved from 65,000 branches in operation and almost $8 trillion in deposits (denominated in 2020 dollars) to 86,000 branches in operation and $18 trillion in deposits.
We present four stylized facts. (1) New bank branches are slow to mature. (2) Even as new branches grow, failure rates are high. (3) De novo bank branches grow faster than new branches of established banks. Nonetheless, (4) new branches of large banks grow faster than those of small banks.
New branches are slow to mature
Figure 1 depicts deposit growth for all new retail branches, both from established and de novo banks. The left panel depicts the median (dashed line) as well as the interquartile range (shaded region) of deposit volume, denominated in 2020 dollars, up to 15 years after the establishment of the branch. Fifteen years after opening, new branches typically hold between $25 million and $90 million in deposits, with the median branch holding $50 million. The median branch achieves 50 percent of this growth within three years of opening.
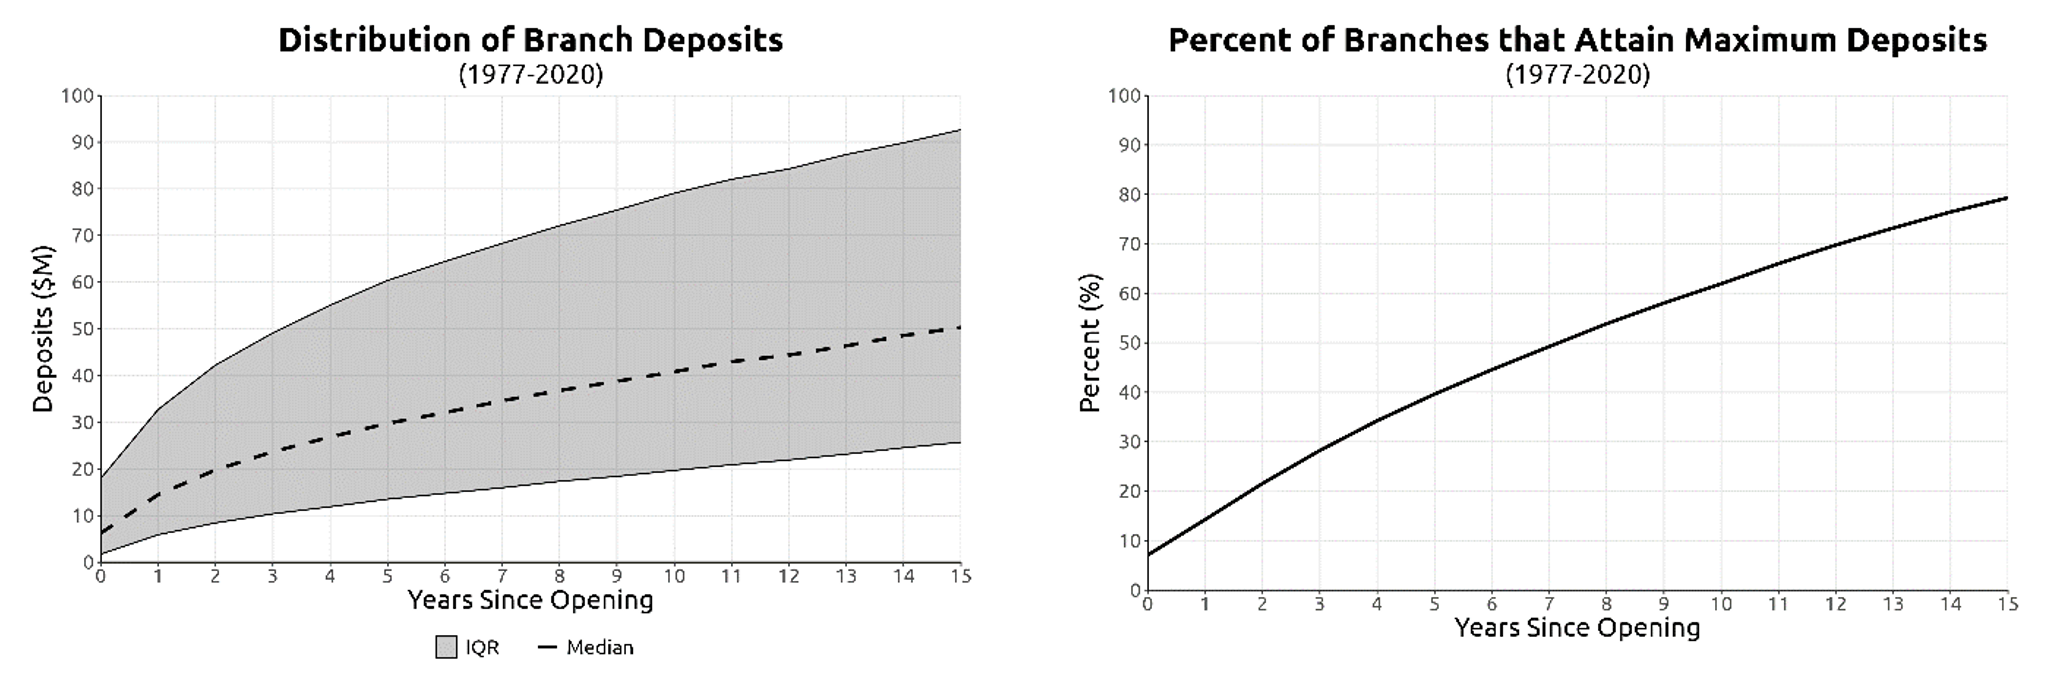
The right panel of Figure 1 depicts how long it takes new branches to reach mature scale, as measured by the fraction of branches that have achieved their observed maximum deposit level by year since opening. After three years, 30 percent of branches have reached their maximum deposit level. Growth then decelerates. 10 years after opening, 60 percent of branches have attained their maximum deposits, and after 15 years only 80 percent have achieved this milestone.
Branch failure rates are high
The left panel of Figure 2 plots the closure rate of new branches (solid black line), and the cumulative fraction of new branches that closed (dashed red line) against the number of years since opening. Closure rates are high and increase with establishment age. Approximately 5 percent of new branches that survived the first year closed in the following year, and 10 percent of new branches who survived 10 years closed in their 11th year. Cumulatively, almost 30 percent of branches close within 10 years of opening.
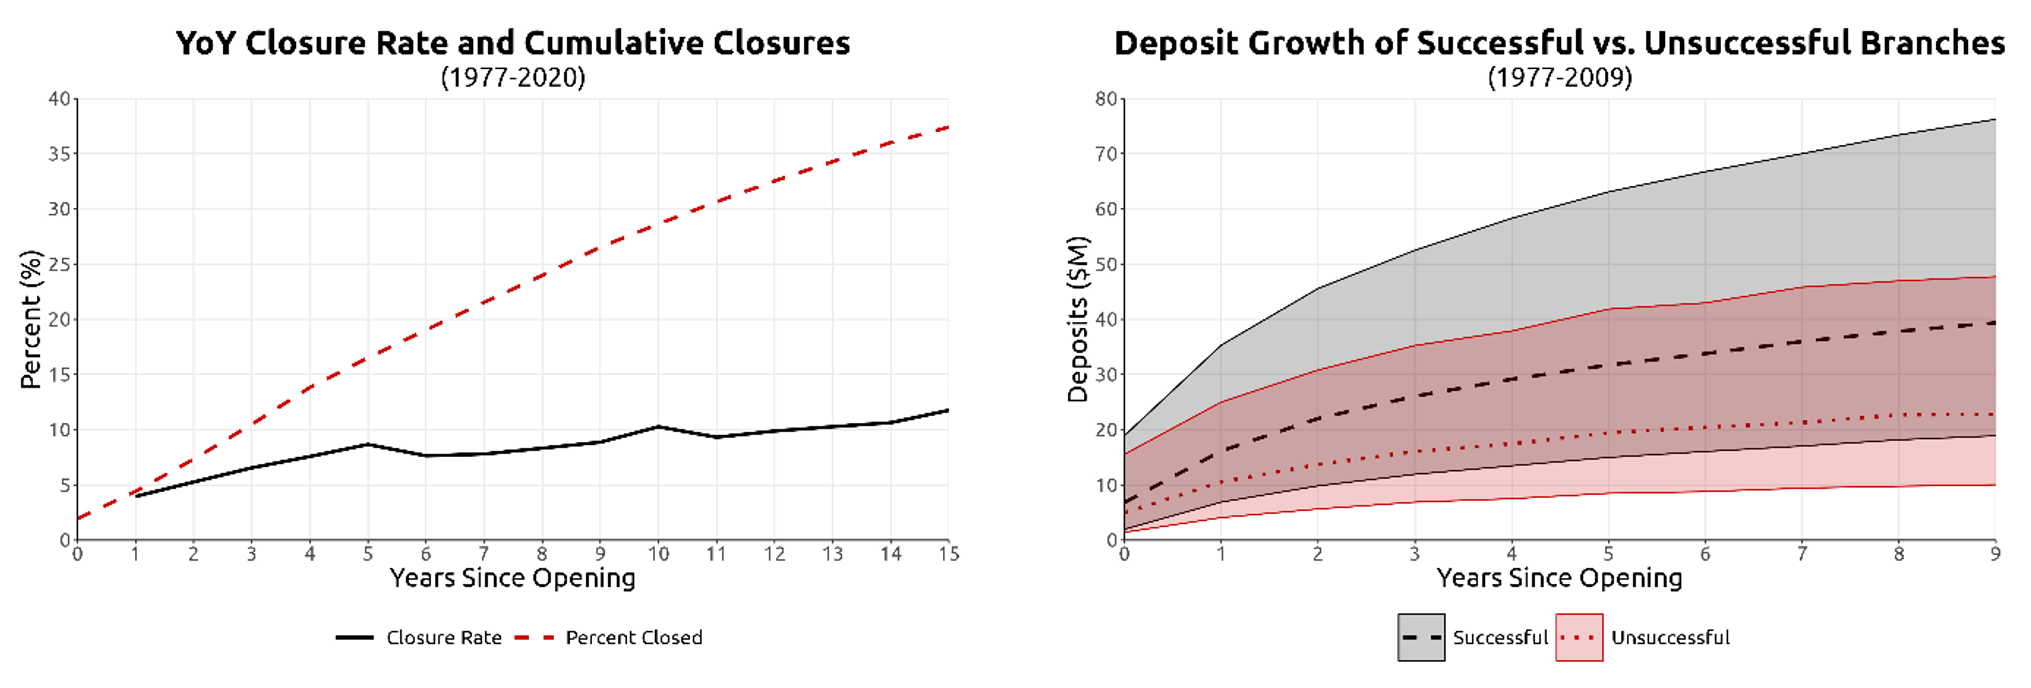
The right panel of Figure 2 contrasts two subpopulations: "successful" branches that survived at least 10 years of operation, and "unsuccessful" branches that closed within 10 years of opening. The growth of unsuccessful branches diverges from the growth of successful branches in the first year. Within 10 years since opening, the median unsuccessful branch never achieves $25 million in deposits, while the median successful branch achieves this scale within 3 years and grows to over $40 million in 10 years.
De novo branches grow faster than new branches of established banks
De novo entry refers to a branch opened by a new bank, in contrast to entry in the form of branch expansion by an established bank. We explore two measures of de novo status: one based on branches of newly established banks and one based on banks expanding into a new local market.
Figure 3 defines de novo as a new branch opened by a newly chartered bank and shows deposit growth for de novo branches compared to expansion branches. By this measure, de novo entrant growth clearly outpaces expansion branch growth. The left panel indicates that the median de novo branch reaches $50 million in deposits within two years of entry, and its growth slows significantly within three to four years. New branches of established banks exhibit more moderate growth in comparison.
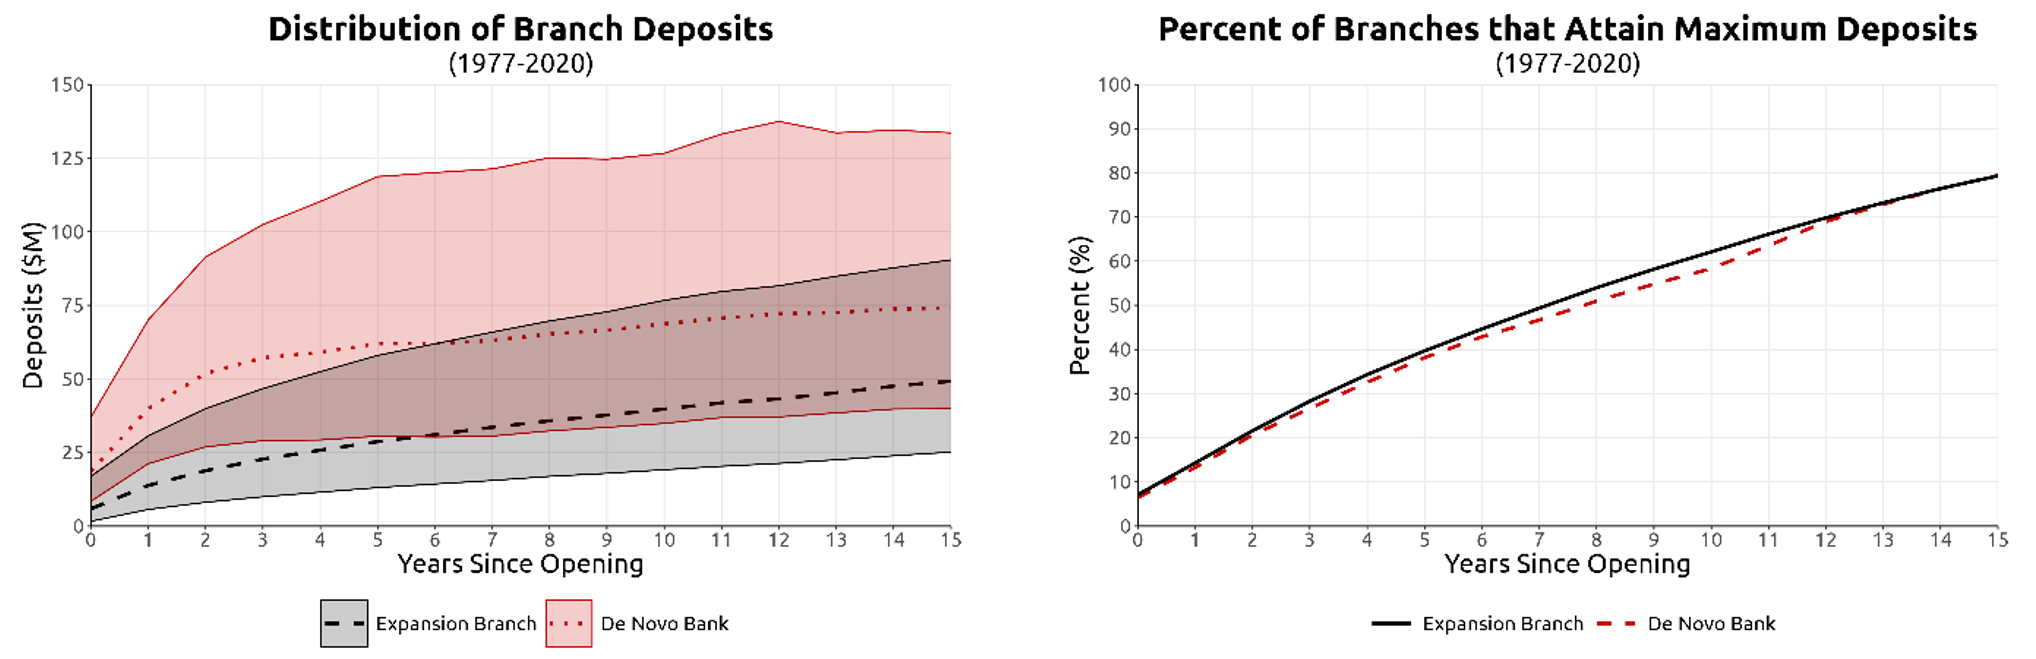
Mirroring Figure 1, the right panel of Figure 3 illustrates how long it takes de novo and expansion branches to reach mature scale. De novo bank and expansion branches achieved their observed maximum total deposits at relatively similar rates. Together with the left panel of the figure, these data suggests that de novo bank branches not only grow more quickly than expansion branches, but also continue to grow to a larger mature scale.
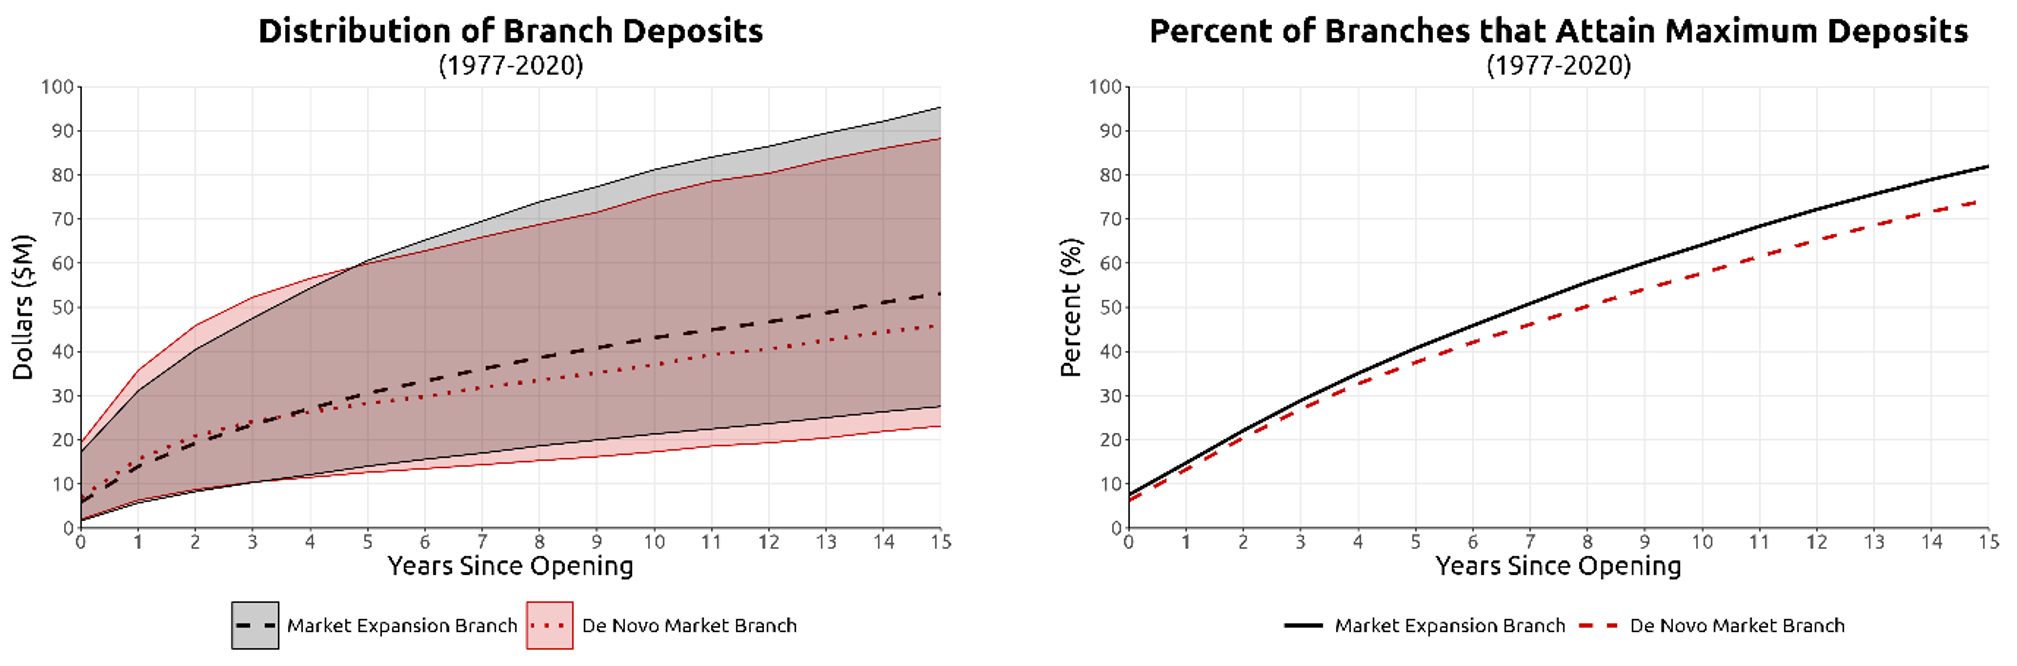
Figure 4 examines a broader definition of de novo status based on local markets, defined as entry by any bank that did not operate in a given county. This definition includes branches of de novo banks, in addition to branches opened by established banks in new markets. Consequently, expansion branches are now more narrowly defined to include only branches opened by banks that already have an existing branch in a county. Under this broader definition of de novo, de novo and expansion branch deposit growth rates are far more similar, particularly for the first 3 years following entry. After 3 years, the typical market expansion branch outpaces the typical de novo market branch, with the new branch of the established bank achieving slightly larger mature scale at greater frequency.
New branches of large banks grow faster than those of small banks
We repeat the exercise from Figure 1 by splitting new branches based on bank asset size, again denominated in 2020 dollars.1 We define "small banks" as institutions that had less than $10 billion in total assets in the year the branch was opened, illustrated by the dotted red line and shaded region of Figure 5. We define "large banks" as those that had more than $100 billion assets the year the branch was opened, illustrated by the dashed black line and shaded region. Note that de novo banks are included with "small bank" new branches, since all de novo banks start under this asset threshold.
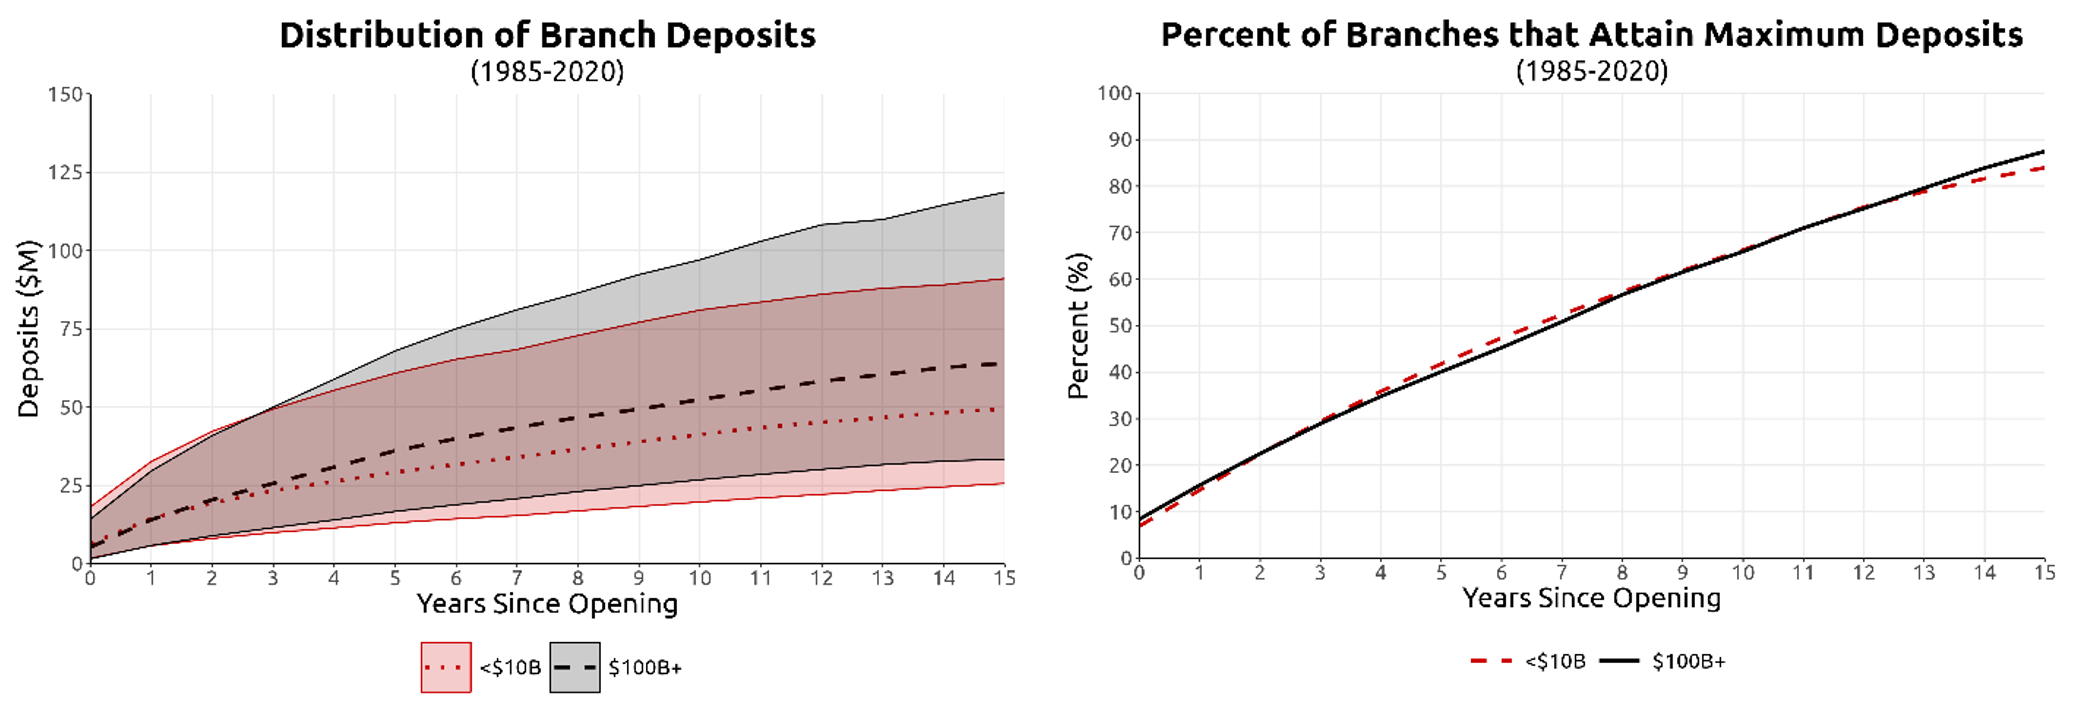
In the left panel of Figure 5, new branches controlled by large and small banks have similar growth in the first three years of operation. Growth paths diverge thereafter, impacting each entrant's mature scale. In the right panel of Figure 5, new branches run by large banks achieve maximum scale at similar rates as new branches run by small banks. But at 9 years after opening, the median branch controlled by a large bank has $50 million in deposits while the median branch controlled by a small bank has less than $40 million.
Discussion
The success of a new bank branch is not guaranteed. Entrants take significant time to grow, and failure rates are high. De novo bank branches appear to grow faster and to larger scale than new branches of established banks. But once de novos are included in a broader set of small banks, new branches of larger banks typically grow faster by comparison.
These stylized facts are consistent with several mechanisms that may be at work in the banking sector, including selection. For example, growth paths comprise, in part, selection of entrants that succeed versus entrants that ultimately exit. Once a new branch ceases operation, it drops out of the population of branches forever, meaning that later years in the data only include the subpopulation that successfully operated up to that point. Therefore, the distributions of growth and scale-maturity reflect both changes within branches over time as well as a compositional shift toward surviving branches.
Figures 3-5 suggest a related selection mechanism at work. Of all potential new banks or new branches, those that choose to enter may be lower cost or deliver higher value to consumers than those that choose not to enter. Such selection might explain why being the first branch of a new bank appears to be stronger determinant of growth than being the first branch a bank opens in a new market. Selection might also explain why branches opened by bigger banks grow faster and larger than branches opened by smaller banks.
Determinants of these selection mechanisms may be interesting avenues for further research. These stylized facts are consistent with entry barriers working to select lower cost or higher value entrants, as well as with competition selecting lower cost or higher value survivors. Since failure rates are high (Figure 2), the determinants of attrition may be particularly interesting. However, as such interpretations require a causal analysis beyond the scope of this note, we leave these questions for future work.
References
Aaronson, Daniel and French, Eric and Sorkin, Isaac (2016). "Industry Dynamics and the Minimum Wage: A Putty-Clay Approach." International Economic Review, 59: 51-84. https://doi.org/10.1111/iere.12262
Adams, R.M., Gramlich, J. (2016). "Where Are All the New Banks? The Role of Regulatory Burden in New Bank Formation." Review of Industrial Organization, https://doi.org/10.1007/s11151-015-9499-3.
Anenberg, Elliot, Andrew C. Chang, Serafin Grundl, Kevin B. Moore, and Richard Windle (2018). "The Branch Puzzle: Why Are there Still Bank Branches?" FEDS Notes. Washington: Board of Governors of the Federal Reserve System, August 20, 2018, https://doi.org/10.17016/2380-7172.2206.
Board of Governors of the Federal Reserve System. Call Report Data.
Bord, Vitaly (2018). "Bank Consolidation and Financial Inclusion: The Adverse Effects of Bank Mergers on Depositors," vbord_-_bank_consolidation_and_financial_inclusion_full.pdf (harvard.edu) (PDF).
Bowman, Michelle (2023). "The Consequences of Fewer Banks in the U.S. Banking System," speech delivered at the Wharton Financial Regulation Conference, Philadelphia, Pennsylvania, April 14.
Jiang, Erica Xuewei and Yu, Gloria Yang and Zhang, Jinyuan (2022). "Bank Competition amid Digital Disruption: Implications for Financial Inclusion." USC Marshall School of Business, http://dx.doi.org/10.2139/ssrn.4178420
Appendix
We use a yearly panel dataset of the universe of bank branches in the United States from 1975 to 2020, covering more than 180,000 branches operated by 26,000 banking institutions.2 Importantly, the dataset tracks each physical branch over time through any changes in ownership. In this way, we identify new entry that corresponds to a bank opening a new establishment, rather than acquiring an existing branch.
The banking industry is an ideal context to study new entry because it has grown considerably since the 1970s. In 1977, the 65,000 branches in our dataset contained almost $8 trillion of aggregate deposits, in 2020 dollars. By 2020, the 86,000 branches in our dataset contained almost $18 trillion of deposits. During our sample period, there are about 113,000 new branch openings. On average, three percent of branches each year are new establishments, and they correspond to about 1.2 percent of deposits at opening.
We leverage the Summary of Deposits from 1976-2020 to study the deposit growth of new entrants in retail banking. Over this horizon, we observe a branch "opening" and "closing" by the first and last reporting year. The left panel of the Appendix Figure 2 displays the number of new branches opened 1977-2019, and from this figure, we find steep peaks and troughs in the number of new branch openings before the Global Financial Crisis. Prior to 2007, approximately 2,000-4,000 new branches opened each year; however, after 2010, approximately 750-1,250 new branches opened each year.
In order to compare the size of new entrants across time, we adjust branch deposits and bank assets by the annual index for inflation illustrated in the right panel of the Appendix. We calculate these indices as the ratio of the median deposits and assets of new entrants one year after opening such that $$ Index_t = \frac{Median_{2020}}{Median_t} $$. Note that all dollar and share calculations included in this note rely on adjusted deposits, and the asset buckets in Figure 5 accounts for adjusted bank assets.
1. We limit the entrant cohorts included in Figure 5 to 1985-2020 as high-quality bank asset data from the Call Report starts in 1985. Return to text
2. We begin with information from the FDIC's Summary of Deposits and supplement it with branch-level information from the Federal Reserve, the St Louis Fed's CASSIDI dataset, and the S&P Market Intelligence. Using information from these different sources, as well as detailed geographic information on branch location, we create a consistent branch-level identifier that tracks each physical branch over time, through any changes in ownership, relocations, and closures. A previous but similar version of these data were used by Bord (2021). Return to text
David Benson, Vitaly Bord, Aaron Garner, Charles Taragin (2023). "Size and Survival of Entrants to Retail Banking," FEDS Notes. Washington: Board of Governors of the Federal Reserve System, August 31, 2023, https://doi.org/10.17016/2380-7172.3345.
Disclaimer: FEDS Notes are articles in which Board staff offer their own views and present analysis on a range of topics in economics and finance. These articles are shorter and less technically oriented than FEDS Working Papers and IFDP papers.