FEDS Notes
October 07, 2020
The Impact of COVID-19 on Emerging Market Economies' Financial Conditions
Shaghil Ahmed, Jasper Hoek, Steve Kamin, Ben Smith and Emre Yoldas*
The emerging market economies (EMEs) – and the lower-income developing economies to an even greater extent – generally are extremely vulnerable to the COVID-19 pandemic. Many EMEs have weak public health systems, poor and financially vulnerable populations, inadequate social safety nets, limited monetary and especially fiscal policy space, and high exposure to global trade and commodity prices. In addition, vulnerable EMEs suffer from a precarious access to international capital markets. During times of strong global growth and low investor risk aversion, international borrowing is cheap and abundant, but during global crises and investor flight to quality, that borrowing dries up.
Such a credit crunch for EMEs – often referred to as a "sudden stop" of capital flows – combined with the myriad burdens already weighing on many of these economies as a result of the pandemic, could gravely complicate the quest for economic recovery and normalization. A sudden stop could be triggered by global factors, such as a spike in investor risk aversion around the world, but it might also occur as a response to adverse pandemic developments in the EMEs themselves. In this note, we present evidence that, indeed, the access of EMEs to international capital markets, as evidenced by a range of key financial indicators, is influenced not only by the tone of global financial markets and by the fundamental strengths of their economies, but also by the extent of the spread of the novel coronavirus itself and, in particular, the restrictive measures that spread has prompted. That investors would pull back from countries struggling with the pandemic should hardly be surprising, and yet in commentary on emerging market finances, this consideration has largely been overshadowed by the effects of global financial developments.1 To our knowledge, this is one of the first research projects to systematically address the relationship between pandemic outcomes and financial developments in a wide range of EMEs and asset market segments.2
To address this issue, we estimated panel regressions in which financial indicators in 22 emerging market economies—exchange rates, credit spreads, and equity prices— were related to three sets of indicators: (1) measures of the tone of global financial markets, as captured by the VIX and U.S. high-yield corporate spreads; (2) country-specific measures of EMEs' fundamental macroeconomic vulnerabilities; and (3) country-specific measures of the spread of COVID-19 and the corresponding measures taken by authorities in the EMEs.3 We review developments in these explanatory variables briefly before describing their estimated effects on EME financial markets.
Starting with the first set of indicators, it is well documented that developments in U.S. monetary policy and financial markets exert a strong influence on EME financial conditions, and that has remained true during the pandemic.4 Figure 1 below compares developments in U.S. markets to those in an average of EMEs during this period. As may be seen, mounting worries about the pandemic triggered a spike in the VIX, a surge in U.S. corporate high-yield spreads, and a collapse in equity prices. As has been the case in previous surges of volatility, notably the global financial crisis of 2008, this was met in the EMEs with a sharp depreciation of currencies, a widening of credit spreads on dollar-denominated debt, and a comparable plunge in equities. Beginning from around mid-March, however, the tone of U.S. (and other advanced-economy) financial markets stabilized and rebounded in response to a plethora of monetary easing actions by the Federal Reserve and other central banks, widespread announcements of fiscal stimulus measures, and indications that the spread of the pandemic was easing in some countries. This reversal led to a corresponding, albeit still incomplete, improvement in the tone of EME financial markets.
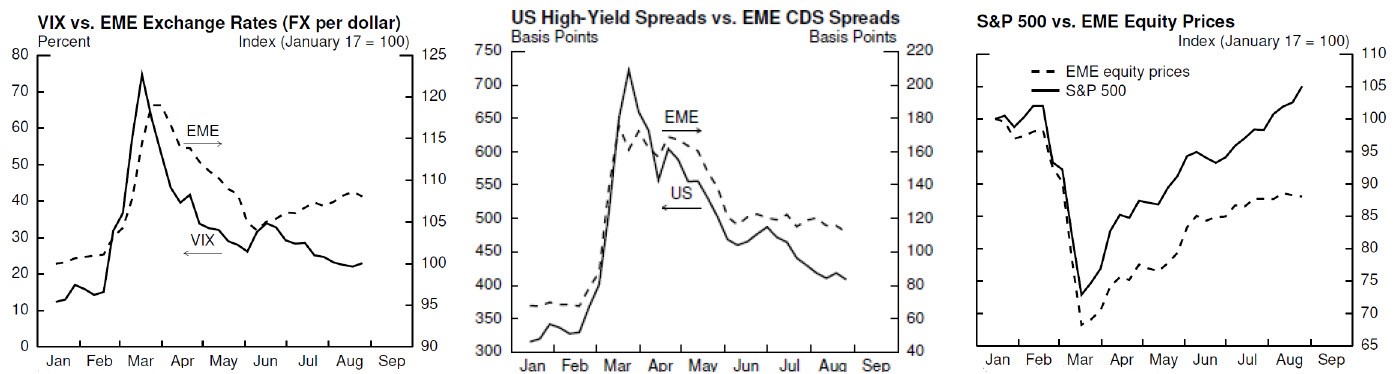
VIX vs. EME Exchange Rates (FX per dollar)
Note: Lines come from weekly averages of daily data and equally-weighted averages across 22 EMEs.
Source: Bloomberg Finance LP.
US High-Yield Spreads vs. EME CDS Spreads
Note: Lines come from weekly averages of daily data and equally-weighted averages across 20 EMEs.
Source: Federal Reserve Board staff calculation based on ICE Data Pricing & Reference Data, LLC; Federal Reserve Bank of New York; Markit North America, Inc.
S&P 500 vs. EME Equity Prices
Note: Lines come from weekly averages of daily data and equally-weighted averages across 21 EMEs.
Source: Bloomberg Finance LP.
The second factor shaping the response of EME financial indicators to recent developments has been the fundamental macroeconomic vulnerabilities of the EMEs themselves.5 Figure 2 examines the correlation between a cross-country measure of this vulnerability developed by Ahmed, Coulibaly, and Zlate (2017) and the change in EMEs' CDS spreads between mid-January and two different dates: the week of March 20, when global investor risk aversion was at its peak, and the week of August 28.6 These figures confirm that EMEs with relatively greater vulnerabilities, according to our measure, exhibited greater financial responses to the pandemic shock. For example, Brazil's CDS spreads rose much more than Korea's in March, and even after global markets calmed, their increase since pre-pandemic days remains greater.
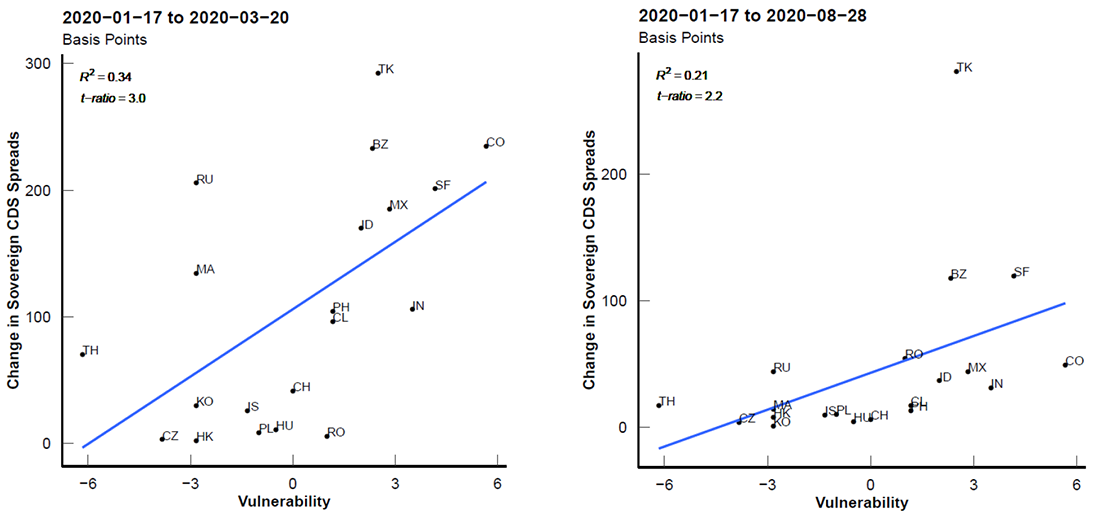
Source: Markit North America, Inc.
Note: 5-year CDS spreads are used. Country abbreviations are as follows: BZ = Brazil, CH = China, CL = Chile, CO = Colombia, CZ = Czech Republic, HK = Hong Kong, HU = Hungary, ID = Indonesia, IN = India, IS = Israel, KO = Korea, MA = Malaysia, MX = Mexico, PH = Philippines, PL = Poland, RO = Romania, RU = Russia, SF = South Africa, TH = Thailand, TK = Turkey.
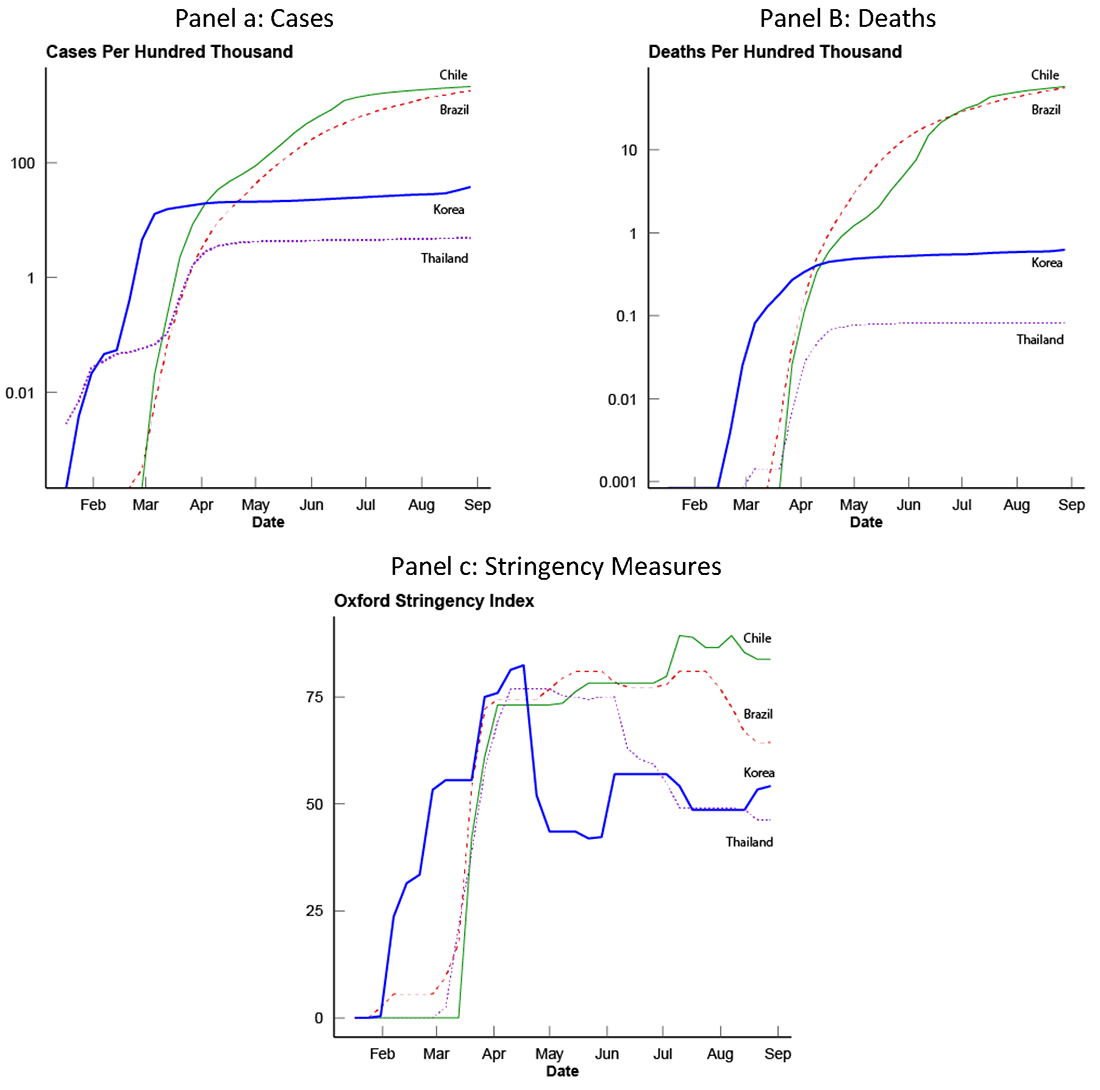
Finally, the question we seek to address is whether, controlling for both global systemic factors and country-specific macroeconomic vulnerabilities, we can identify additional, idiosyncratic effects of the spread of COVID-19 and the corresponding measures taken to limit that spread on EME financial conditions. Figure 3 below provides some examples of the range of different pandemic outcomes in some EMEs. COVID-19 cases and deaths per hundred thousand inhabitants are drawn from Johns Hopkins University's Coronavirus Resource Center.7 Indexes of the stringency of pandemic restrictions come from the Oxford University Coronavirus Government Response Tracker.8 At one end of the spectrum, Korea and Thailand have managed to keep rates of cases and deaths reasonably subdued, allowing the stringency of pandemic restrictions to be relaxed. At the other end, Chile and Brazil have struggled to bring the virus fully under control, requiring stringent restrictions to remain in place for longer.
We now return to our central question: Have countries with worse pandemic outcomes experienced greater financial pressures? Our vehicle for examining the impact of the pandemic on EME financial indicators are the panel regressions mentioned earlier. These draw on weekly data since mid-January for up to 22 EMEs. For each regression, the dependent variables are the levels of the exchange rate against the dollar, the CDS spread, and the national equity price index, respectively.9 The explanatory variables include the VIX index, an index of U.S. high-yield corporate spreads, the number of cases (or deaths) per hundred thousand, and the Oxford Stringency Index (OSI). We interact all of these variables with the vulnerability index and include country fixed effects in the regression.10
Table 1 presents the estimation results based on the number of COVID-19 deaths as a measure of the pandemic's spread. (The appendix table presents the estimates for the model using COVID-19 cases, with similar results.) As can be seen, a widening in U.S. credit spreads was associated with a significant weakening of EME currencies, rising CDS premiums and lower equity valuations, and such effects are notably stronger for more vulnerable EMEs. Similar observations apply to the VIX index, which is regarded as a key barometer of risk appetite in equity markets and is highly correlated with the high-yield spread. After controlling for the tone of global financial markets, variables that directly measure the spread of the virus—cases and deaths—generally are not statistically significant or even have the wrong sign.11 This may reflect a lack of reliable and consistent measurement of COVID-19 cases and deaths in EMEs.12 However, the Oxford Stringency Index variable exerts consistent and statistically significant effects on EME financial conditions: More stringent restrictions depreciate currencies, widen credit spreads, and push down equity prices. Hence, our results emphasize economically and statistically significant effects of the lockdowns and other measures that restricted economic activity to prevent spread of the virus.13
Table 1: Effects of COVID-19 Outcomes (Deaths) and Other Drivers on EME Asset Prices
| VARIABLES | Currency | CDS | Equity |
|---|---|---|---|
| US High Yield Spread | 0.023*** | 0.248*** | -0.057*** |
| (0.004) | (0.055) | (0.007) | |
| US High Yield Spread x Vul. | 0.003** | 0.055*** | -0.004*** |
| (0.001) | (0.02) | (0.001) | |
| Log VIX | -0.002 | 0.021 | -0.052*** |
| (0.006) | (0.09) | (0.016) | |
| Log VIX x Vul. | 0 | -0.02 | 0.005*** |
| (0.001) | (0.02) | (0.002) | |
| Deaths | -0.049 | 0.138 | -0.158** |
| (0.032) | (0.196) | (0.071) | |
| Deaths x Vul. | 0.050*** | -0.063 | 0.081*** |
| (0.016) | (0.15) | (0.02) | |
| OSI | 0.041*** | 0.256** | -0.058*** |
| (0.009) | (0.107) | (0.018) | |
| OSI x Vul. | 0.004* | 0.051 | 0.005 |
| (0.002) | (0.037) | (0.005) | |
| No. of Observations | 692 | 659 | 692 |
| R2 | 0.81 | 0.81 | 0.84 |
| Within R2 | 0.54 | 0.59 | 0.79 |
Note: All regressions include country fixed effects. Within R2 refers to the proportion of the variation in EME asset prices that is explained by model after removing country fixed effects. Driscoll and Kraay (1998) standard errors in parentheses. ***, **, and * indicate significance at 1, 5, and 10 percent levels. Vul. denotes the Vulnerability Index. Currency and equity prices are log values of indexes scaled to 100 at the beginning of the sample period, with currencies expressed in foreign currency per U.S. dollar so that higher values signal depreciation. CDS spreads are in basis points scaled to zero at the beginning of the sample period.
Using the regression results in Table 1, we now calculate how much of the path of the EME financial indicators reflects the direct, idiosyncratic effects of the pandemic variables themselves. Figure 4 below compares the average paths of changes in EME currencies, credit spreads, and equity prices with (1) the predictions of our estimated regression model, and (2) the contributions to those predictions, based solely on the movements in the U.S. financial variables. Thus, the difference between the two predictions represents the contributions of the country-specific COVID-19 variables.
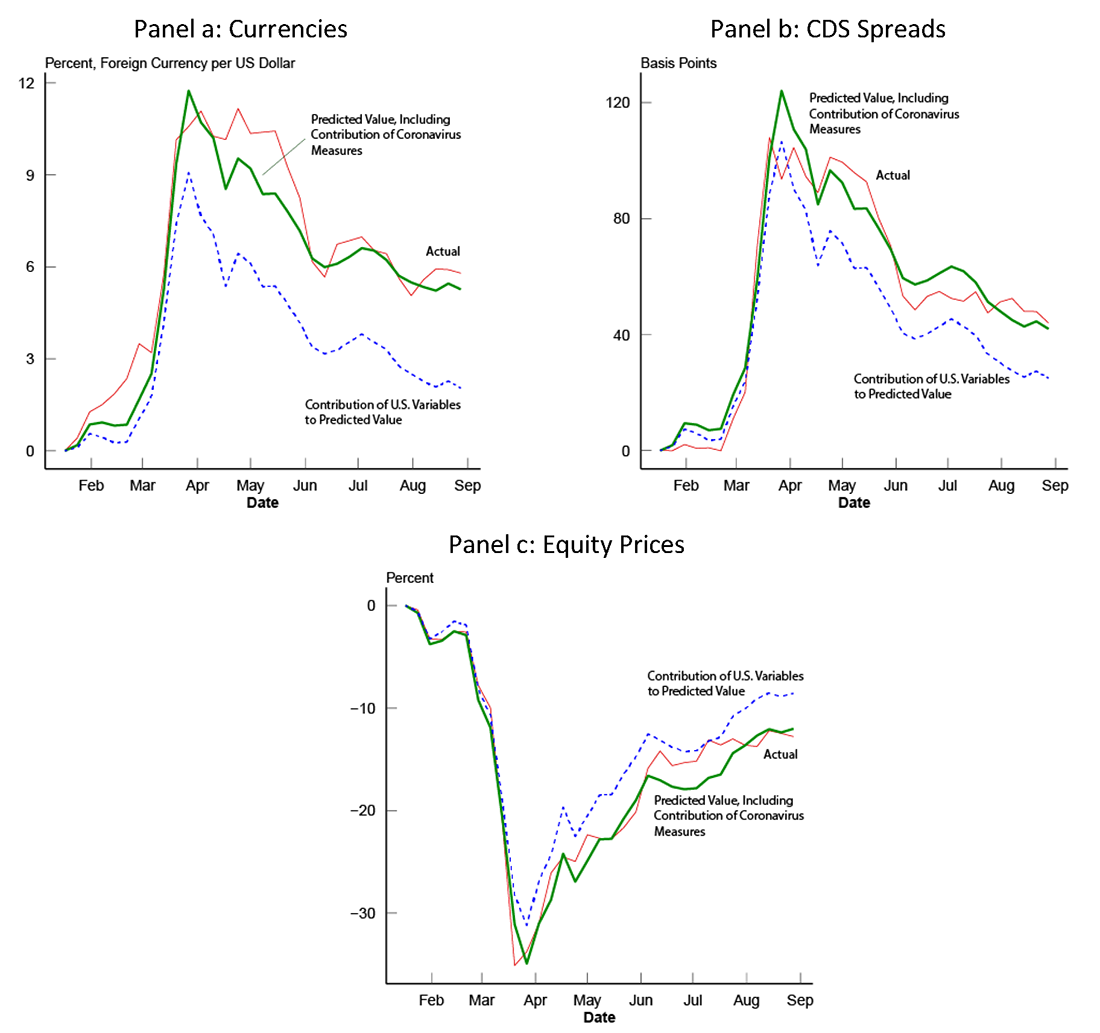
Note: Coronavirus measures come from deaths per hundred thousand and Oxford Stringency Index values.
As can be seen, comparing the red lines (actual) with the green lines (predicted), the models do a good job of tracking the broad contours of financial market developments in the EMEs. The basic trajectory of those developments clearly reflects the movements in the U.S. financial variables, which led to sharp currency depreciations, widening of credit spreads, and declines in equities early on, followed by substantial rebounds. But the gap between the contributions of the U.S. variables (blue lines) and the overall predictions of the models (green lines) points as well to an important role for country-specific developments related to the coronavirus, particularly the restrictions undertaken in response. These factors both exacerbated the initial downturn in EME financial markets and restrained its subsequent improvement.
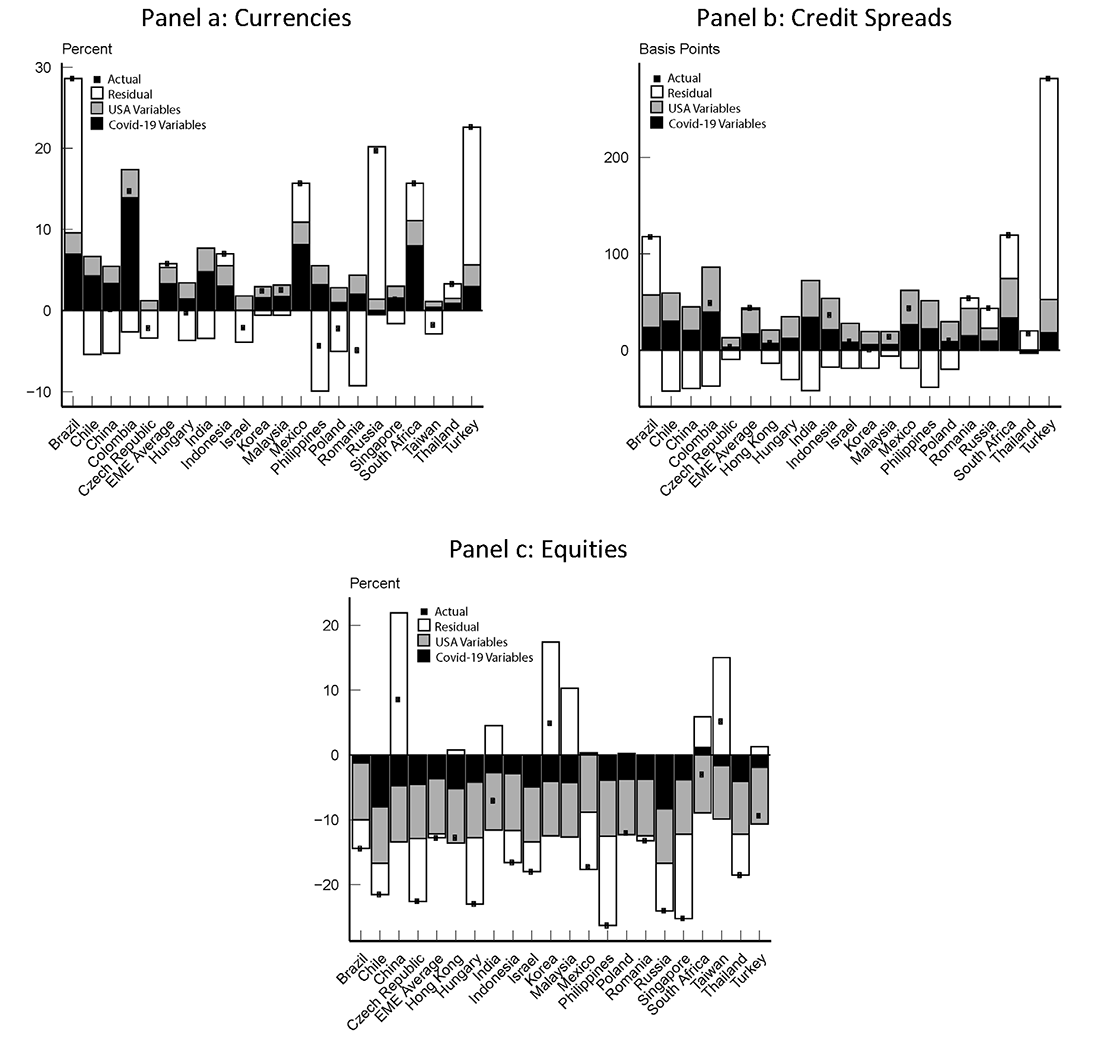
Note: The dots in the panels represent the actual cumulative changes in financial variables in each EME from January 17 to August 28, 2020. The bars represent the cumulative contributions of U.S. financial variables (high-yield spread, VIX and their interactions), Covid-19 variables (deaths per hundred thousand, Oxford Stringency Index and their interactions) and residuals for each EME as predicted by the regressions in Table 1.
Figure 5 (above) presents the contributions to the change in EME financial variables from mid-January to the end of August for each country. As can be seen, for most countries, U.S. financial variables (the gray bars) had an important effect, although there is substantial heterogeneity in these spillovers across countries, especially for currencies and credit spreads. There is also substantial variation across countries in Covid-related effects (the black bars), again especially for currencies and credit spreads. For some countries, such as Colombia, Mexico, and South Africa, Covid-related factors have contributed substantially to asset price movements since January.
All told, these findings underscore the grave challenges that may face many EMEs in the months to come. As noted earlier, downdrafts in EME financial markets could substantially complicate the task of normalizing their economies, and such downdrafts could materialize either as a result of a renewed surges in global financial volatility or a worsening of the pandemic in individual countries. Moreover, these results highlight that governments face a critical problem. Strengthening restrictions to contain the pandemic will lead to tighter financial conditions which will limit economic activity, but continuing to ease restrictions to support activity risks allowing the pandemic to spread more, thus requiring more stringent restrictions with greater financial repercussions in the future. Only a coherent and integrated approach that simultaneously addresses both public health and economic needs will achieve sustainable recovery. But identifying and implementing such an approach will be no easy task.
References
Ahmed, S., Coulibaly, B. and Zlate, A., 2017. International financial spillovers to emerging market economies: How important are economic fundamentals? Journal of International Money and Finance, 76, pp.133-152.
Alves, T.H.E., de Souza, T.A., de Almeida Silva, S., Ramos, N.A. and de Oliveira, S.V., 2020. Underreporting of death by COVID-19 in Brazil's second most populous state. medRxiv.
Bowman, D., Londono, J.M. and Sapriza, H., 2015. U.S. unconventional monetary policy and transmission to emerging market economies. Journal of International Money and Finance, 55, pp.27-59.
Brauning, F. and Ivashina, V., 2020, U.S. Monetary Policy and Emerging Market Credit Cycles. Journal of Monetary Economics, 112, pp. 57-76.
Chen, J., Mancini-Griffoli, T. and Sahay, R., 2014. Spillovers from United States Monetary Policy on Emerging Markets: Different This Time? (No. 14-240). International Monetary Fund.
Deb, P., Furceri, D., Ostry, J.D. and Tawk, N., 2020. The economic effects of Covid-19 containment measures. Covid Economics, 24-1, pp.32-75.
Dong, E., Du, H., and Gardner, L., 2020. An interactive web-based dashboard to track COVID-19 in real time. The Lancet Infectious Diseases, 20(9), pp.533-534
Driscoll, J.C. and Kraay, A.C., 1998. Consistent covariance matrix estimation with spatially dependent panel data. Review of economics and statistics, 80(4), pp.549-560.
Esteves, R. and Sussman, N., 2020. Corona spreads to emerging markets. Djankov, S. and Panizza, U., eds., Covid-19 in Developing Countries, CEPR Press, VoxEU.org, pp. 362-373.
Hoek, J., Kamin, S. and Yoldas, E., 2020, When is Bad News Good News? U.S. Monetary Policy, Macroeconomic News, and Financial Conditions in Emerging Markets. International Finance Discussion Papers 1269. Board of Governors of the Federal Reserve System (United States).
Hoffman, B., Shim, I. and Shin, H.S., 2020, Emerging market economy exchange rates and local currency bond markets amid the Covid-19 pandemic. BIS Bulletin No. 5.
Hördahl, P., and Shim, I., 2020, EME Bond Portfolio Flows and Long-term Interest Rates during the Covid-19 Pandemic. BIS Bulletin No. 18.
Lau, H., Khosrawipour, T., Kocbach, P., Ichii, H., Bania, J. and Khosrawipour, V., 2020. Evaluating the massive underreporting and undertesting of COVID-19 cases in multiple global epicenters. Pulmonology.
Appendix
Table 2: Effects of COVID-19 Outcomes (Cases) and Other Drivers on EME Asset Prices
| VARIABLES | Currency | CDS | Equity |
|---|---|---|---|
| US High Yield Spread | 0.022*** | 0.252*** | -0.055*** |
| (0.004) | (0.056) | (0.007) | |
| US High Yield Spread x Vul. | 0.002*** | 0.061*** | -0.002* |
| (0.001) | (0.019) | (0.001) | |
| Log VIX | 0 | 0.015 | -0.055*** |
| (0.006) | (0.089) | (0.017) | |
| Log VIX x Vul. | 0 | -0.024 | 0.004* |
| (0.001) | (0.02) | (0.002) | |
| Cases | -0.001 | -0.003 | -0.003** |
| (0.001) | (0.005) | (0.001) | |
| Cases x Vul. | 0.001*** | 0.003 | 0.003*** |
| (0) | (0.004) | (0) | |
| OSI | 0.047*** | 0.254** | -0.060*** |
| (0.008) | (0.1) | (0.02) | |
| OSI x Vul. | 0.005*** | 0.032 | -0.002 |
| (0.001) | (0.034) | (0.004) | |
| No. of Observations | 693 | 660 | 693 |
| R2 | 0.8 | 0.81 | 0.86 |
| Within R2 | 0.53 | 0.59 | 0.81 |
Note: All regressions include country fixed effects. Within R2 refers to the proportion of variation in EME asset prices that is explained by model after removing country fixed effects. Driscoll and Kraay (1998) standard errors in parentheses. ***, **, and * indicate significance at 1, 5, and 10 percent levels. Vul. denotes the Vulnerability Index. Currency and equity prices are log values of indexes scaled to 100 at the beginning of the sample period, with currencies expressed in foreign currency per U.S. dollar so that higher values signal depreciation. CDS spreads are in basis points scaled to zero at the beginning of the sample period.
* Shaghil Ahmed, Jasper Hoek, Ben Smith, and Emre Yoldas are affiliated with the Federal Reserve Board, Division of International Finance. Steve Kamin is a resident scholar at the American Enterprise Institute. The authors would like to thank John Ammer, John Clark, and Matteo Iacoviello for useful comments and suggestions. Return to text
1. See, for example, Hoffman, Shim, and Shin (2020) and Hördahl and Shim (2020). Return to text
2. Esteves and Sussman (2020) relate emerging market currencies and bond spreads to Covid-19 deaths, among other variables, in daily panel regressions. They find little consistent effect of the Covid-19 variable, and do not examine the role of coronavirus restrictions. Return to text
3. Movements in exchange rates, credit spreads, and equity prices are well-correlated with movements in capital flows to EMEs. Our analysis focuses on these financial indicators because they are more timely and more readily available for a wide range of EMEs than comprehensive data on capital flows. Return to text
4. See, for example, Brauning and Ivashina (2020) and Hoek, Kamin and Yoldas (2020). Return to text
5. A considerable literature supports the role of fundamentals in affecting the response of EME financial outcomes to U.S. and global financial developments, including Ahmed, Coulibaly and Zlate (2017), Bowman, Londono and Sapriza (2015) and Chen, Mancini-Grifolli and Sahay (2014). Return to text
6. For each year in our sample, we first order EMEs according to six indicators of vulnerability: current account deficit as a percent of GDP, gross government debt as a percent of GDP, average annual inflation over the past three years, the five-year change in bank credit to the private sector as a share of GDP, the ratio of external debt to exports, and the ratio of foreign exchange reserves to GDP. We then average the rankings across indicators for each EME to come up with a country vulnerability rank. With the 22 EMEs in our sample, plus Argentina (which is not in our estimation sample owing to data constraints), the values can theoretically range from 1 (least vulnerable) to 23 (most vulnerable) if a country ranks highest or lowest for all six components of the index. In practice, the vulnerability rank ranges from 5.8 to 18.2 in our sample. The final step we take is subtracting the mean rank across countries from the rank of each country in our sample so that this measure has a mean of zero in our sample. Return to text
7. See Dong, Du, and Gardner (2020). Further details on COVID-19 case and death data can be found at https://coronavirus.jhu.edu/. It is well understood that the accuracy of the case/death data may vary, depending on the extent of testing, methods of classifying deaths, and other factors that vary considerably across countries. Our assumption is that these data are broadly consistent with actual pandemic outcomes across countries, and that markets take these data into account, even as they may look at other developments as well. Return to text
8. T. Hale, S. Webster, A. Petherick, T. Phillips, and B. Kira. (2020). Oxford COVID-19 Government Response Tracker. Blavatnik School of Government. Available: www.bsg.ox.ac.uk/covidtracker Return to text
9. Estimations using weekly changes in the dependent and explanatory variables yielded results that were broadly similar but less statistically significant than the estimations in levels. Return to text
10. We base inference on Driscoll and Kraay (1998) standard errors. Return to text
11. This is consistent with findings reported by Esteves and Sussman (2020). Return to text
12. Lau et al. (2020) find vast underreporting of Covid-19 cases and argue that mortality data seem to be more precise. However, several studies find significant underreporting of Covid-19 deaths as well, especially in developing economies. See, for example, Alves, de Souza, de Almeida Silva, Ramos, and de Oliveira (2020). Return to text
13. Deb, Furceri, Ostry and Tawk (2020) quantify the impact of containment measures using real-time indicators of economic activity and find very large effects (equivalent to a loss of about 15 percent in industrial production over a 30-day period following the implementation of containment measures). Arrelano, Bai and Mihalache (2020) analyze the economic impact of lockdown measures by integrating a susceptible-infected-recovered (SIR) model into a sovereign default framework. They conclude that lockdowns pose substantial economic costs and increase the risk of default notably. Return to text
Ahmed, Shaghil, Jasper Hoek, Steve Kamin, Ben Smith, and Emre Yoldas (2020). "The Impact of COVID-19 on Emerging Market Economies' Financial Conditions," FEDS Notes. Washington: Board of Governors of the Federal Reserve System, October 07, 2020, https://doi.org/10.17016/2380-7172.2749.
Disclaimer: FEDS Notes are articles in which Board staff offer their own views and present analysis on a range of topics in economics and finance. These articles are shorter and less technically oriented than FEDS Working Papers and IFDP papers.