FEDS Notes
July 28, 2023
The Persistent Urban Shortfall in Leisure and Hospitality Employment
Brendan J. Chapuis, Seth Murray, and Brendan M. Price1
Introduction
As a high-contact service sector with limited capacity for remote work, the US leisure and hospitality sector—which includes restaurants, bars, hotels, museums, and movie theaters—was hit particularly hard by the COVID-19 pandemic. In the first two months of the pandemic, leisure and hospitality lost over 8 million jobs, nearly half its employment (Figure 1, solid red line). In those same two months, the rest of the private sector (dashed blue line) lost about 13 million jobs—such that leisure and hospitality accounted for almost 40 percent of private-sector job losses, despite comprising just 13 percent of pre-pandemic private employment. In the subsequent recovery, leisure and hospitality has consistently posted monthly job gains far in excess of what was typical before the pandemic. But even as of May 2023, employment in leisure and hospitality remained about 350,000 below its February 2020 level. Since the sector was poised to keep growing in the absence of the pandemic, the true shortfall is undoubtedly larger.
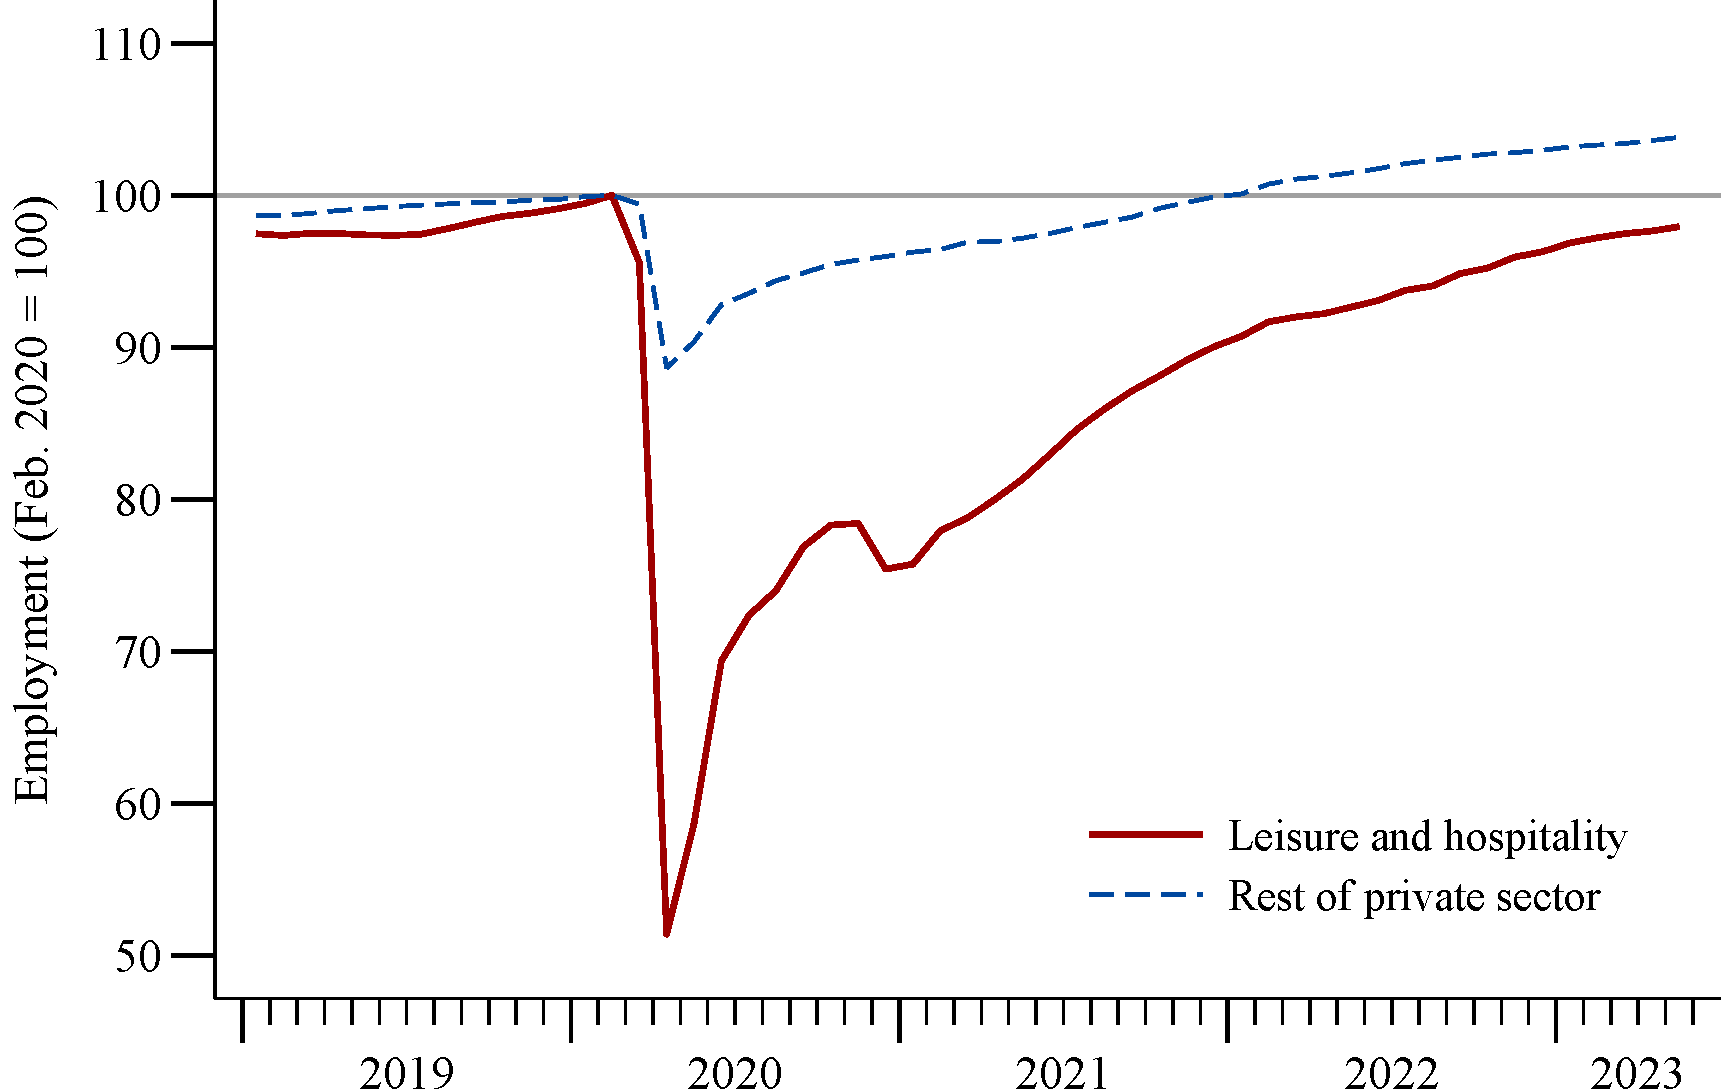
Note: Seasonally adjusted monthly employment.
Source: Bureau of Labor Statistics (Current Employment Statistics).
In this Note, we show that the employment shortfall in leisure and hospitality has been heavily concentrated in the densest counties within the largest metro areas. Since the start of the pandemic, these dense urban cores have seen especially low foot traffic to restaurant, recreation, and retail establishments, as many urban professionals have shifted to more remote work. In tandem with weaker demand for leisure services in dense urban cores, the sector's labor demand is also particularly depressed in these areas. At the same time, demographic patterns in the pre-pandemic workforce suggest that leisure and hospitality businesses in denser areas faced more acute labor supply shortages than those in less dense areas. Tellingly, the number of restaurants and bars in dense urban areas remains well below its pre-pandemic trend, suggesting that the pandemic's imprint on the geography of leisure and hospitality employment is likely to persist.
I. The employment shortfall in dense urban cores
We measure local employment shortfalls in leisure and hospitality—"LH" for short—using county-level data from the Quarterly Census of Employment and Wages (QCEW). Figure 2 plots LH employment in three geographic categories: "dense urban cores", which we identify by selecting the densest county within each of the 40 largest metro areas; "other urban counties", which include both smaller metros and the peripheries of larger metros; and "rural counties".2 Relative to other counties, dense urban cores (solid red line) saw similar growth in LH employment before the pandemic but a steeper drop in spring 2020 and a much weaker recovery in subsequent months. The urban deficit has proven persistent: whereas dense urban cores comprised just 23 percent of LH employment in February 2020, they accounted for 49 percent of the employment shortfall as of December 2022, the latest month for which QCEW data are available.3
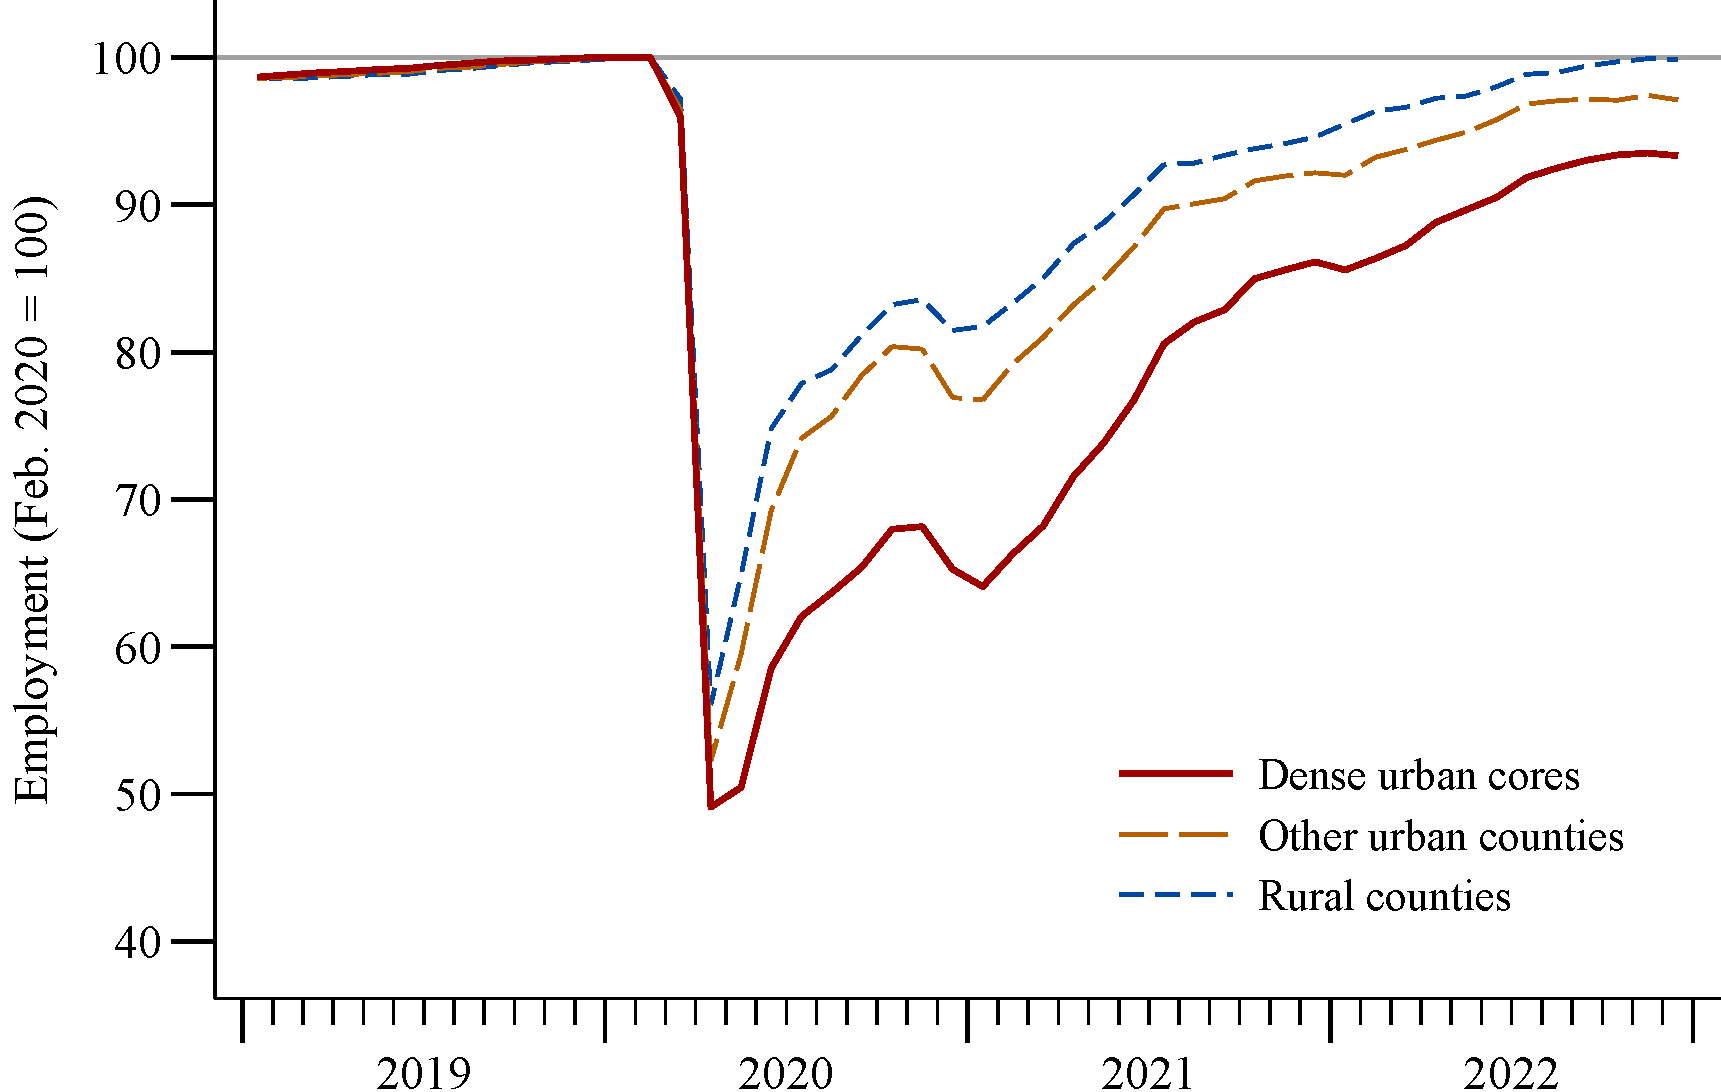
Note: The source data report county-level monthly employment. We sum employment across counties within each of the three metro categories defined in footnote 2, then seasonally adjust each series using pre-pandemic data.
Source: Bureau of Labor Statistics (Quarterly Census of Employment and Wages) and author calculations.
II. Weak demand in dense urban cores
Just as LH employment losses have been most acute in dense urban cores, so too has demand for leisure services been especially weak in these areas. Using data from Google's COVID-19 Community Mobility Reports, Figure 3 plots the number of trips to restaurant, recreation, and retail establishments in each metro category.4 At the outset of the pandemic, such trips fell more sharply in dense urban cores (solid red line) than in other counties. As of September 2022 (after which these data were discontinued), trips had largely recovered in other counties, but they remained well below pre-pandemic levels in dense urban cores. At the county level, we find a positive and statistically significant relationship between shortfalls in leisure and retail trips and shortfalls in LH employment: foregone trips account for just over one-third of the variation in counties' employment shortfalls in the last month of data.
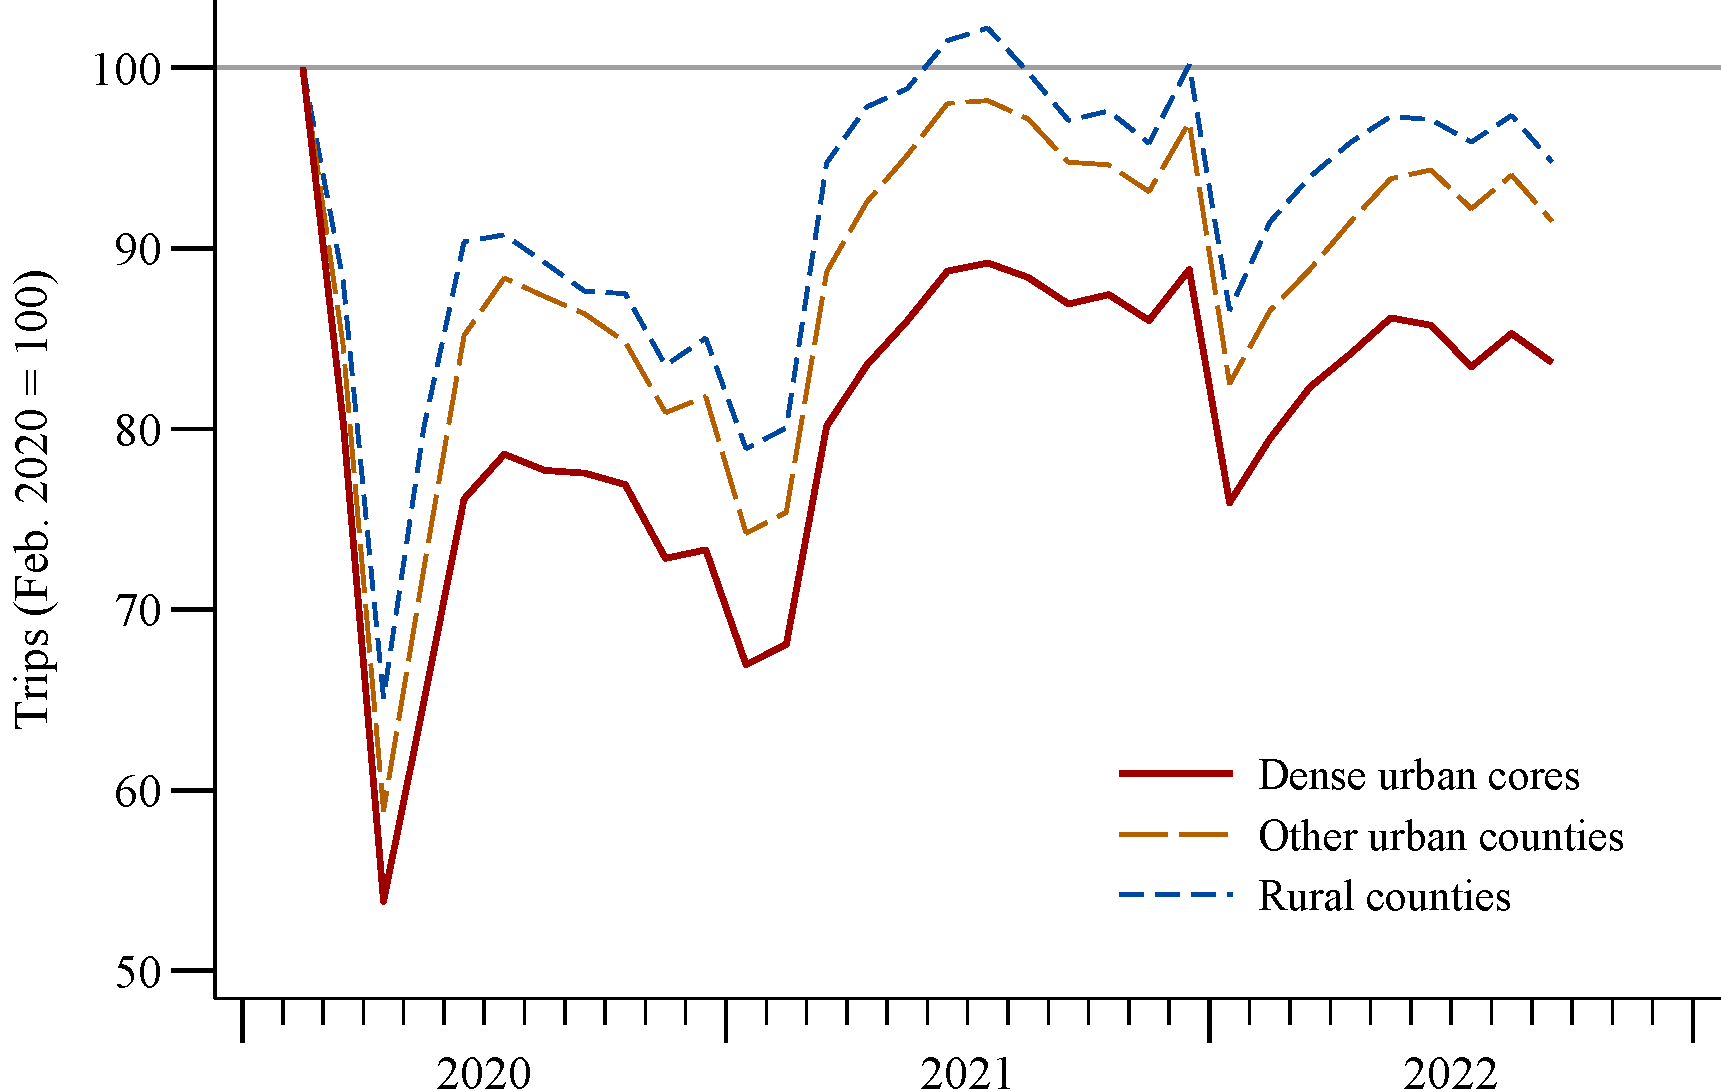
Note: The source data report county-level percent changes in daily trips to restaurant, recreation, and retail establishments relative to the weeks leading up to the pandemic. For a balanced panel of 1316 counties observed throughout the period shown, we average county-level changes in trips across all weekdays in a given month, compute population-weighted averages across all counties within each metro category, and then index each series to February 2020. The series are not seasonally adjusted, owing to the limited available history.
Source: Google COVID-19 Community Mobility Reports and author calculations.
The shortfall in leisure and retail trips in dense urban cores mirrors the elevated incidence of remote work.5 Kastle Systems reports that, as of June 2023, the number of workers badging into office buildings in the 10 largest metro areas remained 50 percent below its pre-pandemic level. Althoff, Eckert, Ganapati, and Walsh (2022) show that the shift away from in-person work during the pandemic, particularly among white-collar workers, disproportionately reduced demand for restaurants, bars, and hotels in the urban cores where these workers tended to work in-person prior to the pandemic.6
Weak demand for leisure services has translated into weak demand for labor. Since both filled jobs and vacant jobs signify employer demand, Figure 4 plots the sum of LH employment (as reported in the QCEW) and LH job postings (as reported by Lightcast, an aggregator of online job boards).7 This measure of labor demand again shows a persistent shortfall in dense urban cores (solid red line), whereas in other counties demand now exceeds pre-pandemic levels. The stronger rebound of labor demand in these other areas may reflect, in part, a reallocation of demand from city centers. With more opportunities to work remotely, some workers who previously commuted to city centers are spending more time in—or relocating to—less dense areas, where they are likely boosting demand for LH services and labor.8
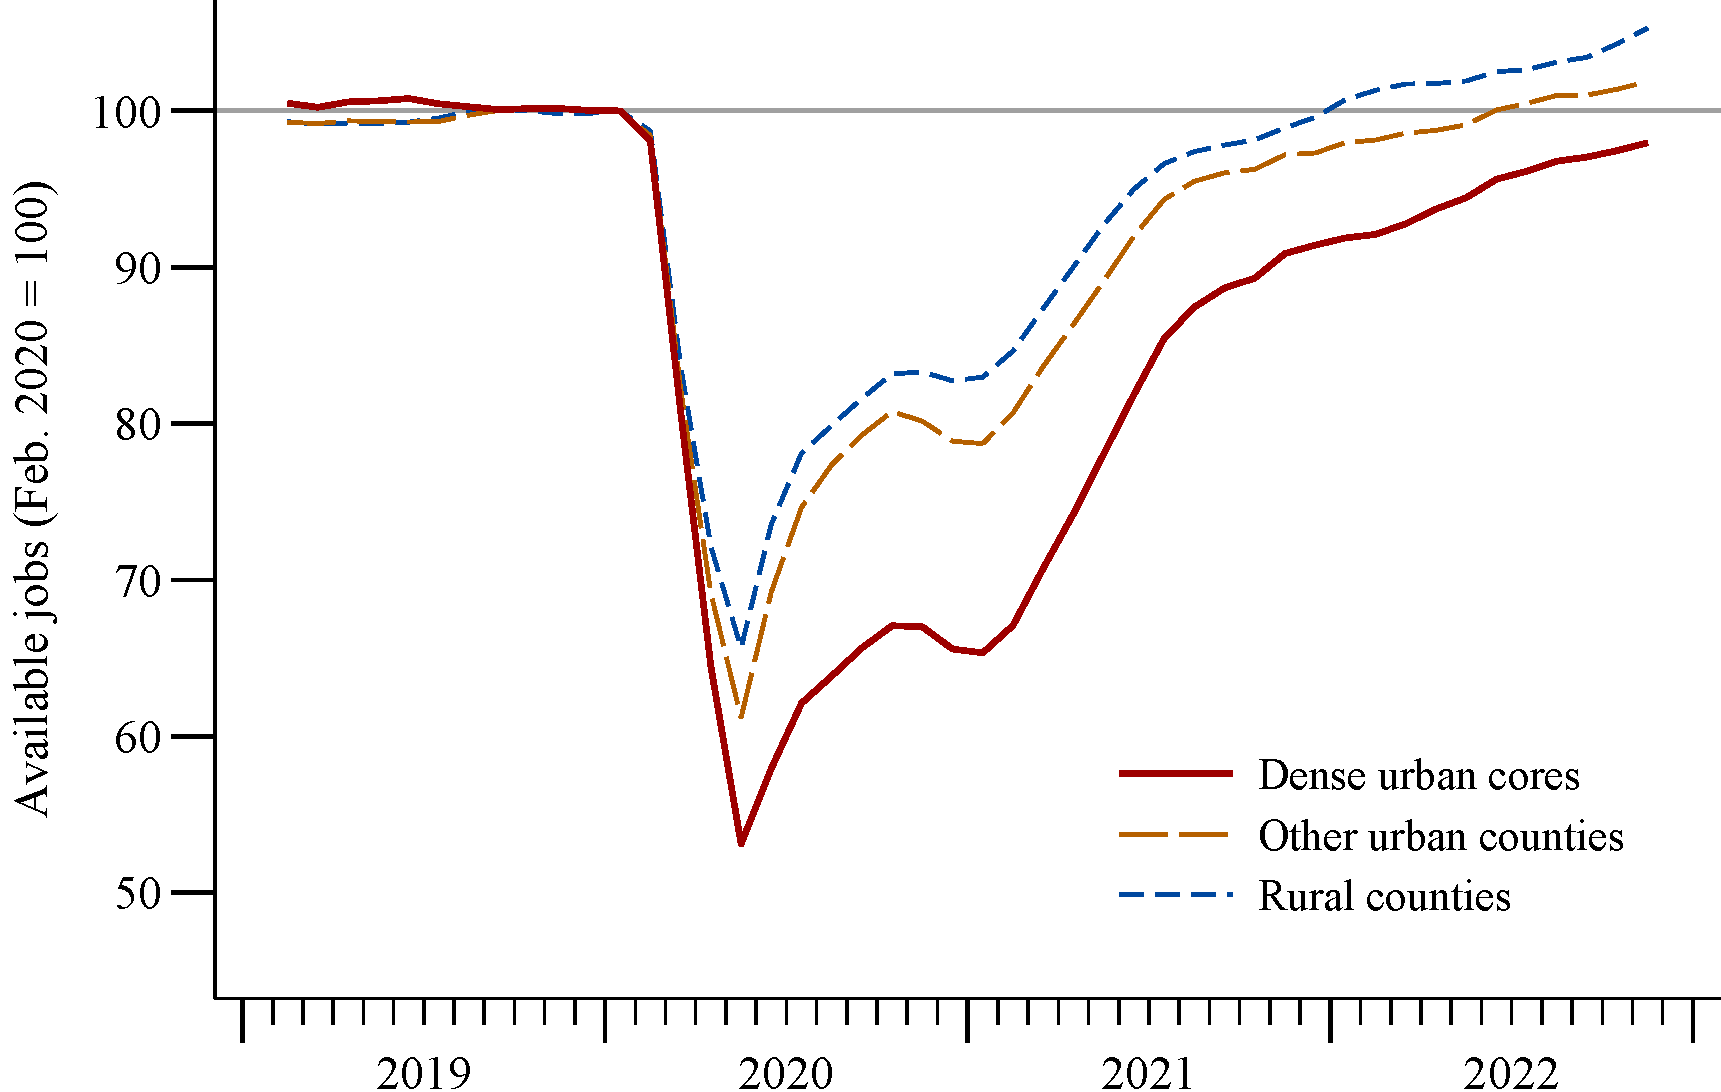
Note: We define monthly available jobs as the sum of employment and job openings. We compute employment as in Figure 2. We compute job openings by rescaling county-level Lightcast data on new online job postings so that they sum to national leisure and hospitality job openings as reported in JOLTS. All series are seasonally adjusted and shown as centered three-month moving averages relative to the three months preceding the pandemic.
Source: Bureau of Labor Statistics (Quarterly Census of Employment and Wages, Job Openings and Labor Turnover Survey), Lightcast job postings, and author calculations.
III. Workforce composition and the role of labor supply
Although geographic differences in demand for leisure services can go a long way towards explaining these patterns, the pandemic's pronounced effects on labor supply likely played a role as well. Data from the Current Population Survey indicate that, relative to other areas, LH employment in dense urban cores has been more exposed to some of the pandemic's labor supply shocks but less exposed to others.9
Early in the pandemic, the abrupt shift to remote schooling curtailed labor supply among parents of school-age children, especially mothers (Montes, Smith, and Leigh, 2021). Since women are disproportionately represented in leisure and hospitality relative to other sectors (Table 1, line 1), childcare disruptions likely contributed to the particularly sharp drop in LH employment.10 Geographically, however, women make up a smaller share of LH employment in dense urban cores than in other areas, so gender patterns cannot explain the urban skew in the employment shortfall.
Table 1. Demographic composition of pre-pandemic employment (percent)
| Other private sector | Leisure and hospitality | ||||
|---|---|---|---|---|---|
| Nationwide | By metro category | ||||
| Dense urban | Other urban | Rural | |||
| By sex | |||||
| 1. Female | 47 | 51 | 48 | 52 | 54 |
| By nativity | |||||
| 2. Foreign-born | 19 | 22 | 32 | 21 | 14 |
| By age | |||||
| 3. 16–19 | 2 | 15 | 10 | 16 | 16 |
| 4. 20–24 | 8 | 18 | 16 | 18 | 19 |
| 5. 25–64 | 83 | 62 | 69 | 61 | 59 |
| 6. 65+ | 7 | 5 | 4 | 4 | 6 |
Note: Estimated shares of workers in the indicated sector belonging to each demographic group, computed from individual microdata over the 2019 calendar year using population weights. Metro categories are as defined in footnote 9.
Source: Bureau of Labor Statistics (Current Population Survey) via IPUMS and author calculations.
Immigration policy also responded abruptly to the pandemic, with border restrictions sharply curtailing net migration in 2020–21. Since immigrants tend to cluster in cities, the drop in international migration contributed to population losses in urban cores (Frey, 2023). And since foreign-born workers made up an outsized share of leisure and hospitality employment prior to the pandemic (Table 1, line 2), the sector was particularly exposed to the resulting reduction in labor supply. Dense urban cores were exposed still further, as a striking 32 percent of their LH workers had been foreign-born prior to the pandemic—more than twice the share in rural counties. Reduced immigration can therefore help explain the geography of job loss.
Lastly, the pandemic had pronounced effects on the age distribution of the workforce. At one end of the spectrum, teenagers increased their labor supply as the labor market tightened over the course of the pandemic. At the other end, the pandemic suppressed older workers' labor supply through increased mortality and a spate of early retirements (Montes, Smith, and Dajon, 2022).11 Since the LH workforce is much younger than the rest of the labor market—with many teenaged workers (Table 1, line 3) and few workers over 65 (Table 1, line 6)—the LH sector's age structure insulated it from the depressed labor supply of older workers. Returning to geography, however, dense urban cores may have benefited less from teenagers' increased labor supply, since LH employment in these areas had drawn less from this age group prior to the pandemic.
On net, impediments to labor supply were likely more acute for LH employers in dense urban cores than for those in other areas. First, LH employers in denser areas had been heavily reliant on foreign-born workers, whose numbers were held back by immigration restrictions during the pandemic. Second, these employers may have benefited less from teenagers' increased labor supply during the pandemic. While it is difficult to quantify the relative roles of labor supply versus labor demand, both sides of the market likely contributed to the concentration of LH employment shortfalls in dense urban cores.
IV. The missing restaurants and bars in dense urban cores
Alongside its effects on employment, the pandemic spurred a wave of temporary and permanent business closures. Using QCEW data, we find a persistent hit to the number of restaurants and bars operating in dense urban cores, relative to the number we would expect to exist in the absence of the pandemic.
Figure 5 plots the number of establishments, by metro category, in food services and drinking places, which account for nearly 75 percent of leisure and hospitality employment. At the start of the pandemic, the number of restaurants and bars fell across the board as government-mandated shutdowns took effect. But relative to other areas, dense urban cores (solid red line) experienced both a larger initial decline and a slower pace of subsequent growth. Whereas other areas have seen establishment counts largely recover to their pre-pandemic trends, the number of food services establishments in dense urban cores—though above pre-pandemic levels—remains well below its previous trend.12 The lingering shortfall in downtown foot traffic weakens business owners' incentives to keep their restaurants open or to create new ones. Along similar lines, Duguid, Kim, Relihan, and Wheat (2023) argue that urban cores experienced a larger decline in the number of retail establishments because they had more jobs suitable for remote work.
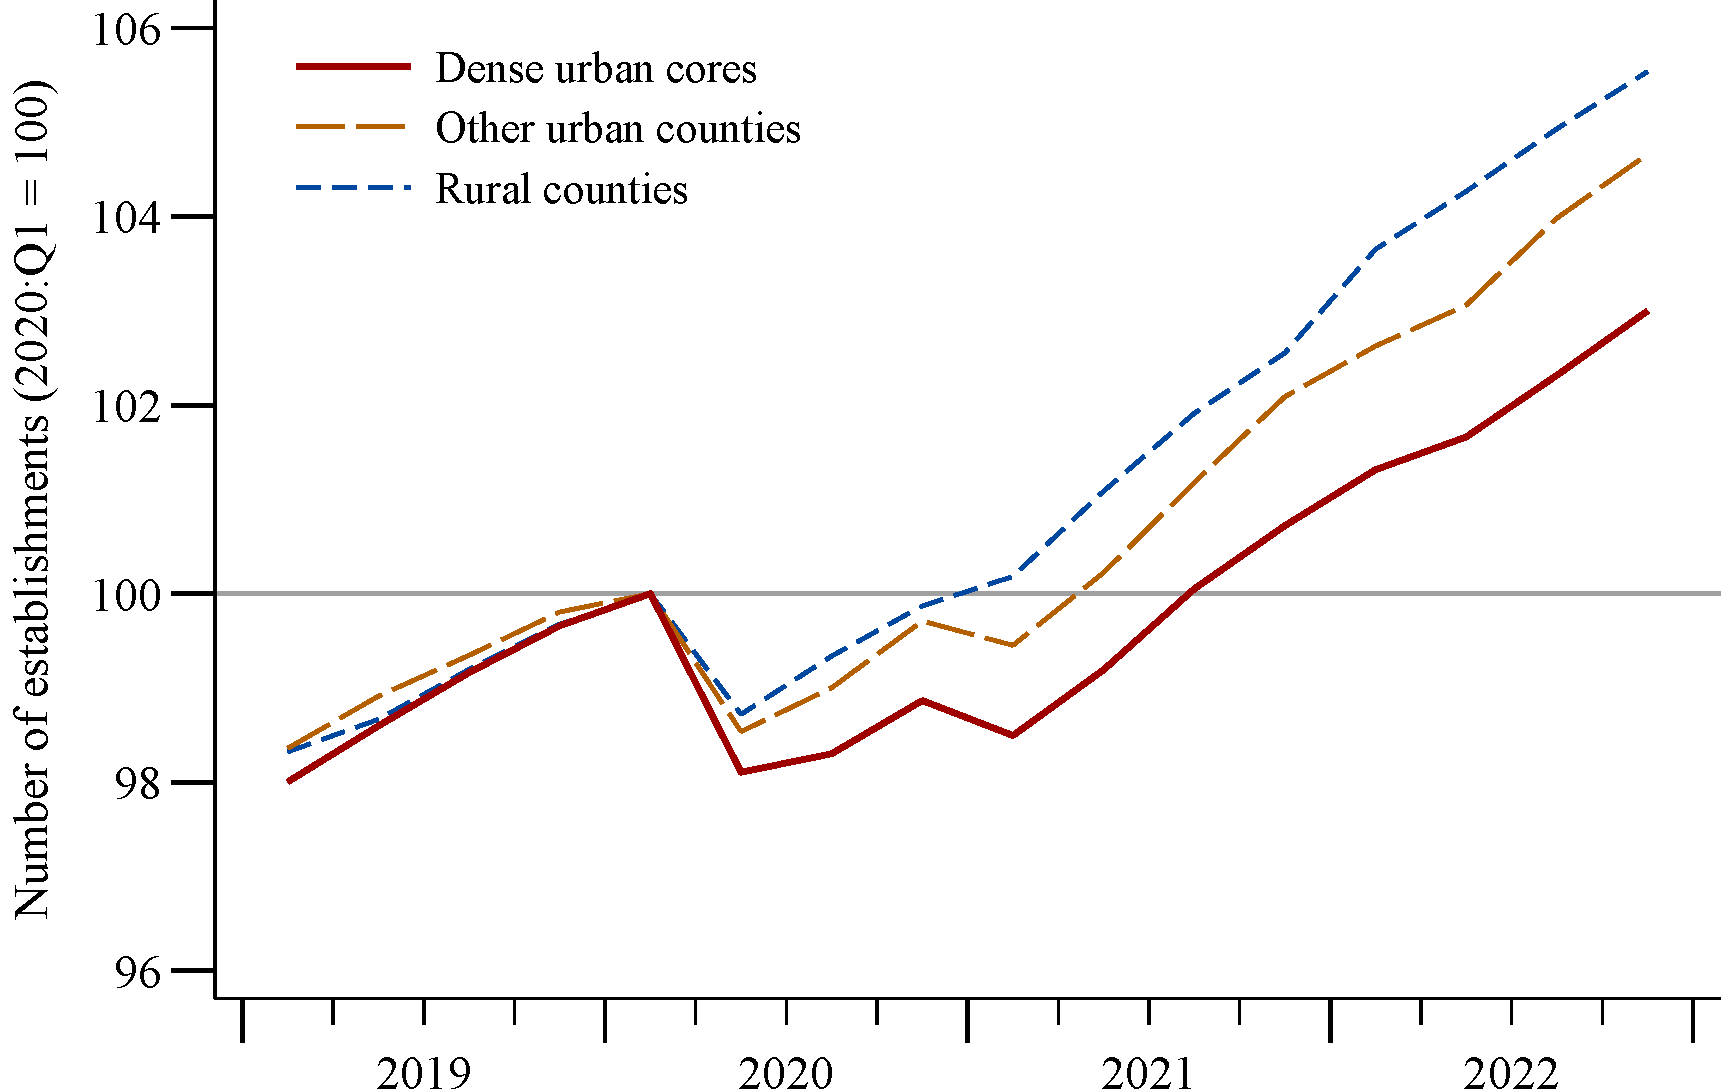
Note: The source data report quarterly county-level counts of establishments in the food services and drinking places industry. We sum establishments across counties within each metro category, seasonally adjust each series, and index it to 2020:Q1.
Source: Bureau of Labor Statistics (Quarterly Census of Employment and Wages) and author calculations.
By contrast, in all three metro categories the number of hotels and lodging places has largely returned to the levels implied by pre-pandemic trends. The stronger recovery in the number of accommodation establishments may reflect differences in the industries' cost structures. Relative to restaurants, hotels typically require much larger upfront fixed costs but comparatively lower ongoing operating costs, so that their owners have an incentive to reopen temporarily closed establishments and to complete new establishments already under development. Accommodation employment nonetheless remains depressed, especially in urban areas, as hotels have adapted to the pandemic by reducing their staffing levels.
The path ahead
Remote work will remain a fixture of the post-pandemic economy. Workers and firms have invested in work-from-home technology and adapted to remote or hybrid work. Many workers now expect increased flexibility around their on-site presence, and employers have revised their personnel policies accordingly. Fewer trips to the office imply fewer trips to downtown businesses that cater to office workers. As we look ahead, business formation can be a useful bellwether: because business entry and exit signal employers' expectations about future demand conditions, the missing restaurants and bars in dense urban cores suggest that entrepreneurs expect ongoing weakness in urban demand for leisure services. Absent a more robust return to the office, leisure and hospitality employment in large city centers is likely to remain below its pre-pandemic trend.
References
- Althoff, Lukas, Fabian Eckert, Sharat Ganapati, and Conor Walsh. 2022. "The Geography of Remote Work." Regional Science and Urban Economics, 93: 103770.
- Brueckner, Jan K., Matthew E. Kahn, and Gary C. Lin. 2023. "A New Spatial Hedonic Equilibrium in the Emerging Work-from-Home Economy?" American Economics Journal: Applied Economics, 15(2): 285–319.
- Court, Emma, Donna Borak, and Linly Lin. 2023. "Remote Work Is Costing Manhattan More Than $12 Billion a Year." Bloomberg, February 12, https://www.bloomberg.com/graphics/2023-manhattan-work-from-home.
- Duguid, James, Bryan Kim, Lindsay Relihan, and Chris Wheat. 2023. "The Impact of Work-from-Home on Brick-and-Mortar Retail Establishments: Evidence from Card Transactions." Working paper.
- Flood, Sarah, Miriam King, Renae Rodgers, Steven Ruggles, J. Robert Warren, and Michael Westberry. 2021. "Integrated Public Use Microdata Series, Current Population Survey: Version 9.0" [dataset]. Minneapolis, MN: IPUMS.
- Frey, William H. 2023. "Pandemic-Driven Population Declines in Large Urban Areas Are Slowing or Reversing, Latest Census Data Shows." Brookings Institution: Washington, DC.
- Gupta, Arpit, Vrinda Mittal, and Stijn Van Nieuwerburgh. 2022. "Work from Home and the Office Real Estate Apocalypse." NBER Working Paper No. 30526.
- King, Kate. 2023. "The Decline of the Five-Day Commute Is a Boon to Suburban Retail." The Wall Street Journal, May 9, https://www.wsj.com/articles/the-decline-of-the-five-day-commute-is-a-boon-to-suburban-retail-55e4dc89.
- Montes, Joshua, Christopher Smith, and Juliana Dajon. 2022. "'The Great Retirement Boom': The Pandemic-Era Surge in Retirements and Implications for Future Labor Force Participation." FEDS 2022-081. Washington: Board of Governors of the Federal Reserve System.
- Montes, Joshua, Christopher Smith, and Isabel Leigh. 2021. "Caregiving for Children and Parental Labor Force Participation during the Pandemic." FEDS Note. Washington: Board of Governors of the Federal Reserve System.
- Ramani, Arjun, and Nicholas Bloom. 2021. "The Donut Effect of COVID-19 on Cities." NBER Working Paper No. 28876.
- Rosenthal, Stuart S., William C. Strange, and Joaquin A. Urrego. 2022. "Are City Centers Losing Their Appeal? Commercial Real Estate, Urban Spatial Structure, and COVID-19." Journal of Urban Economics, 127: 103381.
1. Authors are employed at the Federal Reserve Board. The views expressed here are strictly those of the authors and do not necessarily represent the views of the Federal Reserve Board or its staff. Return to text
2. Our classification is based on the Combined Statistical Areas (CSAs) defined by the Office of Management and Budget. Within each of the 40 most populous CSAs—those with populations of at least 1.4 million—we define the "dense urban core" as the county with the highest ratio of total employment to land area. Examples include New York County, NY (Manhattan); Cook County, IL (Chicago); and Harris County, TX (Houston). "Other urban counties" include non-core counties of the largest CSAs as well as counties located in smaller CSAs. "Rural counties" are those not assigned to any CSA. Return to text
3. Employment in the rest of the private sector now exceeds its pre-pandemic level in all metro categories, though the non-LH employment recovery has also been less robust in dense urban cores than in other areas. Return to text
4. The Google measure includes trips to places such as restaurants, cafés, shopping centers, theme parks, museums, libraries, and movie theaters. Though no longer updated, the data remain publicly available at https://www.google.com/covid19/mobility. Return to text
5. A recent Bloomberg article on remote work and the Manhattan economy provides valuable color. Interviews with local restaurants suggest that many establishments have struggled to adapt to reduced traffic from office workers. The effects are especially noticeable for restaurants that had previously catered to the office lunch wave, with the drop in customers being most pronounced on Mondays and Fridays when more companies allow remote work. Furthermore, an interviewee from the hotel industry reports that business travelers have shortened their stays, often flying into the city only for mid-week days when offices are less empty (Court, Borak, and Lin, 2023). Return to text
6. Gupta, Mittal, and Van Nieuwerburgh (2022) show that office workers' reduced presence in downtown cores has held down commercial real estate demand and valuations. Rosenthal, Strange, and Urrego (2022) document that this effect is greatest in cities' most employment-dense ZIP codes and within cities where commuters rely more heavily on public transit (versus driving). Brueckner, Kahn, and Lin (2023) find a similar effect for residential real estate prices, with the shift to remote work tending to flatten the intra-city gradient of house prices. Ramani and Bloom (2021) label this shift in real estate demand from city centers to their peripheries the "donut effect" and show that it is associated with population movements in the same direction. Return to text
7. The Lightcast data likely fail to capture the full universe of LH job openings, not all of which are posted online. In addition, a single job posting may correspond to multiple available positions. To adjust for such undercounting, we estimate job openings by (1) aggregating Lightcast microdata on new online job postings across counties in each metro category, (2) seasonally adjusting each metro category total, and (3) proportionately rescaling such that the sum of job postings across metro categories equals national leisure and hospitality job openings as reported in the Job Openings and Labor Turnover Survey. Return to text
8. Recent reporting from the Wall Street Journal suggests that the decline in the five-day commute has prompted some restaurants and retail establishments to relocate from city centers to the suburbs. The article notes that some commercial real estate owners have reported record occupancy rates among their suburban properties, while several high-profile restaurant chains have made a marked push into the suburban market (King, 2023). Return to text
9. We access Current Population Survey (CPS) data via IPUMS (Flood et al., 2021). For confidentiality reasons, the CPS reports county of residence only for about half of respondents. To assign respondents to metro categories, we supplement these county codes with CPS variables reporting urban status (non-metro, metro central city, other metro) and specific metro area (where applicable). For this analysis, "dense urban cores" encompass respondents who live in a central city within one of the 40 largest CSAs; "other urban" includes all other metro residents; and "rural" includes those who reside outside a metro area. Return to text
10. Disruptions to parents' labor supply eased over the course of 2021 as schools returned to in-person instruction. The share of prime-age CPS respondents out of the labor force for caregiving reasons is now similar to its pre-pandemic level. Return to text
11. Among individuals aged 16–19, the labor force participation rate was 1.5 percentage points higher in May 2023 than in 2019 as a whole. Among those aged 65 or older, it was 1.0 percentage point lower. Return to text
12. As with food services, the number of establishments in arts, entertainment, and recreation—another component of the leisure and hospitality sector—remains notably below trend in dense urban cores. Return to text
Chapuis, Brendan J., Seth Murray, and Brendan M. Price (2023). "The Persistent Urban Shortfall in Leisure and Hospitality Employment," FEDS Notes. Washington: Board of Governors of the Federal Reserve System, July 28, 2023, https://doi.org/10.17016/2380-7172.3358.
Disclaimer: FEDS Notes are articles in which Board staff offer their own views and present analysis on a range of topics in economics and finance. These articles are shorter and less technically oriented than FEDS Working Papers and IFDP papers.